 Triplex
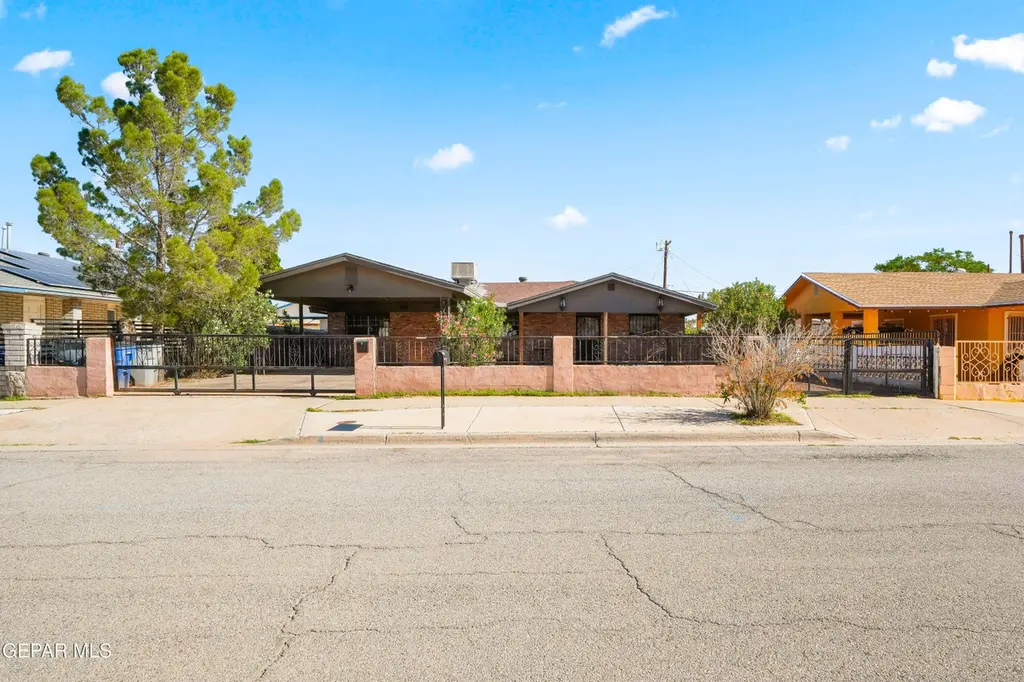
7163 Lavern Unit A-C · El Paso, TX
Flood risk 4/10 · Minor
- FEMA flood zone
- X (shaded)
- Chance of flooding over 30 yrs
- 0.24%
- Est. flood insurance / yr
- $507 – $1,088
Fire risk 1/10 · Minimal
- Est. fire insurance / yr
- $1,222 – $2,270
Heat risk 6/10 · Moderate
- Hot days now (above 102°F)
- 7 days/yr
- Hot days in 30 yrs
- 25 days/yr
Wind risk 1/10 · Minimal
- Chance of severe wind over 30 yrs
- —
Air-quality risk 2/10 · Minimal
- Unhealthy air days now
- 1 days/yr
- Unhealthy air days in 30 yrs
- 1 days/yr
Risk factors via First Street. Map © Google.
Why this score? — see what drove the B- grade
The composite is a weighted blend of 9 inputs, each scored 0–100. Each bar is that input's sub-score; the figure is the points it added to the 100-point composite (weight × sub-score).
- Cash flow +28.9/30.0
- DSCR +10.0/10.0
- 1% rule +8.0/10.0
- ARV discount +7.5/15.0
- Livability +4.0/5.0
- Schools +2.6/10.0
- Rent growth +2.5/5.0
- Condition / age +2.2/5.0
- Appreciation +0.0/10.0
$185,000
🖨 Deal sheet 📄 Offer letter ✓ Due diligence
Multi-family units
County records classify this as Multi-Family (2-4 Unit). Listing-text estimate: 3 units. confirmed
Listing remarks MLS
Fixer-Upper Multi-Family Investment Opportunity! Don't miss this rare triplex featuring two studio units and one spacious 2-bedroom unit—perfect for investors or owner-occupants looking to generate rental income. Each unit includes kitchen appliances, tile and laminate flooring, and the seller is offering a credit toward new carpet installation or buyers closing costs assistance. With two units currently vacant, there's immediate potential for an owner to move in and rent out the remaining units, or to fully lease the property for maximum cash flow. A great opportunity to add value and customize to your taste—bring your vision and unlock this property's full potential!
Key facts
- 6,098 sq ft lot
- Built 1975
- Listed 202 days
Neighborhood map
What this means for you Summary
Snapshot
- This is a 2×1bd/1ba + 1×2bd/1ba units multifamily listed at $185k. Condition is rated fair.
Deal economics
- At list price, monthly cash flow is $626 ($8k/yr) — positive. Per door: $209/mo.
- The deal already cash-flows at list — no discount required.
- Meets the 1% rule at list price ($2k rent vs $185k).
- Recommended offer: $163k (12.0% below list) — sets the bar for market timing.
Location & tenants
- Location reads 81/100 on livability (#23 in TX, #1,375 nationally) — a professional / high-income tenant draw. Strengths: commute A+, cost of living A+, housing A+; Watch: employment D+.
- Ysleta ISD (urban): math 27% / reading 35% proficiency, ranked #626 of 826 in TX (top 76%) — families likely to look elsewhere, expect single-tenant / working-renter base with shorter leases; 68% free/reduced lunch — lower-income household profile, screen leases tightly.
- Market conditions: 70 active listings in the ZIP; 7 comparable units currently listed for rent nearby; rentals at typical pace (median 24d on market — plan ~3-4 weeks tenant-placement turnaround); lower-income renter base — watch delinquency; 2,196 units permitted in El Paso County in 2024 (143 in 5+ unit buildings).
- At $2,411/mo this rent would consume 82% of the median local household income ($35k/yr) (locally 1145% of renters already pay >50% of income on rent) — very limited rent-growth headroom before tenants either downsize or default.
Forward outlook
- Local home prices are declining (-3.0%/yr); year-one equity from $1k of loan paydown is wiped out by about $6k of value loss. Plan a longer hold.
- El Paso County population projected at +10% by 2050 — modest demand growth; plan on rents tracking national, not racing it.
- At projected returns (-3.0% appreciation + 3.0% rent growth), your $52k cash investment doubles in ~9 years — after that, you're playing with house money.
Negotiation context
- It's been on market 202 days — a 12% lower offer ($163k) is reasonable based on typical stale-listing flexibility.
- 2 sale attempts with the ask held roughly flat each time — persistent listings suggest the price (not the market) is what's stuck; bring a comps-based counter.
Risks & watch-outs
- Climate carrying-cost: extreme-heat days projected 7→25/yr by 2055 (HVAC capex compounding) — expect insurance premiums to compound above CPI over the hold.
Questions for the listing agent
- It's been on market 202 days. Have you received any prior offers? Is the seller open to a 12% concession, seller financing, or rate buy-down credit?
- Can we see the unit-by-unit rent roll, current vacancy, and any below-market leases? What's the average tenancy length?
- What capital expenditures (roof, boiler, parking lot, exteriors) have been made in the last 5 years, and what's planned in the next 2?
- Have any recent inspections been done? Can we get a copy of the seller's disclosures and any deferred-maintenance estimates?
- Built in 1975 — when were the roof, HVAC, electrical panel, plumbing, and water heater last replaced?
- Why hasn't it sold? Are there any deal-killer items the seller is aware of (foundation, flood, title, zoning, code violations)?
- Is there a deadline driving the sale (1031 exchange, divorce, estate, relocation)? That informs how much negotiation room exists.
- Schools are B-rated — typically a magnet for longer-tenancy family renters. What's the average tenant stay here, and is there a school-zone premium baked into asking?
- What's the average days-on-market for RENTAL listings here right now (not sales)? A rising rental-DOM trend means longer vacancies and softer asking-rent achievability than the comps imply.
- What's the recent tenant-quality profile in this submarket — average credit score on applications, eviction rate, late-payment / NSF rate, and stable-employment percentage? A property-management company in the area should have these aggregated.
- How much new apartment / multifamily construction is in the pipeline within 1–3 miles? Heavy new supply (>2% of stock underway) typically softens rents 12–24 months out; light construction supports rent growth.
Investment metrics
- 1% rule
- 1.30% ✓
- Cap rate
- 10.35%
- Cash-on-cash
- 14.51%
- DSCR
- 1.65
- GRM
- 6.4
CMA / ARV
No comps found within radius.
Projected returns pro-forma
-3.0% appreciation · 3.0% rent growth · sell at horizon
- IRR
- 5.0%
- Equity multiple
- 1.19×
- Total profit
- $9,941
- Equity at exit
- $27,584
- IRR
- 14.4%
- Equity multiple
- 2.16×
- Total profit
- $60,160
- Equity at exit
- $15,995
Cash invested: $51,800 (down + closing). Projections, not guarantees.
Landlord ↔ Tenant lean methodology
- Overall (STATE)
- 87 Strongly Landlord-Friendly
- State Texas
- 87 Strongly Landlord-Friendly · R+5
- County
- — inherits STATE
- City
- — inherits STATE
ZIP-level market 79915
- Home prices YoY
- -13.1%
- Active inventory
- 70
- Price-to-rent
- 19.8×
Monthly cashflow live
- Estimated rent
- $2,411 medium interval (Pro) →
- Mortgage (P&I)
- −$970
- Tax est. 1.5%
- −$231 /mo · $2,775/yr
- Insurance
- −$77
- HOA
- −$0
- Vacancy / Maint / Mgmt
- −$506
- Net cashflow
- $626
Break-even live
3-unit breakdown (identical units grouped — click to expand)
| Units | Beds | Baths | Est. rent |
|---|---|---|---|
| 2× units | 1 | 1 | $1,554 |
| #1 | 1 | 1 | $777 |
| #2 | 1 | 1 | $777 |
| 1× unit | 2 | 1 | $858 |
| Total (3 units) | $2,411 | ||
UW: 25.0% down · 7.5% · 30yr · 1.5% tax · 5.0% vac · 8.0% maint · 8.0% mgmt
Financing live
Cash to close
- Down payment
- $46,250
- Closing costs
- $5,550
- Reserves months
- —
- Total cash needed
- —
Loan-product check · same deal, 3 products live
Conventional
25% down · 7.5% · 30yr
- Down + closing
- —
- Monthly P&I
- —
- Monthly cashflow
- —
- DSCR
- —
- Eligible?
- —
Personal DTI + credit; lowest rate.
DSCR
20% down · 8.5% · 30yr
- Down + closing
- —
- Monthly P&I
- —
- Monthly cashflow
- —
- DSCR
- —
- Eligible?
- —
No personal income docs; deal must DSCR.
Hard money
10% down · 12.0% · 12mo
- Down + closing
- —
- Monthly P&I
- —
- Monthly cashflow
- —
- DSCR
- —
- Eligible?
- —
Short-term bridge; refi at stabilization.
Rent comps 7 comps
| Address | Beds | Baths | Sqft | Rent | $/sqft | DOM | Units | Dist |
|---|---|---|---|---|---|---|---|---|
| 7182 Ponce Dr Unit A El Paso, TX | 2.0 | 1.0 | 1336 | $745 | $0.56 | 43d | 1 | 0.11mi |
| 359 Mary Jeanne Ln El Paso, TX | 3.0 | 2.0 | 1300 | $1,600 | $1.23 | 21d | 1 | 0.41mi |
| 167 Pearl Ln El Paso, TX | 3.0 | 1.0 | 1248 | $1,275 | $1.02 | 2d | 1 | 0.49mi |
| 157 Cherry St El Paso, TX | 3.0 | 1.5 | 1161 | $1,350 | $1.16 | 23d | 1 | 0.73mi |
| 7224 N Loop Dr Unit 316 El Paso, TX | 2.0 | 1.0 | 900 | $1,050 | $1.17 | 23d | 1 | 1.15mi |
| 7441 Alameda Ave #10 El Paso, TX | 2.0 | 1.0 | 1122 | $1,200 | $1.07 | 23d | 1 | 1.17mi |
| 7320 Dale Rd Unit 3 El Paso, TX | 2.0 | 1.0 | 900 | $975 | $1.08 | 23d | 1 | 1.22mi |
Listing history 3 events
-
2026-01-27status Active 698-char remark
Show marketing remark (698 chars)
Fixer-Upper Multi-Family Investment Opportunity! Don't miss this rare triplex featuring two studio units and one spacious 2-bedroom unit—perfect for investors or owner-occupants looking to generate rental income. Each unit includes kitchen appliances, tile and laminate flooring, and the seller is offering a credit toward new carpet installation or buyers closing costs assistance. With two units currently vacant, there's immediate potential for an owner to move in and rent out the remaining units, or to fully lease the property for maximum cash flow. A great opportunity to add value and customize to your taste—bring your vision and unlock this property's full potential!
-
2026-01-09status Pending 698-char remark
Show marketing remark (698 chars)
Fixer-Upper Multi-Family Investment Opportunity! Don't miss this rare triplex featuring two studio units and one spacious 2-bedroom unit—perfect for investors or owner-occupants looking to generate rental income. Each unit includes kitchen appliances, tile and laminate flooring, and the seller is offering a credit toward new carpet installation or buyers closing costs assistance. With two units currently vacant, there's immediate potential for an owner to move in and rent out the remaining units, or to fully lease the property for maximum cash flow. A great opportunity to add value and customize to your taste—bring your vision and unlock this property's full potential!
-
2025-10-20$185,000 Active 698-char remark
Show marketing remark (698 chars)
Fixer-Upper Multi-Family Investment Opportunity! Don't miss this rare triplex featuring two studio units and one spacious 2-bedroom unit—perfect for investors or owner-occupants looking to generate rental income. Each unit includes kitchen appliances, tile and laminate flooring, and the seller is offering a credit toward new carpet installation or buyers closing costs assistance. With two units currently vacant, there's immediate potential for an owner to move in and rent out the remaining units, or to fully lease the property for maximum cash flow. A great opportunity to add value and customize to your taste—bring your vision and unlock this property's full potential!
ⓘ Source: listings_history table (triggers on properties + properties_extension) + one-shot
backfill from property_details.listing_events for pre-trigger history.
Climate risk First Street
- Flood 4/10 Moderate FEMA zone X (shaded) · 24% chance over 30 yrs
- Wildfire 1/10 Low
- Heat 6/10 Major 7 d/yr ≥102°F today · 25 d/yr by 30 yrs out
- Wind 1/10 Low
- Air quality 2/10 Low 1 unhealthy d/yr today · 1 by 30 yrs out
Nearby sold comps map
Loading sold comps map…
Walkable amenities ~0.75 mi
Loading nearby amenities…
Taxation est. · year 1
- Rental income
- $28,932
- − Mortgage interest
- −$10,363
- − Property taxes
- −$2,775
- − Insurance
- −$925
- − Repairs & maintenance
- −$2,315
- − Management
- −$2,315
- − Depreciation
- −$5,382
- Taxable income
- $4,858
- Est. tax owed @ 24.0%
- −$1,166
- After-tax cash flow
- $6,348/yr
For passive investors: Depreciation is non-cash, so a rental often shows a tax loss while cash-flowing — sheltering income. Rental losses are passive: they offset passive income freely, and up to $25,000/yr can offset ordinary (W-2) income if you actively participate and your MAGI is under $100k (phasing out to $0 by $150k); unused losses carry forward. On sale, claimed depreciation is recaptured at up to 25%, and gains may owe capital-gains tax (a 1031 exchange can defer both). Figures are a year-1 estimate at your 24.0% rate — not tax advice; consult a CPA.
Condition & rehab AI · 1 photo
This triplex requires moderate renovations, focusing on exterior repairs and landscaping to improve its resale and rental value.
Repairs flagged
- Major exterior siding — Significant wear and tear
- Major driveway — Cracks and deterioration
Value-add opportunities
- Both paint exterior — Enhances curb appeal and property value
- Both repair driveway — Improves property value and accessibility
- Both landscaping — Enhances curb appeal and property value
Renovation cost estimate screening
| Repair item | Severity | Est. cost |
|---|---|---|
| exterior siding · Significant wear and tear | Major | $15,000–50,000 |
| driveway · Cracks and deterioration | Major | $15,000–50,000 |
| Total estimated repair cost · 2 items | $30,000–100,000 |
Value-add ROI direction
- Both paint exterior — Enhances curb appeal and property value ↑
- Both repair driveway — Improves property value and accessibility ↑
- Both landscaping — Enhances curb appeal and property value ↑
ⓘ Cost ranges are severity-bucket heuristics (US national rule-of-thumb). Get contractor quotes + a written scope before underwriting a rehab budget.
Schools (NCES district)
- District
- Ysleta ISD
- NCES district ID
- 4846680
- Math proficiency
- 27% ▼ -31.00%
- Reading proficiency
- 35% ▼ -11.00%
- Median HH income
- $35,826
- Composite
- 25.65/100
- National rank
- #7400
- State rank
- #626 of 826 in TX
Livability — El Paso
- Score
- 81/100
- State rank
- #23
- US rank
- #1375
Category grades
Schools grade is shown separately in the Schools card above.
Census & demographics
- Census place
- El Paso, TX
- County
- El Paso County · 761,266 people
- City population
- 630,223
- Metro
- El Paso, TX
- Population (ZIP)
- 34,230
- Household income
- $35,432
- Rent vs Own
- Severe rent burden
- 1145.0
Population outlook (El Paso County) Hauer SSP2
- Today (2025)
- 897,899 people
- By 2030
- 922,694 · +2.8%
- By 2040
- 960,492 · +7.0%
- By 2050
- 982,919 · +9.5%
- By 2075
- 997,266 · +11.1%
- By 2100
- 900,630 · +0.3%
Race, ethnicity, and origin ACS 2023
- Neighborhood character
- Predominantly Hispanic (95%)
- Race & ethnicity
- Hispanic / Latino 95% Two or more races 38% White 3% Asian 1%
- Hispanic origin (detail)
- Mexican 91%
- Foreign-born
- 24% · Canada, China
- Languages at home
- 22% English-only · Spanish 77%
Political lean MEDSL · El Paso
- 2024 margin
- D (+15.1) · D 57.0% · R 41.8% · Other 1.2%
- 2008→2024 swing
- -17.4pp toward R · 2008: 32.5pp · 2024: 15.1pp
- All cycles
- 2024: D+15.1 2020: D+35.1 2016: D+43.2 2012: D+32.6 2008: D+32.5
Not yet ingested
- Civics
- —
Market trends
- HPI YoY
- ▼ -35.66%
- Current HPI
- 236.1626
- Rent YoY
- —
- Metro
- El Paso, TX
- State GDP YoY
- ▲ 3.95%
- F500 in state
- 110
Industry mix (Fortune 500 HQ in TX)
| Industry | F500 HQs | Revenue |
|---|---|---|
| Energy | 16 | $1,198B |
|
||
| Technology | 5 | $198B |
|
||
| Engineering / Construction | 4 | $72B |
|
||
| Energy Services | 3 | $60B |
|
||
| Utilities | 3 | $41B |
|
||
| Healthcare | 2 | $330B |
|
||
Price history
3 events — show timeline
- 2026-01-27 Relisted — GEPARMLS
- 2026-01-09 Pending — GEPARMLS
- 2025-10-20 Listed $185,000 GEPARMLS
Cash-flow waterfall
monthlySold comps — $/sqft
last 12 mo · ≤1 miLoading sold comps…