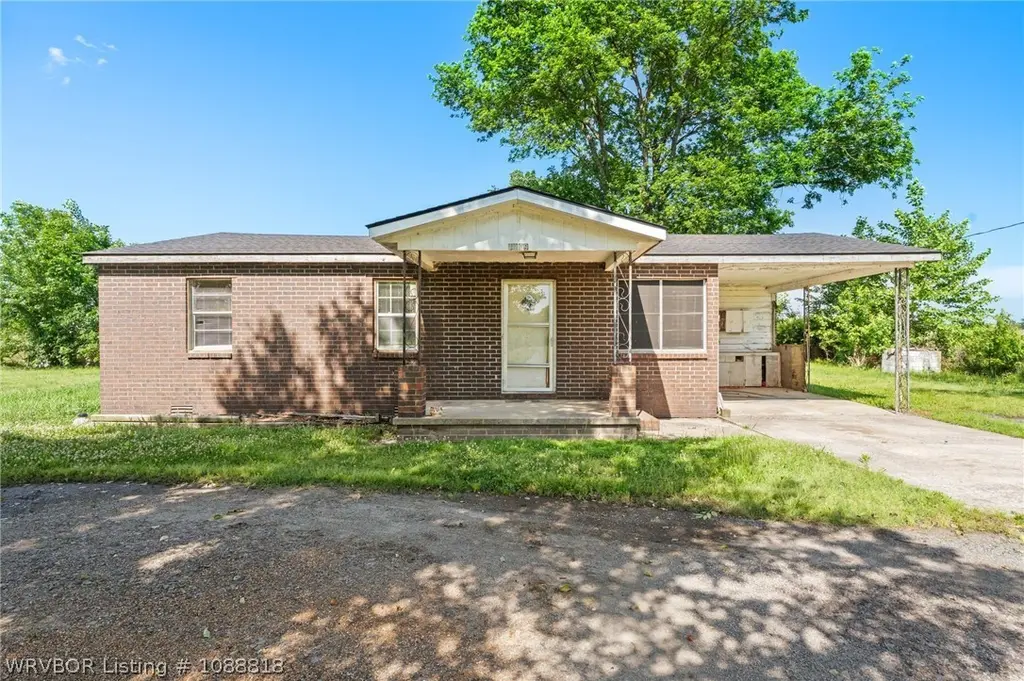
1909 N Davis St · Lavaca, AR
Flood risk 7/10 · Major
- FEMA flood zone
- A
- Chance of flooding over 30 yrs
- 0.99%
- Est. flood insurance / yr
- $1,009 – $1,996
Fire risk 4/10 · Minor
- Est. fire insurance / yr
- $1,499 – $2,785
Heat risk 7/10 · Major
- Hot days now (above 111°F)
- 7 days/yr
- Hot days in 30 yrs
- 20 days/yr
Wind risk 2/10 · Minimal
- Chance of severe wind over 30 yrs
- 4.0%
Air-quality risk 2/10 · Minimal
- Unhealthy air days now
- 0 days/yr
- Unhealthy air days in 30 yrs
- 1 days/yr
Risk factors via First Street. Map © Google.
Why this score? — see what drove the B+ grade
The composite is a weighted blend of 9 inputs, each scored 0–100. Each bar is that input's sub-score; the figure is the points it added to the 100-point composite (weight × sub-score).
- Cash flow +28.8/30.0
- DSCR +10.0/10.0
- Appreciation +10.0/10.0
- 1% rule +7.5/10.0
- ARV discount +7.5/15.0
- Livability +3.9/5.0
- Schools +3.3/10.0
- Rent growth +2.5/5.0
- Condition / age +2.2/5.0
$59,900
🖨 Deal sheet 📄 Offer letter ✓ Due diligence
Listing remarks MLS
8 +/- acre tract in desirable in Lavaca, AR. Wonderful building acreage with City water and AOG through property. Outside city limits, but has some city utilities. Call for your appointment today!
Key facts
- Spacious yard
- Brick exterior
- Covered carport
Tags
Property features AI
Exterior
- Parking: Attached carport; 1 covered parking space; Concrete parking surface
- Utilities: Public water; Septic tank sewer; Electricity available; Natural gas available; Phone service available
- Home design: Single-family house; One story; Residential property
- Construction: Brick and frame construction; Asphalt shingle roof
- Exterior features: Back yard fencing (wire); Paved public road access
Interior
- Kitchen: Microwave; Range; Refrigerator; Electric water heater
- Flooring: Carpet
- Bathrooms: 1 full bathroom
- Heating & cooling: Floor furnace heating; Window cooling units; Ceiling fan(s)
- Interior features: Ceiling fan(s); Eat-in kitchen
- Laundry & utility: Washer hookup; Electric dryer hookup
Neighborhood map
What this means for you Summary
Snapshot
- This is a 3-bed/1.0-bath single-family listed at $60k. Condition is rated fair.
Deal economics
- At list price, monthly cash flow is $77 ($922/yr) — positive.
- The deal already cash-flows at list — no discount required.
- Meets the 1% rule at list price ($750 rent vs $60k).
- Recommended offer: $58k (3.0% below list) — sets the bar for market timing.
- Cap rate 10.3% vs local median 2.0% in Lavaca — top-decile yield for the area; either an underpriced asset or a hidden risk that comps aren't pricing in. Stress-test before assuming the spread holds.
Location & tenants
- Location reads 78/100 on livability (#5 in AR, #2,687 nationally) — a middle-class / working-renter tenant base. Strengths: cost of living A+, housing A+, health & safety A+; Watch: amenities F, commute F.
- Lavaca School District (rural): math 36% / reading 39% proficiency, ranked #77 of 238 in AR (top 32%) — families likely to look elsewhere, expect single-tenant / working-renter base with shorter leases.
- Zoned schools: Lavaca Elementary School (math 57% / reading 42%, grade D, #93 of 454 statewide, top 23%, 346 students, 56% FRL); Lavaca Middle School (math 32% / reading 35%, grade F, #129 of 201 statewide, top 64%, 231 students, 48% FRL); Lavaca High School (math 27% / reading 47%, grade F, #64 of 292 statewide, top 26%, 260 students, 44% FRL).
- Market conditions: 61 active listings in the ZIP; 1 comparable units currently listed for rent nearby; 388 units permitted in Sebastian County in 2024 (16 in 5+ unit buildings).
Forward outlook
- In year one you build about $6k of equity ($414 loan paydown + $6k appreciation (10.0% local appreciation)).
- Sebastian County population projected at +7% by 2050 — modest demand growth; plan on rents tracking national, not racing it.
- At projected returns (10.0% appreciation + 3.0% rent growth), your $17k cash investment doubles in ~3 years — after that, you're playing with house money.
- By year 6, paydown + projected appreciation supports a ~$38k cash-out refi (75% LTV) — recoverable capital for the next deal without selling this one.
Negotiation context
- It's been on market 35 days — a 3% lower offer ($58k) is reasonable based on typical stale-listing flexibility.
- 6 sale attempts since 7y ago with the ask held roughly flat each time — persistent listings suggest the price (not the market) is what's stuck; bring a comps-based counter.
Risks & watch-outs
- Watch-outs: flood insurance adds $125/mo.
- Climate carrying-cost: in FEMA flood zone A (mandatory federal flood insurance); extreme-heat days projected 7→20/yr by 2055 (HVAC capex compounding) — expect insurance premiums to compound above CPI over the hold.
Questions for the listing agent
- It's been on market 35 days. Have you received any prior offers? Is the seller open to a 3% concession, seller financing, or rate buy-down credit?
- Have any recent inspections been done? Can we get a copy of the seller's disclosures and any deferred-maintenance estimates?
- Built in 1960 — when were the roof, HVAC, electrical panel, plumbing, and water heater last replaced?
- What's the actual annual flood-insurance premium (NFIP or private), and is the property in a SFHA with mandatory coverage?
- Is there a deadline driving the sale (1031 exchange, divorce, estate, relocation)? That informs how much negotiation room exists.
- What's the average days-on-market for RENTAL listings here right now (not sales)? A rising rental-DOM trend means longer vacancies and softer asking-rent achievability than the comps imply.
- What's the recent tenant-quality profile in this submarket — average credit score on applications, eviction rate, late-payment / NSF rate, and stable-employment percentage? A property-management company in the area should have these aggregated.
- How much new for-sale + rental construction is in the pipeline within 1–3 miles? Heavy new supply typically softens prices + rents 12–24 months out; constrained supply supports both.
Investment metrics
- 1% rule
- 1.25% ✓
- Cap rate
- 10.34%
- Cash-on-cash
- 14.46%
- DSCR
- 1.64
- GRM
- 6.7
CMA / ARV
- ARV (on-the-fly)
- $145,728
- Comps found
- 9
Show comp detail 9 sales within ~0.75 mi
| Address | Dist | Beds/Ba | Sqft | Sold | Price | $/sf | Match |
|---|---|---|---|---|---|---|---|
| 1206 Brewer Ln | 0.48mi | 3/1.5 | 1,134 (+3%) | 6mo | $145,000 | $128 | 66 |
| 105 W Houston St | 0.62mi | 3/1.0 | 1,066 (-3%) | 3mo | $164,000 | $154 | 62 |
| 1700 Brewer Ln | 0.30mi | 3/1.5 | 1,215 (+10%) | 6mo | $160,000 | $132 | 62 |
| 1204 N Davis St | 0.41mi | 3/1.5 | 1,215 (+10%) | 1mo | $127,000 | $105 | 61 |
| 1201 Brewer Ln | 0.50mi | 3/1.5 | 1,000 (-9%) | 13mo | $142,000 | $142 | 48 |
| 203 Ohio Ln | 0.36mi | 3/1.5 | 1,269 (+15%) | 11mo | $165,000 | $130 | 47 |
| 1204 Brewer Ln | 0.50mi | 3/1.5 | 1,215 (+10%) | 17mo | $135,000 | $111 | 44 |
| 201 W Houston St | 0.62mi | 3/1.5 | 1,014 (-8%) | 17mo | $150,000 | $148 | 42 |
| 4 Fayetteville St | 0.70mi | 3/2.0 | 1,245 (+13%) | 11mo | $180,000 | $145 | 33 |
Match score weights: distance 35% · size 25% · config 20% · recency 20%. Top-matched comps best support the ARV.
Projected returns pro-forma
10.0% appreciation · 3.0% rent growth · sell at horizon
- IRR
- 28.3%
- Equity multiple
- 3.24×
- Total profit
- $37,590
- Equity at exit
- $53,963
- IRR
- 24.7%
- Equity multiple
- 7.38×
- Total profit
- $106,996
- Equity at exit
- $116,373
Cash invested: $16,772 (down + closing). Projections, not guarantees.
Landlord ↔ Tenant lean methodology
- Overall (STATE)
- 92 Strongly Landlord-Friendly
- State Arkansas
- 92 Strongly Landlord-Friendly · R+14
- County
- — inherits STATE
- City
- — inherits STATE
ZIP-level market 72941
- Home prices YoY
- 5.0%
- Active inventory
- 61
- Price-to-rent
- 6.7×
Monthly cashflow live
- Estimated rent
- $750 medium interval (Pro) →
- Mortgage (P&I)
- −$314
- Tax from tax record
- −$51 /mo · $617/yr
- Insurance
- −$25
- Flood insurance flood zone
- −$125 /mo · $1,502/yr
- HOA
- −$0
- Vacancy / Maint / Mgmt
- −$158
- Net cashflow
- $77
Break-even live
UW: 25.0% down · 7.5% · 30yr · 1.5% tax · 5.0% vac · 8.0% maint · 8.0% mgmt
Financing live
Cash to close
- Down payment
- $14,975
- Closing costs
- $1,797
- Reserves months
- —
- Total cash needed
- —
Loan-product check · same deal, 3 products live
Conventional
25% down · 7.5% · 30yr
- Down + closing
- —
- Monthly P&I
- —
- Monthly cashflow
- —
- DSCR
- —
- Eligible?
- —
Personal DTI + credit; lowest rate.
DSCR
20% down · 8.5% · 30yr
- Down + closing
- —
- Monthly P&I
- —
- Monthly cashflow
- —
- DSCR
- —
- Eligible?
- —
No personal income docs; deal must DSCR.
Hard money
10% down · 12.0% · 12mo
- Down + closing
- —
- Monthly P&I
- —
- Monthly cashflow
- —
- DSCR
- —
- Eligible?
- —
Short-term bridge; refi at stabilization.
Rent comps 1 comps
| Address | Beds | Baths | Sqft | Rent | $/sqft | DOM | Units | Dist |
|---|---|---|---|---|---|---|---|---|
| 1307 W Main St Unit 53 Lavaca, AR | 3.0 | 2.0 | 1280 | $750 | $0.59 | 43d | 1 | 0.94mi |
Listing history 22 events
-
2026-06-19statusdays on market $59,900 Active 35 DOM
-
2026-06-13statusdays on market $59,900 Pending 34 DOM
-
2026-06-10days on market $59,900 Active 32 DOM
-
2026-06-09days on market $59,900 Active 31 DOM
-
2026-06-08days on market $59,900 Active 30 DOM
-
2026-06-07days on market $59,900 Active 29 DOM
-
2026-06-02days on market $59,900 Active 24 DOM
-
2026-06-01days on market $59,900 Active 23 DOM
-
2026-05-31days on market $59,900 Active 22 DOM
-
2026-05-30days on market $59,900 Active 21 DOM
-
2026-05-20status Active
-
2026-05-15status Pending
-
2026-05-04$59,900 Active
-
2025-09-14status Active
-
2025-07-20status Pending
-
2025-07-15soldstatus $60,000 Closed 196-char remark
Show marketing remark (196 chars)
8 +/- acre tract in desirable in Lavaca, AR. Wonderful building acreage with City water and AOG through property. Outside city limits, but has some city utilities. Call for your appointment today!
-
2025-07-12$85,000 Active
-
2025-05-13status Pending 196-char remark
Show marketing remark (196 chars)
8 +/- acre tract in desirable in Lavaca, AR. Wonderful building acreage with City water and AOG through property. Outside city limits, but has some city utilities. Call for your appointment today!
-
2025-05-05price $85,000 196-char remark
Show marketing remark (196 chars)
8 +/- acre tract in desirable in Lavaca, AR. Wonderful building acreage with City water and AOG through property. Outside city limits, but has some city utilities. Call for your appointment today!
-
2025-04-09$96,000 Active 196-char remark
Show marketing remark (196 chars)
8 +/- acre tract in desirable in Lavaca, AR. Wonderful building acreage with City water and AOG through property. Outside city limits, but has some city utilities. Call for your appointment today!
-
2019-12-06soldstatus $90,000
-
2019-07-22$110,000
ⓘ Source: listings_history table (triggers on properties + properties_extension) + one-shot
backfill from property_details.listing_events for pre-trigger history.
Tax reassessment forecast AR · Resets to sale price
- Current annual tax
- $617 · $51/mo
- Projected year-2 tax
- $617 · $51/mo
- Expected delta
- $0/yr ($0/mo · 0.0%)
ⓘ Screening estimate from a state-policy table — verify with the county assessor before closing.
Climate risk First Street
- Flood 7/10 Severe FEMA zone A · 99% chance over 30 yrs
- Wildfire 4/10 Moderate
- Heat 7/10 Severe 7 d/yr ≥111°F today · 20 d/yr by 30 yrs out
- Wind 2/10 Low 4% chance of damaging wind over 30 yrs
- Air quality 2/10 Low 0 unhealthy d/yr today · 1 by 30 yrs out
Nearby sold comps map
Loading sold comps map…
Walkable amenities ~0.75 mi
Loading nearby amenities…
Taxation est. · year 1
- Rental income
- $9,000
- − Mortgage interest
- −$3,355
- − Property taxes
- −$617
- − Insurance
- −$1,802
- − Repairs & maintenance
- −$720
- − Management
- −$720
- − Depreciation
- −$1,743
- Taxable income
- $44
- Est. tax owed @ 24.0%
- −$10
- After-tax cash flow
- $912/yr
For passive investors: Depreciation is non-cash, so a rental often shows a tax loss while cash-flowing — sheltering income. Rental losses are passive: they offset passive income freely, and up to $25,000/yr can offset ordinary (W-2) income if you actively participate and your MAGI is under $100k (phasing out to $0 by $150k); unused losses carry forward. On sale, claimed depreciation is recaptured at up to 25%, and gains may owe capital-gains tax (a 1031 exchange can defer both). Figures are a year-1 estimate at your 24.0% rate — not tax advice; consult a CPA.
Condition & rehab AI · 12 photos
This home requires moderate renovations to improve its condition and increase its value. The kitchen and bathroom need significant updates, and the exterior paint should be repaired.
Repairs flagged
- Major kitchen cabinets — severely worn and outdated
- Major kitchen countertops — severely worn and outdated
- Major bathroom fixtures — basic and outdated
- Major exterior paint — some discoloration and wear
Value-add opportunities
- Resale update kitchen cabinets and countertops — modernizing the kitchen will attract more buyers
- Resale update bathroom fixtures — modernizing the bathroom will attract more buyers
- Both paint interior walls — improves the home's appearance and can be done on a budget
- Both repair exterior paint — improves the home's curb appeal and can be done on a budget
Renovation cost estimate screening
| Repair item | Severity | Est. cost |
|---|---|---|
| kitchen cabinets · severely worn and outdated | Major | $15,000–50,000 |
| kitchen countertops · severely worn and outdated | Major | $15,000–50,000 |
| bathroom fixtures · basic and outdated | Major | $15,000–50,000 |
| exterior paint · some discoloration and wear | Major | $15,000–50,000 |
| Total estimated repair cost · 4 items | $60,000–200,000 |
Value-add ROI direction
- Resale update kitchen cabinets and countertops — modernizing the kitchen will attract more buyers ↑
- Resale update bathroom fixtures — modernizing the bathroom will attract more buyers ↑
- Both paint interior walls — improves the home's appearance and can be done on a budget ↑
- Both repair exterior paint — improves the home's curb appeal and can be done on a budget ↑
ⓘ Cost ranges are severity-bucket heuristics (US national rule-of-thumb). Get contractor quotes + a written scope before underwriting a rehab budget.
Schools (NCES district)
- District
- Lavaca School District
- NCES district ID
- 0508730
- Math proficiency
- 36% ▼ -15.00%
- Reading proficiency
- 39% ▼ -10.00%
- Median HH income
- $51,457
- Composite
- 32.55/100
- National rank
- #5687
- State rank
- #77 of 238 in AR
Livability — Lavaca
- Score
- 78/100
- State rank
- #5
- US rank
- #2687
Category grades
Schools grade is shown separately in the Schools card above.
Census & demographics
- Population (ZIP)
- 4,775
Population outlook (Sebastian County) Hauer SSP2
- Today (2025)
- 133,992 people
- By 2030
- 136,620 · +2.0%
- By 2040
- 140,832 · +5.1%
- By 2050
- 143,301 · +6.9%
- By 2075
- 147,964 · +10.4%
- By 2100
- 145,848 · +8.8%
Race, ethnicity, and origin ACS 2023
- Neighborhood character
- Predominantly White (89%)
- Race & ethnicity
- White 89% Two or more races 7% Hispanic / Latino 5%
- Common ancestry
- Slovak 2% Iranian 1% Serbian 1%
- Foreign-born
- 1% · Canada
- Languages at home
- 99% English-only · Spanish 1%
Political lean MEDSL · Sebastian
- 2024 margin
- Solid R (+37.5) · D 30.0% · R 67.6% · Other 2.4%
- 2008→2024 swing
- -2.9pp toward R · 2008: -34.6pp · 2024: -37.5pp
- All cycles
- 2024: R+37.5 2020: R+35.5 2016: R+38.1 2012: R+37.1 2008: R+34.6
Not yet ingested
- Civics
- —
Market trends
- HPI YoY
- ▲ 17.99%
- Current HPI
- 376.37
- Rent YoY
- —
- Metro
- —
- State GDP YoY
- ▲ 3.80%
- F500 in state
- 10
Industry mix (Fortune 500 HQ in AR)
| Industry | F500 HQs | Revenue |
|---|---|---|
| Retail | 1 | $681B |
|
||
| Food / Agriculture | 1 | $53B |
|
||
| Retail / Energy | 1 | $22B |
|
||
| Transportation / Logistics | 1 | $12B |
|
||
| Energy | 1 | $4B |
|
||
Price history
-45.5% since first listed12 events — show timeline
- 2026-05-20 Relisted — WRVBOR
- 2026-05-15 Pending — WRVBOR
- 2026-05-04 Listed $59,900 WRVBOR
- 2025-09-14 Relisted — WRVBOR
- 2025-07-20 Pending — WRVBOR
- 2025-07-15 Sold (MLS) $60,000 WRVBOR
- 2025-07-12 Listed $85,000 WRVBOR
- 2025-05-13 Pending — WRVBOR
- 2025-05-05 Price Changed $85,000 WRVBOR
- 2025-04-09 Listed $96,000 WRVBOR
- 2019-12-06 Sold (MLS) $90,000 WRVBOR
- 2019-07-22 Listed $110,000 WRVBOR
Property tax history
+1.8%/yrLatest (2025): $617 · +9.3% YoY. Source: county tax records.
Cash-flow waterfall
monthlySold comps — $/sqft
last 12 mo · ≤1 miLoading sold comps…