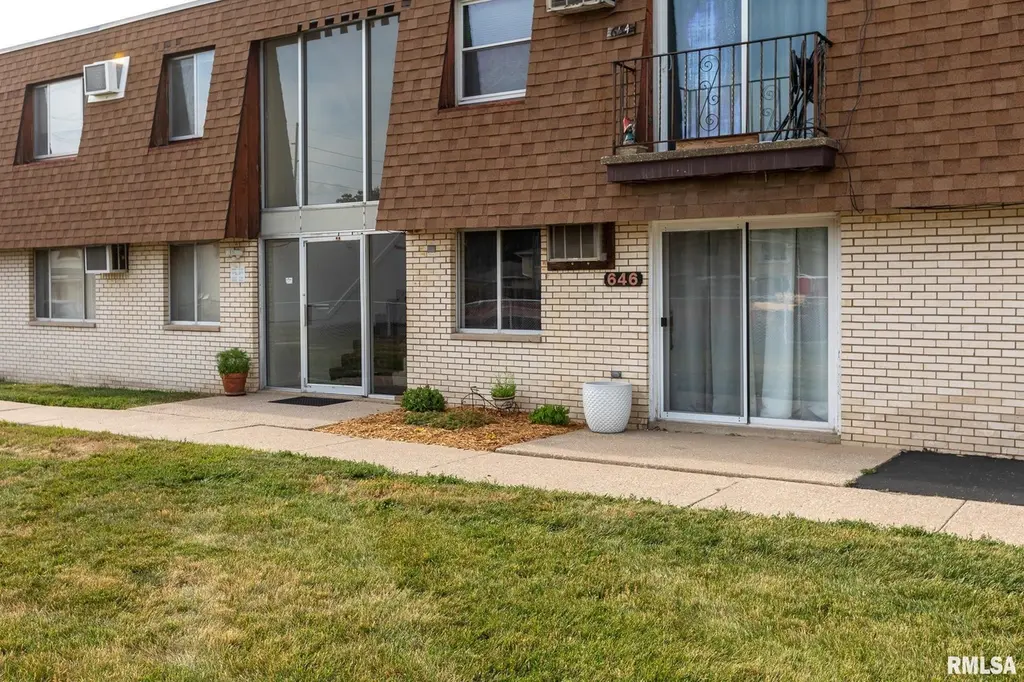
646 S 4th Ave · Morton, IL
Flood risk 1/10 · Minimal
- FEMA flood zone
- X (unshaded)
- Chance of flooding over 30 yrs
- 0.0%
- Est. flood insurance / yr
- $507 – $1,088
Fire risk 1/10 · Minimal
- Est. fire insurance / yr
- $804 – $1,492
Heat risk 3/10 · Minor
- Hot days now (above 104°F)
- 7 days/yr
- Hot days in 30 yrs
- 18 days/yr
Wind risk 2/10 · Minimal
- Chance of severe wind over 30 yrs
- 1.0%
Air-quality risk 2/10 · Minimal
- Unhealthy air days now
- 1 days/yr
- Unhealthy air days in 30 yrs
- 2 days/yr
Risk factors via First Street. Map © Google.
Why this score? — see what drove the C grade
The composite is a weighted blend of 9 inputs, each scored 0–100. Each bar is that input's sub-score; the figure is the points it added to the 100-point composite (weight × sub-score).
- Cash flow +19.4/30.0
- 1% rule +8.3/10.0
- ARV discount +7.5/15.0
- DSCR +6.1/10.0
- Schools +4.8/10.0
- Livability +4.3/5.0
- Rent growth +2.5/5.0
- Condition / age +2.5/5.0
- Appreciation +0.0/10.0
$94,900
🖨 Deal sheet (PDF) 📄 Offer letter ✓ Due diligence
Listing remarks
BEAUTIFUL MAIN FLOOR CONDO!!! COMPLETELY RENOVATED IN 2025 THIS UNIT BOASTS UPDATED KITCHEN INCLUDING SOME CABINETRY, BACKSPLASH, FRIDGE/DISHWASHER 2025, NEW LVP & CARPET THROUGHOUT, FIXTURES, AND FULL BATHROOM REMODEL. APPLIANCES STAY, FURNITURE NEGOTIABLE. NICE!! RARE FIND!!
Key facts
- Backsplash
- Updated kitchen
- $265 HOA
Tags
Property features AI
Finance
- HOA & community: Association fee of $265; HOA covers grounds maintenance, snow removal, trash, and utilities
Exterior
- Parking: Parking pad (paved)
- Utilities: Public water; Public sewer
- Home design: Attached property; 2-story building with entry on level 1; Built in 1968
- Construction: Built in 1968
- Exterior features: Shingle roof; Level lot; Paved road
Interior
- Kitchen: Includes dishwasher and refrigerator
- Bedrooms: 2 bedrooms (both on the main level)
- Flooring: Carpet in bedrooms and living room; Vinyl in dining room and kitchen; Tile in laundry room
- Bathrooms: 1 full bathroom
- Heating & cooling: Hot water heating; Wall units for cooling/heating
- Interior features: No basement; Dishwasher, Refrigerator, Washer, Dryer
- Laundry & utility: Main-level laundry room (tile flooring)
Neighborhood map
What this means for you Summary
Snapshot
- This is a 1-bed/1.0-bath condo listed at $95k.
Deal economics
- At list price, monthly cash flow is $107 ($1k/yr) — positive.
- The deal already cash-flows at list — no discount required.
- Meets the 1% rule at list price ($1k rent vs $95k).
- Cap rate 7.6% vs local median 2.9% in Morton — top-decile yield for the area; either an underpriced asset or a hidden risk that comps aren't pricing in. Stress-test before assuming the spread holds.
Location & tenants
- Location reads 86/100 on livability (#22 in IL, #419 nationally) — a professional / high-income tenant draw. Strengths: crime A+, employment A+, housing A+; Watch: commute F.
- Morton CUSD 709 (suburban): math 48% / reading 59% proficiency, ranked #41 of 620 in IL (top 7%) — acceptable for families but not a draw, mixed tenant base, ~2y average lease; only 12% free/reduced lunch — higher-income household profile.
- Zoned schools: Morton High School (math 52% / reading 51%, grade D+, #38 of 693 statewide, top 6%, 1,061 students, 0% FRL).
- Market conditions: 63 active listings in the ZIP; 2 comparable units currently listed for rent nearby; 77 units permitted in Tazewell County in 2024 (0 in 5+ unit buildings).
Forward outlook
- Local home prices are declining (-3.0%/yr); year-one equity from $656 of loan paydown is wiped out by about $3k of value loss. Plan a longer hold.
- Tazewell County population projected at -15% by 2050 — secular population decline; favor cash flow + early exit over multi-decade hold.
Negotiation context
- Only 10 days on market — expect competitive offers; lowballing is unlikely to land.
- Current owner paid $50k; list at $95k implies a 90% gain — meaningful room to come down on a strong offer.
Risks & watch-outs
- Watch-outs: HOA is 21% of rent.
Questions for the listing agent
- Built in 1968 — when were the roof, HVAC, electrical panel, plumbing, and water heater last replaced?
- What does the HOA fee cover, when was the last increase, and are there any pending special assessments or reserve-fund shortfalls?
- Any open or pending special assessments — roof, HVAC, plumbing, elevator, façade? What's the per-unit balance and payoff schedule, and is the seller paying it off at close or rolling it to the buyer?
- Is there a deadline driving the sale (1031 exchange, divorce, estate, relocation)? That informs how much negotiation room exists.
- Schools are B-rated — typically a magnet for longer-tenancy family renters. What's the average tenant stay here, and is there a school-zone premium baked into asking?
- What's the average days-on-market for RENTAL listings here right now (not sales)? A rising rental-DOM trend means longer vacancies and softer asking-rent achievability than the comps imply.
- What's the recent tenant-quality profile in this submarket — average credit score on applications, eviction rate, late-payment / NSF rate, and stable-employment percentage? A property-management company in the area should have these aggregated.
- How much new apartment / multifamily construction is in the pipeline within 1–3 miles? Heavy new supply (>2% of stock underway) typically softens rents 12–24 months out; light construction supports rent growth.
Investment metrics
- 1% rule
- 1.33% ✓
- Cap rate
- 7.64%
- Cash-on-cash
- 4.82%
- DSCR
- 1.21
- GRM
- 6.3
CMA / ARV
No comps found within radius.
Projected returns pro-forma
-3.0% appreciation · 3.0% rent growth · sell at horizon
- IRR
- -8.6%
- Equity multiple
- 0.68×
- Total profit
- $-8,426
- Equity at exit
- $14,150
- IRR
- 1.1%
- Equity multiple
- 1.08×
- Total profit
- $2,062
- Equity at exit
- $8,205
Cash invested: $26,572 (down + closing). Projections, not guarantees.
Landlord ↔ Tenant lean methodology
- Overall (STATE)
- 43 Moderately Tenant-Leaning
- State Illinois
- 43 Moderately Tenant-Leaning · D+7
- County
- — inherits STATE
- City
- — inherits STATE
ZIP-level market 61550
- Active inventory
- 63
- Price-to-rent
- 6.3×
Monthly cashflow live
- Estimated rent
- $1,258 medium interval (Pro) →
- Mortgage (P&I)
- −$498
- Tax from tax record
- −$85 /mo · $1,020/yr
- Insurance
- −$40
- HOA
- −$265
- Vacancy / Maint / Mgmt
- −$264
- Net cashflow
- $107
Break-even live
Sensitivity live
| Price | -10% $160 | -5% $133 | +0% $107 | +5% $80 | +10% $53 |
|---|---|---|---|---|---|
| Rent | -10% $7 | -5% $57 | +0% $107 | +5% $156 | +10% $206 |
| Rate | -1.0pp $154 | -0.5pp $131 | base $107 | +0.5pp $82 | +1.0pp $57 |
UW: 25.0% down · 7.5% · 30yr · 1.5% tax · 5.0% vac · 8.0% maint · 8.0% mgmt
Financing live
Cash to close
- Down payment
- $23,725
- Closing costs
- $2,847
- Reserves months
- —
- Total cash needed
- —
Loan-product check · same deal, 3 products live
Conventional
25% down · 7.5% · 30yr
- Down + closing
- —
- Monthly P&I
- —
- Monthly cashflow
- —
- DSCR
- —
- Eligible?
- —
Personal DTI + credit; lowest rate.
DSCR
20% down · 8.5% · 30yr
- Down + closing
- —
- Monthly P&I
- —
- Monthly cashflow
- —
- DSCR
- —
- Eligible?
- —
No personal income docs; deal must DSCR.
Hard money
10% down · 12.0% · 12mo
- Down + closing
- —
- Monthly P&I
- —
- Monthly cashflow
- —
- DSCR
- —
- Eligible?
- —
Short-term bridge; refi at stabilization.
Rent comps 2 comps
| Address | Beds | Baths | Sqft | Rent | $/sqft | DOM | Units | Dist |
|---|---|---|---|---|---|---|---|---|
| 1240 S Main St Morton, IL | 1.0–2.0 | 1.0–1.5 | 1000 | $950 | $0.95 | 14d | 2 | 0.72mi |
| 514 N Main St Morton, IL | 2.0 | 1.0 | 1087 | $1,600 | $1.47 | 22d | 1 | 0.73mi |
HOA detail condo
- Monthly dues
- $265 · $3,180/yr
- Assessments
- None detected in remarks — confirm with the listing agent.
Listing history 9 events
-
2026-06-19days on market $94,900 Active 10 DOM
-
2026-06-18days on market $94,900 Active 9 DOM
-
2026-06-17days on market $94,900 Active 8 DOM
-
2026-06-16days on market $94,900 Active 7 DOM
-
2026-06-15days on market $94,900 Active 6 DOM
-
2026-06-14days on market $94,900 Active 4 DOM
-
2026-06-13days on market $94,900 Active 3 DOM
-
2026-06-10remarks 279-char remark
-
2026-06-10$94,900 Active 1 DOM
ⓘ Source: listings_history table (triggers on properties + properties_extension) + one-shot
backfill from property_details.listing_events for pre-trigger history.
Tax reassessment forecast IL · Partial reset (capped growth)
- Current annual tax
- $1,020 · $85/mo
- Projected year-2 tax
- $1,587 · $132/mo
- Expected delta
- +$567/yr (+$47/mo · 55.6%)
ⓘ Screening estimate from a state-policy table — verify with the county assessor before closing.
Climate risk First Street
- Flood 1/10 Low FEMA zone X (unshaded) · 0% chance over 30 yrs
- Wildfire 1/10 Low
- Heat 3/10 Moderate 7 d/yr ≥104°F today · 18 d/yr by 30 yrs out
- Wind 2/10 Low 100% chance of damaging wind over 30 yrs
- Air quality 2/10 Low 1 unhealthy d/yr today · 2 by 30 yrs out
Nearby sold comps map
Loading sold comps map…
Walkable amenities ~0.75 mi
Loading nearby amenities…
Taxation est. · year 1
- Rental income
- $15,096
- − Mortgage interest
- −$5,316
- − Property taxes
- −$1,020
- − Insurance
- −$474
- − Repairs & maintenance
- −$1,208
- − Management
- −$1,208
- − HOA
- −$3,180
- − Depreciation
- −$2,761
- Taxable loss
- −$70
- Est. tax savings @ 24.0%
- +$17
- After-tax cash flow
- $1,296/yr
For passive investors: Depreciation is non-cash, so a rental often shows a tax loss while cash-flowing — sheltering income. Rental losses are passive: they offset passive income freely, and up to $25,000/yr can offset ordinary (W-2) income if you actively participate and your MAGI is under $100k (phasing out to $0 by $150k); unused losses carry forward. On sale, claimed depreciation is recaptured at up to 25%, and gains may owe capital-gains tax (a 1031 exchange can defer both). Figures are a year-1 estimate at your 24.0% rate — not tax advice; consult a CPA.
Schools (NCES district)
- District
- Morton CUSD 709
- NCES district ID
- 1726800
- Math proficiency
- 48% ▼ -3.00%
- Reading proficiency
- 59% ▼ -6.00%
- Median HH income
- $71,729
- Composite
- 47.72/100
- National rank
- #2239
- State rank
- #41 of 620 in IL
Livability — Morton
- Score
- 86/100
- State rank
- #22
- US rank
- #419
Category grades
Schools grade is shown separately in the Schools card above.
Census & demographics
- Census place
- Morton, IL
- City population
- 18,688
- Population (ZIP)
- 18,688
Population outlook (Tazewell County) Hauer SSP2
- Today (2025)
- 131,252 people
- By 2030
- 128,028 · -2.5%
- By 2040
- 120,443 · -8.2%
- By 2050
- 111,872 · -14.8%
- By 2075
- 89,843 · -31.5%
- By 2100
- 66,468 · -49.4%
Race, ethnicity, and origin ACS 2023
- Neighborhood character
- Predominantly White (92%)
- Race & ethnicity
- White 92% Two or more races 3% Asian 3% Hispanic / Latino 2%
- Common ancestry
- Italian 4% Lithuanian 3% Romanian 2%
- Foreign-born
- 2% · China
- Languages at home
- 97% English-only · Chinese 1% Spanish 1% Other Indo-European 1%
Political lean MEDSL · Tazewell
- 2024 margin
- Strong R (+26.7) · D 35.8% · R 62.5% · Other 1.8%
- 2008→2024 swing
- -20.6pp toward R · 2008: -6.0pp · 2024: -26.7pp
- All cycles
- 2024: R+26.7 2020: R+25.6 2016: R+28.5 2012: R+17.9 2008: R+6.0
Not yet ingested
- Civics
- —
Market trends
- HPI YoY
- ▼ -102.61%
- Current HPI
- 159.6287
- Rent YoY
- —
- Metro
- —
- State GDP YoY
- ▲ 1.59%
- F500 in state
- 60
Industry mix (Fortune 500 HQ in IL)
| Industry | F500 HQs | Revenue |
|---|---|---|
| Insurance | 4 | $201B |
|
||
| Consumer Goods | 4 | $87B |
|
||
| Industrial Machinery | 3 | $64B |
|
||
| Healthcare | 2 | $55B |
|
||
| Retail / Pharmacy | 1 | $148B |
|
||
| Agriculture / Food | 1 | $86B |
|
||
Price history
+171.1% since first listed10 events — show timeline
- 2026-06-09 Listed $94,900 RMLSA as Distributed by MLS Grid
- 2026-03-25 Sold (Public Records) $50,000 Public Records
- 2021-08-06 Listing Removed — RMLSA as Distributed by MLS Grid
- 2021-08-06 Listing Removed — RMLSA as Distributed by MLS Grid
- 2021-08-06 Listing Removed — RMLSA as Distributed by MLS Grid
- 2021-08-06 Listing Removed — RMLSA as Distributed by MLS Grid
- 2021-08-06 Listing Removed — RMLSA as Distributed by MLS Grid
- 2021-08-06 Listing Removed — RMLSA as Distributed by MLS Grid
- 2002-03-27 Sold (Public Records) $39,000 Public Records
- 1998-06-23 Sold (Public Records) $35,000 Public Records
Property tax history
+3.8%/yrLatest (2024): $1,020 · +6.9% YoY. Source: county tax records.
Cash-flow waterfall
monthlySold comps — $/sqft
last 12 mo · ≤1 miLoading sold comps…