 Triplex
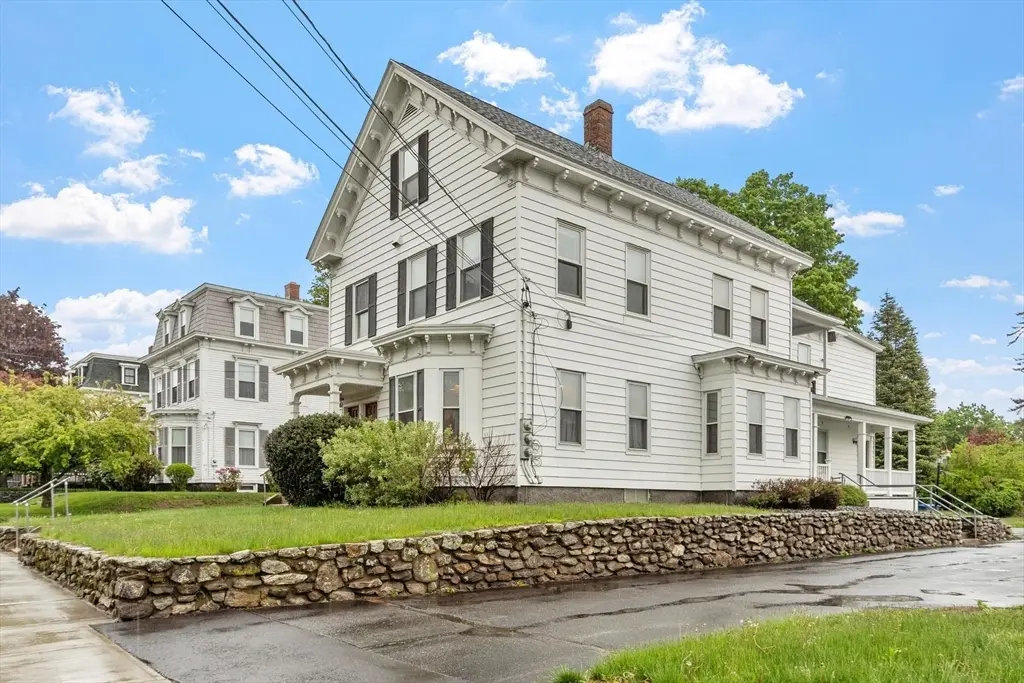
19 Washington St · Leominster, MA
Flood risk 1/10 · Minimal
- FEMA flood zone
- —
- Chance of flooding over 30 yrs
- 0.0%
- Est. flood insurance / yr
- —
Fire risk 1/10 · Minimal
- Est. fire insurance / yr
- $915 – $1,699
Heat risk 4/10 · Minor
- Hot days now (above 95°F)
- 7 days/yr
- Hot days in 30 yrs
- 17 days/yr
Wind risk 6/10 · Moderate
- Chance of severe wind over 30 yrs
- 27.0%
Air-quality risk 2/10 · Minimal
- Unhealthy air days now
- 1 days/yr
- Unhealthy air days in 30 yrs
- 1 days/yr
Risk factors via First Street. Map © Google.
Why this score? — see what drove the C+ grade
The composite is a weighted blend of 9 inputs, each scored 0–100. Each bar is that input's sub-score; the figure is the points it added to the 100-point composite (weight × sub-score).
- Cash flow +27.5/30.0
- DSCR +9.6/10.0
- 1% rule +6.9/10.0
- ARV discount +4.4/15.0
- Rent growth +3.7/5.0
- Livability +3.5/5.0
- Schools +2.8/10.0
- Condition / age +2.5/5.0
- Appreciation +0.0/10.0
$680,000
🖨 Deal sheet 📄 Offer letter ✓ Due diligence
Multi-family units
County records classify this as Multi-Family (2-4 Unit). Listing-text estimate: 3 units. confirmed
Listing remarks
Fully rented, well-maintained 3-family offering strong income potential. Each unit features separate utilities and efficient gas heat. The 1st-floor, previously owner-occupied unit includes 2 bedrooms, kitchen, living, office, full bath, and washer/dryer hookups. The 2nd-floor unit offers 1 bedroom, living room, kitchen, and bath. The 3rd unit spans two levels with 2 bedrooms, living, kitchen, bath, plus common-area washer/dryer hookups. Recent updates include repointing, foundation improvements, and remodeled apartments, reducing future maintenance concerns. Off-street parking adds convenience. Located near downtown with easy access to restaurants, coffee shops, library, commuter rail, and
Key facts
- Efficient gas heat
- Separate utilities
- Remodeled apartments
Tags
Property features AI
Finance
- Financial info: Active listing
- HOA & community: Sidewalks
Exterior
- Parking: Paved off-street parking; Open parking for 10 vehicles
- Utilities: Public water; Public sewer; Electric with circuit breakers
- Home design: 3-family property; 3 stories; Above-grade finished area approximately 3,130
- Construction: Frame construction; Block, brick/mortar and granite foundation; Approximate year built (public records)
- Exterior features: Shingle roof; Porch; Rain gutters; Cleared, level lot; Paved road access; Publicly maintained road
Interior
- Kitchen: Range; Dishwasher; Refrigerator
- Bathrooms: 3 full bathrooms
- Heating & cooling: Forced air heating; Natural gas; Steam heating
- Interior features: Ceiling fans; Living room; Kitchen; Mudroom; Office/Den; Total of 13 rooms
- Laundry & utility: Washer hookup; Dryer hookup
Neighborhood map
What this means for you Summary
Snapshot
- This is a 3 × 5-bed/3.0-bath units multifamily listed at $680k.
Deal economics
- At list price, monthly cash flow is $2k ($24k/yr) — positive. Per door: $670/mo.
- The deal already cash-flows at list — no discount required.
- Meets the 1% rule at list price ($8k rent vs $680k).
- Recommended offer: $660k (3.0% below list) — sets the bar for market timing.
- Cap rate 9.8% vs local median 3.2% in Leominster — top-decile yield for the area; either an underpriced asset or a hidden risk that comps aren't pricing in. Stress-test before assuming the spread holds.
Location & tenants
- Location reads 69/100 on livability (#139 in MA) — a middle-class / working-renter tenant base. Strengths: housing A+, health & safety B+; Watch: schools C-, commute D+, cost of living D+.
- Leominster (suburban): math 25% / reading 38% proficiency, ranked #247 of 302 in MA (top 82%) — families likely to look elsewhere, expect single-tenant / working-renter base with shorter leases.
- Market conditions: Rents rising fast (+4.8%/yr); 56 active listings in the ZIP; solid renter incomes; 2,293 units permitted in Worcester County in 2024 (1,205 in 5+ unit buildings).
- At $8,113/mo this rent would consume 115% of the median local household income ($84k/yr) (locally 1633% of renters already pay >50% of income on rent) — very limited rent-growth headroom before tenants either downsize or default.
Forward outlook
- Local home prices are declining (-3.0%/yr); year-one equity from $5k of loan paydown is wiped out by about $20k of value loss. Plan a longer hold.
- At projected returns (-3.0% appreciation + 4.8% rent growth), your $190k cash investment doubles in ~8 years — after that, you're playing with house money.
Negotiation context
- It's been on market 34 days — a 3% lower offer ($660k) is reasonable based on typical stale-listing flexibility.
- Current owner paid $38k; list at $680k implies a 1689% gain — meaningful room to come down on a strong offer.
Risks & watch-outs
- Watch-outs: built in 1909 — expect roof / HVAC / electrical / plumbing capex.
- Climate carrying-cost: major wind risk, 27% chance of damaging wind over 30y — expect insurance premiums to compound above CPI over the hold.
Questions for the listing agent
- It's been on market 34 days. Have you received any prior offers? Is the seller open to a 3% concession, seller financing, or rate buy-down credit?
- Can we see the unit-by-unit rent roll, current vacancy, and any below-market leases? What's the average tenancy length?
- What capital expenditures (roof, boiler, parking lot, exteriors) have been made in the last 5 years, and what's planned in the next 2?
- Built in 1909 — when were the roof, HVAC, electrical panel, plumbing, and water heater last replaced?
- Is there a deadline driving the sale (1031 exchange, divorce, estate, relocation)? That informs how much negotiation room exists.
- Crime grade is D in this area — have there been break-ins, vandalism, or insurance claims at this property in the last 3 years? What carrier currently insures it and at what premium?
- What's the average days-on-market for RENTAL listings here right now (not sales)? A rising rental-DOM trend means longer vacancies and softer asking-rent achievability than the comps imply.
- What's the recent tenant-quality profile in this submarket — average credit score on applications, eviction rate, late-payment / NSF rate, and stable-employment percentage? A property-management company in the area should have these aggregated.
- How much new apartment / multifamily construction is in the pipeline within 1–3 miles? Heavy new supply (>2% of stock underway) typically softens rents 12–24 months out; light construction supports rent growth.
Investment metrics
- 1% rule
- 1.19% ✓
- Cap rate
- 9.84%
- Cash-on-cash
- 12.67%
- DSCR
- 1.56
- GRM
- 7.0
CMA / ARV
- ARV (median comp)
- $635,898
- List price
- $680,000
- Delta
- 6.94%
- Verdict
- FAIR
- Comps
- 20 within 1.0 mi
Show comp detail 12 sales within ~0.75 mi
| Address | Dist | Beds/Ba | Sqft | Sold | Price | $/sf | Match |
|---|---|---|---|---|---|---|---|
| 119 West St | 0.07mi | 6/3.0 (+1) | 3,085 (-1%) | 6mo | $565,000 | $183 | 85 |
| 9 Arlington St | 0.09mi | 5/3.0 | 3,158 (+1%) | 15mo | $600,000 | $190 | 82 |
| 64 West St | 0.14mi | 6/3.0 (+1) | 3,240 (+4%) | 6mo | $700,000 | $216 | 78 |
| 12 Washington St | 0.04mi | 6/3.0 (+1) | 3,314 (+6%) | 9mo | $800,000 | $241 | 76 |
| 18 - 20 Haynes Ct | 0.39mi | 5/3.0 | 2,850 (-9%) | 4mo | $565,000 | $198 | 63 |
| 242-244 West St | 0.40mi | 6/2.5 (+1) | 3,032 (-3%) | 11mo | $527,500 | $174 | 60 |
| 181 West St | 0.24mi | 5/3.0 | 3,504 (+12%) | 11mo | $470,000 | $134 | 60 |
| 39 Walnut St | 0.39mi | 5/2.0 | 3,194 (+2%) | 21mo | $650,000 | $204 | 57 |
| 19 Walnut St | 0.43mi | 5/4.0 | 3,495 (+12%) | 4mo | $270,000 | $77 | 53 |
| 23 High St | 0.46mi | 5/3.0 | 2,709 (-14%) | 8mo | $617,000 | $228 | 50 |
| 114 Mechanic St | 0.62mi | 5/4.0 | 3,465 (+11%) | 15mo | $620,000 | $179 | 37 |
| 94 Central St | 0.55mi | 6/4.5 (+1) | 2,868 (-8%) | 17mo | $570,000 | $199 | 35 |
Match score weights: distance 35% · size 25% · config 20% · recency 20%. Top-matched comps best support the ARV.
Projected returns pro-forma
-3.0% appreciation · 4.83% rent growth · sell at horizon
- IRR
- 4.4%
- Equity multiple
- 1.17×
- Total profit
- $32,947
- Equity at exit
- $101,390
- IRR
- 15.4%
- Equity multiple
- 2.36×
- Total profit
- $258,038
- Equity at exit
- $58,794
Cash invested: $190,400 (down + closing). Projections, not guarantees.
Landlord ↔ Tenant lean methodology
- Overall (STATE)
- 20 Strongly Tenant-Friendly
- State Massachusetts
- 20 Strongly Tenant-Friendly · D+15
- County
- — inherits STATE
- City
- — inherits STATE
ZIP-level market 01453
- Rents YoY
- 4.8%
- Active inventory
- 56
- Price-to-rent
- 21.0×
Monthly cashflow live
- Estimated rent
- $8,113 medium interval (Pro) →
- Mortgage (P&I)
- −$3,566
- Tax from tax record
- −$550 /mo · $6,605/yr
- Insurance
- −$283
- HOA
- −$0
- Vacancy / Maint / Mgmt
- −$1,704
- Net cashflow
- $2,010
Break-even live
3-unit breakdown (identical units grouped — click to expand)
| Units | Beds | Baths | Est. rent |
|---|---|---|---|
| 3× units | 5 | 3 | $8,112 |
| #1 | 5 | 3 | $2,704 |
| #2 | 5 | 3 | $2,704 |
| #3 | 5 | 3 | $2,704 |
| Total (3 units) | $8,113 | ||
UW: 25.0% down · 7.5% · 30yr · 1.5% tax · 5.0% vac · 8.0% maint · 8.0% mgmt
Financing live
Cash to close
- Down payment
- $170,000
- Closing costs
- $20,400
- Reserves months
- —
- Total cash needed
- —
Loan-product check · same deal, 3 products live
Conventional
25% down · 7.5% · 30yr
- Down + closing
- —
- Monthly P&I
- —
- Monthly cashflow
- —
- DSCR
- —
- Eligible?
- —
Personal DTI + credit; lowest rate.
DSCR
20% down · 8.5% · 30yr
- Down + closing
- —
- Monthly P&I
- —
- Monthly cashflow
- —
- DSCR
- —
- Eligible?
- —
No personal income docs; deal must DSCR.
Hard money
10% down · 12.0% · 12mo
- Down + closing
- —
- Monthly P&I
- —
- Monthly cashflow
- —
- DSCR
- —
- Eligible?
- —
Short-term bridge; refi at stabilization.
Listing history 18 events
-
2026-06-18days on market $680,000 Active 34 DOM
-
2026-06-17days on market $680,000 Active 33 DOM
-
2026-06-16days on market $680,000 Active 32 DOM
-
2026-06-15days on market $680,000 Active 31 DOM
-
2026-06-14days on market $680,000 Active 29 DOM
-
2026-06-13days on market $680,000 Active 28 DOM
-
2026-06-10days on market $680,000 Active 26 DOM
-
2026-06-09days on market $680,000 Active 25 DOM
-
2026-06-08days on market $680,000 Active 24 DOM
-
2026-06-07days on market $680,000 Active 23 DOM
-
2026-06-05days on market $680,000 Active 20 DOM
-
2026-06-03days on market $680,000 Active 19 DOM
-
2026-06-02days on market $680,000 Active 18 DOM
-
2026-06-01days on market $680,000 Active 17 DOM
-
2026-05-31days on market $680,000 Active 16 DOM
-
2026-05-31days on market $680,000 Active 15 DOM
-
2026-05-15$680,000 New 796-char remark
-
1978-11-01soldstatus $38,000
ⓘ Source: listings_history table (triggers on properties + properties_extension) + one-shot
backfill from property_details.listing_events for pre-trigger history.
Tax reassessment forecast MA · Partial reset (capped growth)
- Current annual tax
- $6,605 · $550/mo
- Projected year-2 tax
- $7,484 · $624/mo
- Expected delta
- +$880/yr (+$73/mo · 13.3%)
ⓘ Screening estimate from a state-policy table — verify with the county assessor before closing.
Climate risk First Street
- Flood 1/10 Low 0% chance over 30 yrs
- Wildfire 1/10 Low
- Heat 4/10 Moderate 7 d/yr ≥95°F today · 17 d/yr by 30 yrs out
- Wind 6/10 Major 27% chance of damaging wind over 30 yrs
- Air quality 2/10 Low 1 unhealthy d/yr today · 1 by 30 yrs out
Nearby sold comps map
Loading sold comps map…
Walkable amenities ~0.75 mi
Loading nearby amenities…
Taxation est. · year 1
- Rental income
- $97,356
- − Mortgage interest
- −$38,091
- − Property taxes
- −$6,605
- − Insurance
- −$3,400
- − Repairs & maintenance
- −$7,788
- − Management
- −$7,788
- − Depreciation
- −$19,782
- Taxable income
- $13,902
- Est. tax owed @ 24.0%
- −$3,336
- After-tax cash flow
- $20,778/yr
For passive investors: Depreciation is non-cash, so a rental often shows a tax loss while cash-flowing — sheltering income. Rental losses are passive: they offset passive income freely, and up to $25,000/yr can offset ordinary (W-2) income if you actively participate and your MAGI is under $100k (phasing out to $0 by $150k); unused losses carry forward. On sale, claimed depreciation is recaptured at up to 25%, and gains may owe capital-gains tax (a 1031 exchange can defer both). Figures are a year-1 estimate at your 24.0% rate — not tax advice; consult a CPA.
Schools (NCES district)
- District
- Leominster
- NCES district ID
- 2506780
- Math proficiency
- 25% ▼ -23.00%
- Reading proficiency
- 38% ▼ -6.00%
- Median HH income
- $57,041
- Composite
- 28.07/100
- National rank
- #6836
- State rank
- #247 of 302 in MA
Livability — Leominster
- Score
- 69/100
- State rank
- #139
- US rank
- #8562
Category grades
Schools grade is shown separately in the Schools card above.
Census & demographics
- Census place
- Leominster, MA
- County
- Worcester County · 487,911 people
- City population
- 43,851
- Metro
- Worcester, MA-CT
- Population (ZIP)
- 43,851
- Household income
- $84,296
- Rent vs Own
- Severe rent burden
- 1633.0
Population outlook (Worcester County) Hauer SSP2
- Today (2025)
- 850,858 people
- By 2030
- 860,403 · +1.1%
- By 2040
- 869,902 · +2.2%
- By 2050
- 869,110 · +2.1%
- By 2075
- 870,120 · +2.3%
- By 2100
- 829,703 · -2.5%
Race, ethnicity, and origin ACS 2023
- Neighborhood character
- Predominantly White (68%)
- Race & ethnicity
- White 68% Hispanic / Latino 17% Two or more races 12% Black 5% Asian 3%
- Hispanic origin (detail)
- Mexican 2% Puerto Rican 8% Dominican 1%
- Common ancestry
- Lithuanian 9% Estonian 2% Romanian 2%
- Foreign-born
- 15% · Canada, South Korea, Jamaica
- Languages at home
- 76% English-only · Spanish 13% Other Indo-European 5% French/Haitian/Cajun 1%
Political lean MEDSL · Worcester
- 2024 margin
- D (+10.0) · D 53.9% · R 43.9% · Other 2.2%
- 2008→2024 swing
- -3.8pp toward R · 2008: 13.8pp · 2024: 10.0pp
- All cycles
- 2024: D+10.0 2020: D+17.8 2016: D+10.5 2012: D+9.2 2008: D+13.8
Not yet ingested
- Civics
- —
Market trends
- HPI YoY
- ▼ -621.70%
- Current HPI
- 296.2863
- Rent YoY
- ▲ 4.83%
- Metro
- Worcester, MA-CT
- State GDP YoY
- ▲ 2.28%
- F500 in state
- 38
Industry mix (Fortune 500 HQ in MA)
| Industry | F500 HQs | Revenue |
|---|---|---|
| Technology | 3 | $17B |
|
||
| Insurance | 2 | $84B |
|
||
| Retail | 2 | $76B |
|
||
| Life Sciences | 1 | $43B |
|
||
| Energy Technology | 1 | $31B |
|
||
| Aerospace / Defense | 1 | $18B |
|
||
Price history
+1689.5% since first listed2 events — show timeline
- 2026-05-15 Listed $680,000 MLS PIN
- 1978-11-01 Sold (Public Records) $38,000 Public Records
Property tax history
+3.9%/yrLatest (2023): $6,605 · +8.7% YoY. Source: county tax records.
Cash-flow waterfall
monthlySold comps — $/sqft
last 12 mo · ≤1 miLoading sold comps…