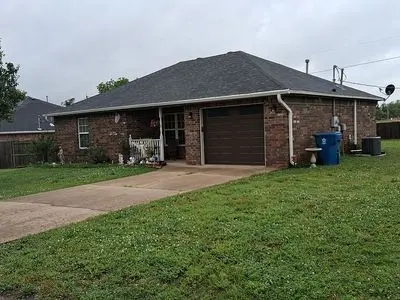
707 Persimmon St SW · Gravette, AR
Flood risk 1/10 · Minimal
- FEMA flood zone
- X (unshaded)
- Chance of flooding over 30 yrs
- 0.0%
- Est. flood insurance / yr
- $507 – $1,088
Fire risk 6/10 · Moderate
- Est. fire insurance / yr
- $1,499 – $2,785
Heat risk 5/10 · Moderate
- Hot days now (above 107°F)
- 7 days/yr
- Hot days in 30 yrs
- 21 days/yr
Wind risk 2/10 · Minimal
- Chance of severe wind over 30 yrs
- 3.0%
Air-quality risk 2/10 · Minimal
- Unhealthy air days now
- 0 days/yr
- Unhealthy air days in 30 yrs
- 1 days/yr
Risk factors via First Street. Map © Google.
Why this score? — see what drove the F grade
The composite is a weighted blend of 9 inputs, each scored 0–100. Each bar is that input's sub-score; the figure is the points it added to the 100-point composite (weight × sub-score).
- Appreciation +10.0/10.0
- Cash flow +6.6/30.0
- Schools +4.0/10.0
- Livability +3.7/5.0
- Rent growth +2.5/5.0
- Condition / age +2.5/5.0
- 1% rule +1.7/10.0
- DSCR +0.9/10.0
- ARV discount +0.8/15.0
$210,000
🖨 Deal sheet 📄 Offer letter ✓ Due diligence
Listing remarks
2 bed 1 bath, new roof, central h& amp; a unit replaced 4ys ago, walk in jacuzzi tub, 1 car garage with new garage door
Key facts
- Walk in jacuzzi tub
- New roof
- Central h a unit
Tags
Neighborhood map
What this means for you Summary
Snapshot
- This is a 2-bed/1.0-bath single-family listed at $210k.
Deal economics
- At list price, monthly cash flow is $-344 ($-4k/yr) — negative.
- To cash-flow at today's rent, offer at most $160k (23.7% below list).
- To meet the 1% rule (rent ≥ 1% of price), the offer needs to be $140k (33.3% below list).
- Recommended offer: $140k (33.3% below list) — sets the bar for 1% rule.
- Cap rate 4.3% vs local median 2.8% in Gravette — top-decile yield for the area; either an underpriced asset or a hidden risk that comps aren't pricing in. Stress-test before assuming the spread holds.
Location & tenants
- Location reads 73/100 on livability (#25 in AR) — a middle-class / working-renter tenant base. Strengths: cost of living A+, housing A+, health & safety A+; Watch: employment C-, amenities F, commute F.
- Gravette School District (rural): math 49% / reading 45% proficiency, ranked #26 of 238 in AR (top 11%) — families likely to look elsewhere, expect single-tenant / working-renter base with shorter leases.
- Market conditions: 170 active listings in the ZIP; 7 comparable units currently listed for rent nearby; rentals at typical pace (median 22d on market — plan ~3-4 weeks tenant-placement turnaround); 43% of comp listings sitting > 30 days — soft ceiling on asking rent; 4,359 units permitted in Benton County in 2024 (402 in 5+ unit buildings).
Forward outlook
- In year one you build about $22k of equity ($1k loan paydown + $21k appreciation (10.0% local appreciation)).
- Benton County population projected at +56% by 2050 — long-run rental-demand tailwind backs the buy-and-hold thesis.
- By year 2, paydown + projected appreciation supports a ~$36k cash-out refi (75% LTV) — recoverable capital for the next deal without selling this one.
Negotiation context
- It's been on market 24 days — a 2% lower offer ($207k) is reasonable based on typical stale-listing flexibility.
- Current owner paid $62k; list at $210k implies a 239% gain — meaningful room to come down on a strong offer.
Risks & watch-outs
- Climate carrying-cost: major wildfire risk; extreme-heat days projected 7→21/yr by 2055 (HVAC capex compounding) — expect insurance premiums to compound above CPI over the hold.
Questions for the listing agent
- What do current leases actually rent for vs. the listed asking? Can we see a recent rent roll and the last 12 months of T-12 income?
- Is there a deadline driving the sale (1031 exchange, divorce, estate, relocation)? That informs how much negotiation room exists.
- The area grade is low — what's the realistic commute time and amenity access for the typical tenant pool here? Any planned neighborhood developments (good or bad) we should know about?
- What's the average days-on-market for RENTAL listings here right now (not sales)? A rising rental-DOM trend means longer vacancies and softer asking-rent achievability than the comps imply.
- What's the recent tenant-quality profile in this submarket — average credit score on applications, eviction rate, late-payment / NSF rate, and stable-employment percentage? A property-management company in the area should have these aggregated.
- How much new for-sale + rental construction is in the pipeline within 1–3 miles? Heavy new supply typically softens prices + rents 12–24 months out; constrained supply supports both.
Investment metrics
- 1% rule
- 0.67% ✗
- Cap rate
- 4.32%
- Cash-on-cash
- -7.03%
- DSCR
- 0.69
- GRM
- 12.5
CMA / ARV
- ARV (on-the-fly)
- $182,700
- Comps found
- 5
Show comp detail 5 sales within ~0.75 mi
| Address | Dist | Beds/Ba | Sqft | Sold | Price | $/sf | Match |
|---|---|---|---|---|---|---|---|
| 409 SW 2nd Ave | 0.38mi | 2/2.0 | 960 (-5%) | 16mo | $200,000 | $208 | 56 |
| 403 SW 1st Ave | 0.45mi | 3/1.0 (+1) | 1,056 (+4%) | 15mo | $190,000 | $180 | 55 |
| 1117 SW Dallas St | 0.44mi | 2/1.0 | 1,116 (+10%) | 20mo | $130,000 | $116 | 46 |
| 408 SW 2nd Ave | 0.52mi | 3/2.0 (+1) | 1,156 (+14%) | 9mo | $235,000 | $203 | 36 |
| 307 6th Ave | 0.73mi | 3/1.0 (+1) | 912 (-10%) | 11mo | $70,000 | $77 | 34 |
Match score weights: distance 35% · size 25% · config 20% · recency 20%. Top-matched comps best support the ARV.
Projected returns pro-forma
10.0% appreciation · 3.0% rent growth · sell at horizon
- IRR
- 19.3%
- Equity multiple
- 2.57×
- Total profit
- $92,458
- Equity at exit
- $189,185
- IRR
- 17.8%
- Equity multiple
- 5.92×
- Total profit
- $289,565
- Equity at exit
- $407,984
Cash invested: $58,800 (down + closing). Projections, not guarantees.
Landlord ↔ Tenant lean methodology
- Overall (STATE)
- 92 Strongly Landlord-Friendly
- State Arkansas
- 92 Strongly Landlord-Friendly · R+14
- County
- — inherits STATE
- City
- — inherits STATE
ZIP-level market 72736
- Home prices YoY
- 20.1%
- Active inventory
- 170
- Price-to-rent
- 12.5×
Monthly cashflow live
- Estimated rent
- $1,401 high interval (Pro) →
- Mortgage (P&I)
- −$1,101
- Tax est. 1.5%
- −$262 /mo · $3,150/yr
- Insurance
- −$88
- HOA
- −$0
- Vacancy / Maint / Mgmt
- −$294
- Net cashflow
- $-344
Break-even live
UW: 25.0% down · 7.5% · 30yr · 1.5% tax · 5.0% vac · 8.0% maint · 8.0% mgmt
Financing live
Cash to close
- Down payment
- $52,500
- Closing costs
- $6,300
- Reserves months
- —
- Total cash needed
- —
Loan-product check · same deal, 3 products live
Conventional
25% down · 7.5% · 30yr
- Down + closing
- —
- Monthly P&I
- —
- Monthly cashflow
- —
- DSCR
- —
- Eligible?
- —
Personal DTI + credit; lowest rate.
DSCR
20% down · 8.5% · 30yr
- Down + closing
- —
- Monthly P&I
- —
- Monthly cashflow
- —
- DSCR
- —
- Eligible?
- —
No personal income docs; deal must DSCR.
Hard money
10% down · 12.0% · 12mo
- Down + closing
- —
- Monthly P&I
- —
- Monthly cashflow
- —
- DSCR
- —
- Eligible?
- —
Short-term bridge; refi at stabilization.
Rent comps 7 comps
| Address | Beds | Baths | Sqft | Rent | $/sqft | DOM | Units | Dist |
|---|---|---|---|---|---|---|---|---|
| 803 Granite Cir SW Gravette, AR | 3.0 | 2.0 | 1263 | $1,375 | $1.09 | 21d | 1 | 0.29mi |
| 408 2nd Ave SE Gravette, AR | 3.0 | 2.5 | 1200 | $1,500 | $1.25 | 44d | 1 | 0.50mi |
| 820 Baker St NW Gravette, AR | 3.0 | 2.5 | 1456 | $1,490 | $1.02 | 14d | 1 | 0.72mi |
| 840 Baker St NW Gravette, AR | 3.0 | 2.5 | 1456 | $1,450 | $1.00 | 14d | 1 | 0.76mi |
| 840 Baker St NW Unit 840 Gravette, AR | 3.0 | 2.5 | 1450 | $1,450 | $1.00 | 44d | 1 | 0.76mi |
| 606 Elgin St NE Gravette, AR | 3.0 | 2.0 | 1152 | $1,400 | $1.22 | 44d | 1 | 1.06mi |
| 205 White Oak Dr NE Unit C Gravette, AR | 2.0 | 2.0 | 1016 | $1,100 | $1.08 | 14d | 1 | 1.11mi |
Listing history 18 events
-
2026-06-18days on market $210,000 Active 24 DOM
-
2026-06-17days on market $210,000 Active 23 DOM
-
2026-06-16days on market $210,000 Active 22 DOM
-
2026-06-15days on market $210,000 Active 21 DOM
-
2026-06-14days on market $210,000 Active 19 DOM
-
2026-06-13days on market $210,000 Active 18 DOM
-
2026-06-10days on market $210,000 Active 16 DOM
-
2026-06-09days on market $210,000 Active 15 DOM
-
2026-06-08days on market $210,000 Active 14 DOM
-
2026-06-07days on market $210,000 Active 13 DOM
-
2026-06-05days on market $210,000 Active 10 DOM
-
2026-06-03days on market $210,000 Active 9 DOM
-
2026-06-02days on market $210,000 Active 8 DOM
-
2026-06-01days on market $210,000 Active 7 DOM
-
2026-05-31days on market $210,000 Active 6 DOM
-
2026-05-31days on market $210,000 Active 5 DOM
-
2026-05-26$210,000 Active
-
2003-12-18soldstatus $62,000
ⓘ Source: listings_history table (triggers on properties + properties_extension) + one-shot
backfill from property_details.listing_events for pre-trigger history.
Climate risk First Street
- Flood 1/10 Low FEMA zone X (unshaded) · 0% chance over 30 yrs
- Wildfire 6/10 Major
- Heat 5/10 Major 7 d/yr ≥107°F today · 21 d/yr by 30 yrs out
- Wind 2/10 Low 3% chance of damaging wind over 30 yrs
- Air quality 2/10 Low 0 unhealthy d/yr today · 1 by 30 yrs out
Nearby sold comps map
Loading sold comps map…
Walkable amenities ~0.75 mi
Loading nearby amenities…
Taxation est. · year 1
- Rental income
- $16,813
- − Mortgage interest
- −$11,763
- − Property taxes
- −$3,150
- − Insurance
- −$1,050
- − Repairs & maintenance
- −$1,345
- − Management
- −$1,345
- − Depreciation
- −$6,109
- Taxable loss
- −$7,949
- Est. tax savings @ 24.0%
- +$1,908
- After-tax cash flow
- $-2,225/yr
For passive investors: Depreciation is non-cash, so a rental often shows a tax loss while cash-flowing — sheltering income. Rental losses are passive: they offset passive income freely, and up to $25,000/yr can offset ordinary (W-2) income if you actively participate and your MAGI is under $100k (phasing out to $0 by $150k); unused losses carry forward. On sale, claimed depreciation is recaptured at up to 25%, and gains may owe capital-gains tax (a 1031 exchange can defer both). Figures are a year-1 estimate at your 24.0% rate — not tax advice; consult a CPA.
Schools (NCES district)
- District
- Gravette School District
- NCES district ID
- 0506840
- Math proficiency
- 49% ▼ -11.00%
- Reading proficiency
- 45% ▼ -10.00%
- Median HH income
- $50,964
- Composite
- 40.41/100
- National rank
- #3728
- State rank
- #26 of 238 in AR
Livability — Gravette
- Score
- 73/100
- State rank
- #25
- US rank
- #5462
Category grades
Schools grade is shown separately in the Schools card above.
Census & demographics
- Census place
- Gravette, AR
- City population
- 8,013
- Population (ZIP)
- 7,519
Population outlook (Benton County) Hauer SSP2
- Today (2025)
- 318,683 people
- By 2030
- 353,481 · +10.9%
- By 2040
- 425,280 · +33.4%
- By 2050
- 497,239 · +56.0%
- By 2075
- 662,114 · +107.8%
- By 2100
- 776,431 · +143.6%
Race, ethnicity, and origin ACS 2023
- Neighborhood character
- Predominantly White (77%)
- Race & ethnicity
- White 77% Two or more races 19% Hispanic / Latino 3%
- Common ancestry
- Serbian 3% Lithuanian 2% Slovak 2%
- Foreign-born
- 1%
- Languages at home
- 99% English-only · Spanish 1%
Political lean MEDSL · Benton
- 2024 margin
- Strong R (+27.0) · D 35.2% · R 62.1% · Other 2.7%
- 2008→2024 swing
- +9.6pp toward D · 2008: -36.5pp · 2024: -27.0pp
- All cycles
- 2024: R+27.0 2020: R+26.4 2016: R+34.9 2012: R+40.4 2008: R+36.5
Not yet ingested
- Civics
- —
Market trends
- HPI YoY
- ▲ 85.16%
- Current HPI
- 508.2507
- Rent YoY
- —
- Metro
- —
- State GDP YoY
- ▲ 3.80%
- F500 in state
- 10
Industry mix (Fortune 500 HQ in AR)
| Industry | F500 HQs | Revenue |
|---|---|---|
| Retail | 1 | $681B |
|
||
| Food / Agriculture | 1 | $53B |
|
||
| Retail / Energy | 1 | $22B |
|
||
| Transportation / Logistics | 1 | $12B |
|
||
| Energy | 1 | $4B |
|
||
Price history
+238.7% since first listed2 events — show timeline
- 2026-05-26 Listed $210,000 FSBO.com
- 2003-12-18 Sold (Public Records) $62,000 Public Records
Property tax history
+2.8%/yrLatest (2025): $339 · -12.3% YoY. Source: county tax records.
Cash-flow waterfall
monthlySold comps — $/sqft
last 12 mo · ≤1 miLoading sold comps…