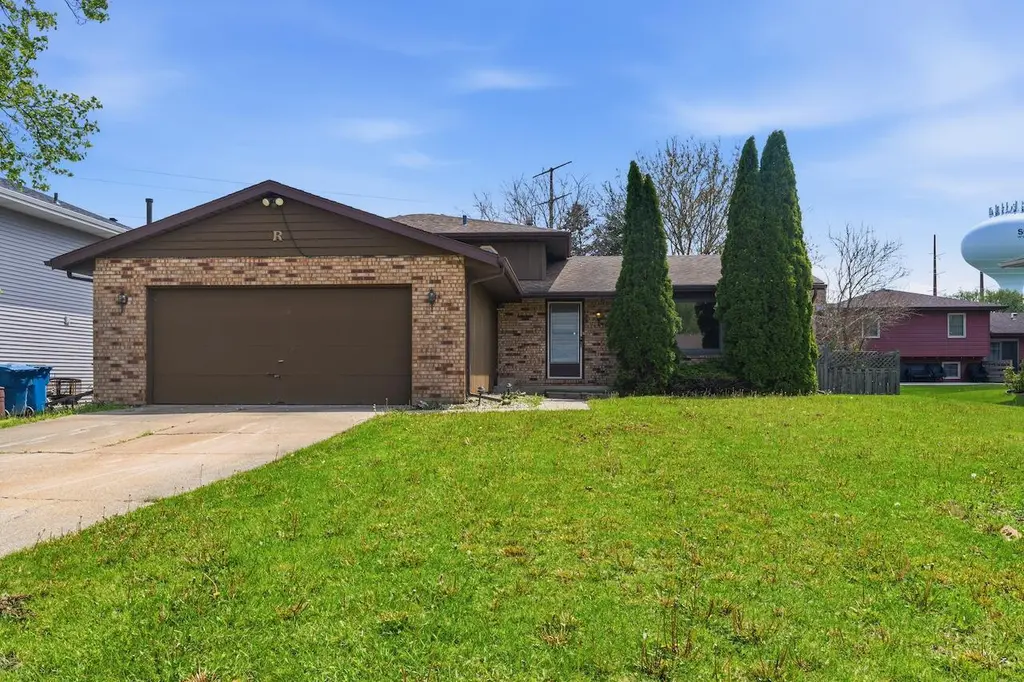
5053 W 90th Ln · Schererville, IN
Flood risk 1/10 · Minimal
- FEMA flood zone
- X (unshaded)
- Chance of flooding over 30 yrs
- 0.0%
- Est. flood insurance / yr
- $507 – $1,088
Fire risk 1/10 · Minimal
- Est. fire insurance / yr
- $717 – $1,331
Heat risk 3/10 · Minor
- Hot days now (above 101°F)
- 7 days/yr
- Hot days in 30 yrs
- 16 days/yr
Wind risk 2/10 · Minimal
- Chance of severe wind over 30 yrs
- 1.0%
Air-quality risk 3/10 · Minor
- Unhealthy air days now
- 2 days/yr
- Unhealthy air days in 30 yrs
- 3 days/yr
Risk factors via First Street. Map © Google.
Why this score? — see what drove the B grade
The composite is a weighted blend of 9 inputs, each scored 0–100. Each bar is that input's sub-score; the figure is the points it added to the 100-point composite (weight × sub-score).
- Cash flow +26.8/30.0
- ARV discount +15.0/15.0
- DSCR +9.2/10.0
- 1% rule +7.9/10.0
- Schools +4.5/10.0
- Livability +3.4/5.0
- Rent growth +2.5/5.0
- Condition / age +2.5/5.0
- Appreciation +0.0/10.0
$189,000
🖨 Deal sheet 📄 Offer letter ✓ Due diligence
Listing remarks
3 bed, 2 bath home with 2-car garage (~1,680 SF) in desirable south Schererville. Built in 1986 with solid layout and strong surrounding homes. Lower level needs work--great value-add opportunity. Ideal for handyman or investor. Sold as-is.
Key facts
- 8,451 sq ft lot
- 2 garage spots
- Built 1987
Property features AI
Finance
- Other: Property listed vacant
Exterior
- Parking: Attached garage that faces the rear; 2-car garage
- Utilities: Public water; Public sewer
- Home design: Tri-level home; Built in 1987
- Exterior features: Covered rear porch; Neighborhood view
Interior
- Kitchen: Gas cooktop; Range hood
- Bedrooms: Primary bedroom; Bedroom 2; Bedroom 3; Bonus room
- Bathrooms: 2 full bathrooms
- Heating & cooling: Forced air heating; Ceiling fan cooling
- Interior features: One fireplace located in the family room on the lower level; Ceiling fans
Neighborhood map
What this means for you Summary
Snapshot
- This is a 3-bed/2.0-bath single-family listed at $189k.
Deal economics
- At list price, monthly cash flow is $518 ($6k/yr) — positive.
- The deal already cash-flows at list — no discount required.
- Meets the 1% rule at list price ($2k rent vs $189k).
- Cap rate 9.6% vs local median 4.0% in Schererville — top-decile yield for the area; either an underpriced asset or a hidden risk that comps aren't pricing in. Stress-test before assuming the spread holds.
Location & tenants
- Location reads 68/100 on livability (#226 in IN) — a middle-class / working-renter tenant base. Strengths: cost of living A+, housing A+, crime A; Watch: amenities F, commute F, health & safety F.
- Lake Central School Corporation (suburban): math 45% / reading 54% proficiency, ranked #41 of 301 in IN (top 14%) — families likely to look elsewhere, expect single-tenant / working-renter base with shorter leases; only 15% free/reduced lunch — higher-income household profile.
- Market conditions: 161 active listings in the ZIP; 7 comparable units currently listed for rent nearby; rentals leasing fast (median 3d on market — plan ~1-2 weeks tenant-placement turnaround); solid renter incomes; 1,642 units permitted in Lake County in 2024 (14 in 5+ unit buildings).
- This rent runs 32% of the median local income ($93k/yr) — at the standard rent-burdened threshold; future hikes will face affordability resistance.
Forward outlook
- Local home prices are declining (-3.0%/yr); year-one equity from $1k of loan paydown is wiped out by about $6k of value loss. Plan a longer hold.
- Lake County population projected to shrink 7% by 2050 — rents likely to lag national; underwrite the cash flow, not the appreciation.
- At projected returns (-3.0% appreciation + 3.0% rent growth), your $53k cash investment doubles in ~10 years — after that, you're playing with house money.
Negotiation context
- Only 13 days on market — expect competitive offers; lowballing is unlikely to land.
Questions for the listing agent
- Is there a deadline driving the sale (1031 exchange, divorce, estate, relocation)? That informs how much negotiation room exists.
- Schools are B-rated — typically a magnet for longer-tenancy family renters. What's the average tenant stay here, and is there a school-zone premium baked into asking?
- What's the average days-on-market for RENTAL listings here right now (not sales)? A rising rental-DOM trend means longer vacancies and softer asking-rent achievability than the comps imply.
- What's the recent tenant-quality profile in this submarket — average credit score on applications, eviction rate, late-payment / NSF rate, and stable-employment percentage? A property-management company in the area should have these aggregated.
- How much new for-sale + rental construction is in the pipeline within 1–3 miles? Heavy new supply typically softens prices + rents 12–24 months out; constrained supply supports both.
Investment metrics
- 1% rule
- 1.29% ✓
- Cap rate
- 9.58%
- Cash-on-cash
- 11.75%
- DSCR
- 1.52
- GRM
- 6.4
CMA / ARV
- ARV (median comp)
- $270,439
- List price
- $189,000
- Delta
- -30.11%
- Verdict
- UNDERPRICED
- Comps
- 10 within 1.0 mi
Show comp detail 11 sales within ~0.75 mi
| Address | Dist | Beds/Ba | Sqft | Sold | Price | $/sf | Match |
|---|---|---|---|---|---|---|---|
| 8966 Clark Pl | 0.18mi | 3/2.0 | 1,720 (+2%) | 10mo | $299,000 | $174 | 80 |
| 5000 W 91st Ave | 0.03mi | 3/2.0 | 1,680 (0%) | 23mo | $285,000 | $170 | 79 |
| 4925 W 89th Ter | 0.11mi | 3/3.0 | 1,850 (+10%) | 0mo | $350,000 | $189 | 74 |
| 9017 Mathews St | 0.08mi | 3/2.0 | 1,882 (+12%) | 3mo | $330,000 | $175 | 74 |
| 4944 89th Ter | 0.10mi | 3/2.0 | 1,492 (-11%) | 6mo | $275,000 | $184 | 72 |
| 4427 W 92nd Pl | 0.31mi | 3/2.0 | 1,632 (-3%) | 19mo | $282,500 | $173 | 65 |
| 9077 Clark Pl | 0.10mi | 3/2.0 | 1,478 (-12%) | 15mo | $335,000 | $227 | 63 |
| 8833 Clark Pl | 0.33mi | 4/2.0 (+1) | 1,794 (+7%) | 13mo | $262,000 | $146 | 57 |
| 4954 W 87th Pl | 0.44mi | 3/2.0 | 1,916 (+14%) | 13mo | $300,000 | $157 | 45 |
| 4884 W 87th Pl | 0.45mi | 3/2.0 | 1,838 (+9%) | 23mo | $314,900 | $171 | 44 |
| 8581 Mathews St | 0.62mi | 3/2.0 | 1,920 (+14%) | 22mo | $347,500 | $181 | 29 |
Match score weights: distance 35% · size 25% · config 20% · recency 20%. Top-matched comps best support the ARV.
Projected returns pro-forma
-3.0% appreciation · 3.0% rent growth · sell at horizon
- IRR
- 1.2%
- Equity multiple
- 1.05×
- Total profit
- $2,487
- Equity at exit
- $28,181
- IRR
- 10.9%
- Equity multiple
- 1.85×
- Total profit
- $45,093
- Equity at exit
- $16,341
Cash invested: $52,920 (down + closing). Projections, not guarantees.
Landlord ↔ Tenant lean methodology
- Overall (STATE)
- 90 Strongly Landlord-Friendly
- State Indiana
- 90 Strongly Landlord-Friendly · R+11
- County
- — inherits STATE
- City
- — inherits STATE
ZIP-level market 46375
- Active inventory
- 161
- Price-to-rent
- 6.4×
Monthly cashflow live
- Estimated rent
- $2,447 high interval (Pro) →
- Mortgage (P&I)
- −$991
- Tax from tax record
- −$345 /mo · $4,144/yr
- Insurance
- −$79
- HOA
- −$0
- Vacancy / Maint / Mgmt
- −$514
- Net cashflow
- $518
Break-even live
UW: 25.0% down · 7.5% · 30yr · 1.5% tax · 5.0% vac · 8.0% maint · 8.0% mgmt
Financing live
Cash to close
- Down payment
- $47,250
- Closing costs
- $5,670
- Reserves months
- —
- Total cash needed
- —
Loan-product check · same deal, 3 products live
Conventional
25% down · 7.5% · 30yr
- Down + closing
- —
- Monthly P&I
- —
- Monthly cashflow
- —
- DSCR
- —
- Eligible?
- —
Personal DTI + credit; lowest rate.
DSCR
20% down · 8.5% · 30yr
- Down + closing
- —
- Monthly P&I
- —
- Monthly cashflow
- —
- DSCR
- —
- Eligible?
- —
No personal income docs; deal must DSCR.
Hard money
10% down · 12.0% · 12mo
- Down + closing
- —
- Monthly P&I
- —
- Monthly cashflow
- —
- DSCR
- —
- Eligible?
- —
Short-term bridge; refi at stabilization.
Rent comps 7 comps
| Address | Beds | Baths | Sqft | Rent | $/sqft | DOM | Units | Dist |
|---|---|---|---|---|---|---|---|---|
| 8413 Jennings Pl Merrillville, IN | 2.0 | 2.0 | 1457 | $2,474 | $1.70 | 1d | 24 | 1.19mi |
| 5500 Cedar Point Dr Crown Point, IN | 1.0–2.0 | 1.0–2.0 | 900 | $1,144 | $1.27 | 1d | 2 | 1.22mi |
| 3136 W 83rd Ln Unit 46C Merrillville, IN | 4.0 | 2.0 | 2140 | $2,600 | $1.21 | 4d | 1 | 1.23mi |
| 827 Veterans Ln Crown Point, IN | 2.0 | 2.0 | 1555 | $2,395 | $1.54 | 1d | 1 | 1.24mi |
| 3123 W 82nd Pl Unit 53D Merrillville, IN | 4.0 | 2.0 | 2140 | $2,600 | $1.21 | 44d | 1 | 1.28mi |
| 3121 W 82nd Pl Unit 53C Merrillville, IN | 4.0 | 2.0 | 2140 | $2,600 | $1.21 | 44d | 1 | 1.28mi |
| 6904 W 85th Pl Crown Point, IN | 3.0 | 1.0 | 1800 | $2,500 | $1.39 | 3d | 1 | 1.35mi |
Listing history 1 events
-
2026-05-07$189,000 Active 240-char remark
ⓘ Source: listings_history table (triggers on properties + properties_extension) + one-shot
backfill from property_details.listing_events for pre-trigger history.
Tax reassessment forecast IN · Partial reset (capped growth)
- Current annual tax
- $4,144 · $345/mo
- Projected year-2 tax
- $4,144 · $345/mo
- Expected delta
- $0/yr ($0/mo · 0.0%)
ⓘ Screening estimate from a state-policy table — verify with the county assessor before closing.
Climate risk First Street
- Flood 1/10 Low FEMA zone X (unshaded) · 0% chance over 30 yrs
- Wildfire 1/10 Low
- Heat 3/10 Moderate 7 d/yr ≥101°F today · 16 d/yr by 30 yrs out
- Wind 2/10 Low 100% chance of damaging wind over 30 yrs
- Air quality 3/10 Moderate 2 unhealthy d/yr today · 3 by 30 yrs out
Nearby sold comps map
Loading sold comps map…
Walkable amenities ~0.75 mi
Loading nearby amenities…
Taxation est. · year 1
- Rental income
- $29,369
- − Mortgage interest
- −$10,587
- − Property taxes
- −$4,144
- − Insurance
- −$945
- − Repairs & maintenance
- −$2,350
- − Management
- −$2,350
- − Depreciation
- −$5,498
- Taxable income
- $3,496
- Est. tax owed @ 24.0%
- −$839
- After-tax cash flow
- $5,380/yr
For passive investors: Depreciation is non-cash, so a rental often shows a tax loss while cash-flowing — sheltering income. Rental losses are passive: they offset passive income freely, and up to $25,000/yr can offset ordinary (W-2) income if you actively participate and your MAGI is under $100k (phasing out to $0 by $150k); unused losses carry forward. On sale, claimed depreciation is recaptured at up to 25%, and gains may owe capital-gains tax (a 1031 exchange can defer both). Figures are a year-1 estimate at your 24.0% rate — not tax advice; consult a CPA.
Schools (NCES district)
- District
- Lake Central School Corporation
- NCES district ID
- 1805450
- Math proficiency
- 45% ▼ -9.00%
- Reading proficiency
- 54% ▼ -11.00%
- Median HH income
- $75,957
- Composite
- 44.82/100
- National rank
- #2736
- State rank
- #41 of 301 in IN
Livability — Schererville
- Score
- 68/100
- State rank
- #226
- US rank
- #9897
Category grades
Schools grade is shown separately in the Schools card above.
Census & demographics
- Census place
- Schererville, IN
- County
- Lake County · 422,878 people
- City population
- 24,188
- Metro
- Chicago-Naperville-Elgin, IL-IN-WI
- Population (ZIP)
- 24,188
- Household income
- $93,160
- Rent vs Own
- Severe rent burden
- 283.0
Population outlook (Lake County) Hauer SSP2
- Today (2025)
- 484,026 people
- By 2030
- 478,091 · -1.2%
- By 2040
- 462,974 · -4.3%
- By 2050
- 449,894 · -7.1%
- By 2075
- 436,169 · -9.9%
- By 2100
- 426,607 · -11.9%
Race, ethnicity, and origin ACS 2023
- Neighborhood character
- Predominantly White (72%)
- Race & ethnicity
- White 72% Hispanic / Latino 13% Two or more races 10% Black 7% Asian 4%
- Hispanic origin (detail)
- Mexican 11% Puerto Rican 1%
- Common ancestry
- Romanian 15% Iranian 4% Italian 1%
- Foreign-born
- 10% · Canada, Vietnam, South Korea
- Languages at home
- 85% English-only · Spanish 6% Russian/Polish/Slavic 5% Vietnamese 2%
Political lean MEDSL · Lake
- 2024 margin
- Lean D (+5.6) · D 52.1% · R 46.5% · Other 1.5%
- 2008→2024 swing
- -28.6pp toward R · 2008: 34.3pp · 2024: 5.6pp
- All cycles
- 2024: D+5.6 2020: D+15.1 2016: D+20.6 2012: D+31.0 2008: D+34.3
Not yet ingested
- Civics
- —
Market trends
- HPI YoY
- ▼ -172.42%
- Current HPI
- 204.9394
- Rent YoY
- —
- Metro
- Chicago-Naperville-Elgin, IL-IN-WI
- State GDP YoY
- ▲ 2.90%
- F500 in state
- 18
Industry mix (Fortune 500 HQ in IN)
| Industry | F500 HQs | Revenue |
|---|---|---|
| Industrial Machinery | 2 | $37B |
|
||
| Healthcare | 1 | $177B |
|
||
| Pharmaceuticals | 1 | $45B |
|
||
| Metals / Steel | 1 | $18B |
|
||
| Agriculture | 1 | $17B |
|
||
| Packaging | 1 | $12B |
|
||
Price history
+5.8% since first listed3 events — show timeline
- 2026-06-05 Sold (MLS) $200,000 NIRA MLS as Distributed by MLS Grid
- 2026-05-20 Pending — NIRA MLS as Distributed by MLS Grid
- 2026-05-07 Listed $189,000 NIRA MLS as Distributed by MLS Grid
Property tax history
+10.7%/yrLatest (2024): $4,144 · +2.2% YoY. Source: county tax records.
Cash-flow waterfall
monthlySold comps — $/sqft
last 12 mo · ≤1 miLoading sold comps…