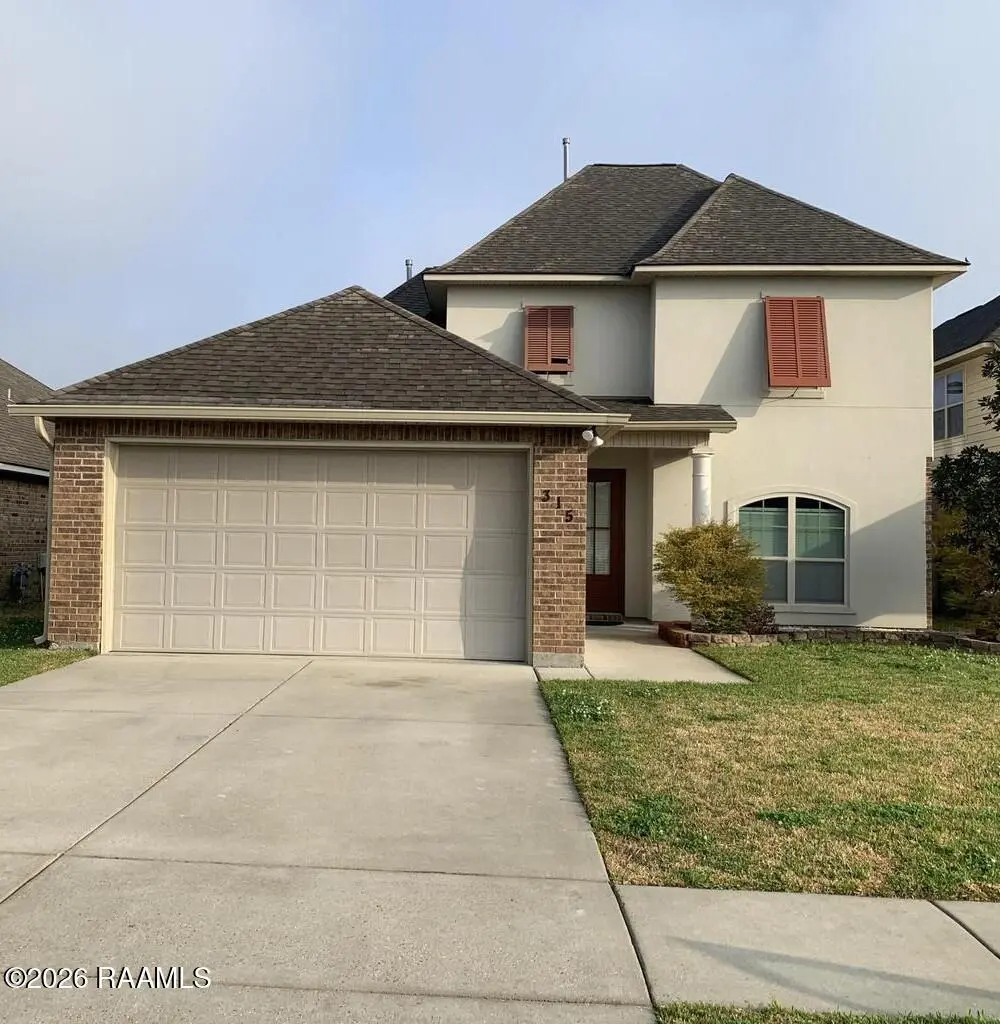
315 Forest Grove Dr · Youngsville, LA
Flood risk 2/10 · Minimal
- FEMA flood zone
- X (unshaded)
- Chance of flooding over 30 yrs
- 0.06%
- Est. flood insurance / yr
- $507 – $1,088
Fire risk 1/10 · Minimal
- Est. fire insurance / yr
- $1,269 – $2,357
Heat risk 9/10 · Severe
- Hot days now (above 108°F)
- 7 days/yr
- Hot days in 30 yrs
- 21 days/yr
Wind risk 9/10 · Severe
- Chance of severe wind over 30 yrs
- 99.0%
Air-quality risk 1/10 · Minimal
- Unhealthy air days now
- 0 days/yr
- Unhealthy air days in 30 yrs
- 0 days/yr
Risk factors via First Street. Map © Google.
Why this score? — see what drove the D+ grade
The composite is a weighted blend of 9 inputs, each scored 0–100. Each bar is that input's sub-score; the figure is the points it added to the 100-point composite (weight × sub-score).
- ARV discount +15.0/15.0
- Cash flow +13.5/30.0
- DSCR +4.1/10.0
- Livability +3.9/5.0
- Schools +3.6/10.0
- 1% rule +3.3/10.0
- Rent growth +2.9/5.0
- Condition / age +2.5/5.0
- Appreciation +0.0/10.0
$285,000
🖨 Deal sheet 📄 Offer letter ✓ Due diligence
Listing remarks
Located in Sugar Ridge in Beautiful Youngsville, LA. This is a 4 bedroom, 2/1 bath home. It has beautiful crown molding, designer colors, designer fixtures, wood laminate floors in foyer, dining room and living room and much more! The spacious living room with a fireplace has a view of your covered patio. The formal foyer is the perfect entryway into the formal dining room. The wonderful kitchen features stainless GE appliances, a gas stove, slab granite counter tops and an under mount 8'' stainless sink. Upstairs you'll find a spacious game room 3 additional bed rooms and a full bath.
Key facts
- Covered patio
- Wood laminate floors
- Designer colors
Tags
Neighborhood map
What this means for you Summary
Snapshot
- This is a 4-bed/2.5-bath single-family listed at $285k.
Deal economics
- At list price, monthly cash flow is $8 ($98/yr) — positive.
- The deal already cash-flows at list — no discount required.
- To meet the 1% rule (rent ≥ 1% of price), the offer needs to be $237k (16.9% below list).
- Recommended offer: $237k (16.9% below list) — sets the bar for 1% rule.
- Cap rate 6.3% vs local median 4.8% in Youngsville — top-decile yield for the area; either an underpriced asset or a hidden risk that comps aren't pricing in. Stress-test before assuming the spread holds.
Location & tenants
- Location reads 78/100 on livability (#8 in LA, #2,614 nationally) — a middle-class / working-renter tenant base. Strengths: employment A+, housing A+, health & safety A+; Watch: amenities F, commute F.
- Lafayette Parish (urban): math 38% / reading 46% proficiency, ranked #19 of 98 in LA (top 19%) — families likely to look elsewhere, expect single-tenant / working-renter base with shorter leases.
- Zoned schools: Youngsville Middle School (math 42% / reading 52%, grade D+, #37 of 218 statewide, top 18%, 646 students, 49% FRL); O. Comeaux High School (math 38% / reading 40%, grade F, #86 of 265 statewide, top 33%, 1,098 students, 56% FRL) — zoned schools at 53% FRL track the district average.
- Market conditions: Rents rising (+1.6%/yr); 675 active listings in the ZIP; 9 comparable units currently listed for rent nearby; rentals lingering (median 44d on market — plan ~5-8 weeks vacancy on turnover, expect pricing pressure); 67% of comp listings sitting > 30 days — soft ceiling on asking rent; solid renter incomes; 1,585 units permitted in Lafayette Parish in 2024 (10 in 5+ unit buildings).
- This rent runs 31% of the median local income ($93k/yr) — at the standard rent-burdened threshold; future hikes will face affordability resistance.
Forward outlook
- Local home prices are declining (-3.0%/yr); year-one equity from $2k of loan paydown is wiped out by about $9k of value loss. Plan a longer hold.
- Lafayette County population projected at +34% by 2050 — long-run rental-demand tailwind backs the buy-and-hold thesis.
Negotiation context
- Only 8 days on market — expect competitive offers; lowballing is unlikely to land.
- 5 sale attempts since 10y ago with the ask held roughly flat each time — persistent listings suggest the price (not the market) is what's stuck; bring a comps-based counter.
- Current owner paid $225k; 27% above their basis — modest negotiation headroom, anchor on the comps not their cost.
Risks & watch-outs
- Climate carrying-cost: severe wind risk, 99% chance of damaging wind over 30y; extreme-heat days projected 7→21/yr by 2055 (HVAC capex compounding) — expect insurance premiums to compound above CPI over the hold.
Questions for the listing agent
- What does the HOA fee cover, when was the last increase, and are there any pending special assessments or reserve-fund shortfalls?
- Is there a deadline driving the sale (1031 exchange, divorce, estate, relocation)? That informs how much negotiation room exists.
- Schools are A-rated — typically a magnet for longer-tenancy family renters. What's the average tenant stay here, and is there a school-zone premium baked into asking?
- The area grade is low — what's the realistic commute time and amenity access for the typical tenant pool here? Any planned neighborhood developments (good or bad) we should know about?
- What's the average days-on-market for RENTAL listings here right now (not sales)? A rising rental-DOM trend means longer vacancies and softer asking-rent achievability than the comps imply.
- What's the recent tenant-quality profile in this submarket — average credit score on applications, eviction rate, late-payment / NSF rate, and stable-employment percentage? A property-management company in the area should have these aggregated.
- How much new for-sale + rental construction is in the pipeline within 1–3 miles? Heavy new supply typically softens prices + rents 12–24 months out; constrained supply supports both.
Investment metrics
- 1% rule
- 0.83% ✗
- Cap rate
- 6.33%
- Cash-on-cash
- 0.12%
- DSCR
- 1.01
- GRM
- 10.0
CMA / ARV
- ARV (on-the-fly)
- $500,801
- Comps found
- 12
Show comp detail 12 sales within ~0.75 mi
| Address | Dist | Beds/Ba | Sqft | Sold | Price | $/sf | Match |
|---|---|---|---|---|---|---|---|
| 315 Forest Grove Dr | 0.00mi | 4/2.5 | 2,460 (-0%) | 1mo | $275,000 | $112 | 99 |
| 208 Cautillion Dr | 0.21mi | 4/2.5 | 2,460 (-0%) | 4mo | $295,000 | $120 | 86 |
| 123 Chemet Rd | 0.34mi | 4/3.0 | 2,491 (+1%) | 2mo | $365,000 | $147 | 79 |
| 101 Chemet Rd | 0.38mi | 4/3.0 | 2,349 (-5%) | 3mo | $345,000 | $147 | 70 |
| 102 Sugar Crest Dr | 0.14mi | 5/3.0 (+1) | 2,720 (+10%) | 0mo | $340,000 | $125 | 69 |
| 206 Amsterdam Ave | 0.63mi | 4/3.5 | 2,479 (+0%) | 2mo | $515,632 | $208 | 64 |
| 208 Buenos Aires Ave | 0.60mi | 4/3.0 | 2,372 (-4%) | 0mo | $499,899 | $211 | 63 |
| 127 Cape Town Ave | 0.50mi | 4/3.0 | 2,270 (-8%) | 1mo | $475,000 | $209 | 60 |
| 110 Bruges Ln | 0.59mi | 4/3.0 | 2,244 (-9%) | 2mo | $465,500 | $207 | 54 |
| 214 Amsterdam Ave | 0.61mi | 4/3.0 | 2,205 (-11%) | 4mo | $447,500 | $203 | 49 |
| 102 Amsterdam Ave | 0.66mi | 4/2.5 | 2,179 (-12%) | 2mo | $468,484 | $215 | 48 |
| 204 Amsterdam Ave | 0.67mi | 4/3.0 | 2,119 (-14%) | 1mo | $420,000 | $198 | 43 |
Match score weights: distance 35% · size 25% · config 20% · recency 20%. Top-matched comps best support the ARV.
Projected returns pro-forma
-3.0% appreciation · 1.65% rent growth · sell at horizon
- IRR
- -17.6%
- Equity multiple
- 0.39×
- Total profit
- $-48,869
- Equity at exit
- $42,494
- IRR
- -12.3%
- Equity multiple
- 0.31×
- Total profit
- $-54,688
- Equity at exit
- $24,642
Cash invested: $79,800 (down + closing). Projections, not guarantees.
Landlord ↔ Tenant lean methodology
- Overall (STATE)
- 90 Strongly Landlord-Friendly
- State Louisiana
- 90 Strongly Landlord-Friendly · R+12
- County
- — inherits STATE
- City
- — inherits STATE
ZIP-level market 70592
- Home prices YoY
- -23.4%
- Rents YoY
- 1.6%
- Active inventory
- 675
- Price-to-rent
- 10.0×
Monthly cashflow live
- Estimated rent
- $2,369 high interval (Pro) →
- Mortgage (P&I)
- −$1,495
- Tax from tax record
- −$220 /mo · $2,642/yr
- Insurance
- −$119
- HOA
- −$30
- Vacancy / Maint / Mgmt
- −$498
- Net cashflow
- $8
Break-even live
UW: 25.0% down · 7.5% · 30yr · 1.5% tax · 5.0% vac · 8.0% maint · 8.0% mgmt
Financing live
Cash to close
- Down payment
- $71,250
- Closing costs
- $8,550
- Reserves months
- —
- Total cash needed
- —
Loan-product check · same deal, 3 products live
Conventional
25% down · 7.5% · 30yr
- Down + closing
- —
- Monthly P&I
- —
- Monthly cashflow
- —
- DSCR
- —
- Eligible?
- —
Personal DTI + credit; lowest rate.
DSCR
20% down · 8.5% · 30yr
- Down + closing
- —
- Monthly P&I
- —
- Monthly cashflow
- —
- DSCR
- —
- Eligible?
- —
No personal income docs; deal must DSCR.
Hard money
10% down · 12.0% · 12mo
- Down + closing
- —
- Monthly P&I
- —
- Monthly cashflow
- —
- DSCR
- —
- Eligible?
- —
Short-term bridge; refi at stabilization.
Rent comps 9 comps
| Address | Beds | Baths | Sqft | Rent | $/sqft | DOM | Units | Dist |
|---|---|---|---|---|---|---|---|---|
| 220 Tall Oaks Ln Youngsville, LA | 4.0 | 2.0 | 1885 | $2,200 | $1.17 | 21d | 1 | 0.29mi |
| 210 Caillou Grove Rd Youngsville, LA | 4.0 | 2.0 | 1961 | $2,100 | $1.07 | 13d | 1 | 0.31mi |
| 210 Revere Dr Youngsville, LA | 3.0 | 2.0 | 1690 | $2,500 | $1.48 | 43d | 1 | 1.15mi |
| 101 Seneca Cir Youngsville, LA | 3.0 | 2.0 | 1640 | $1,900 | $1.16 | 21d | 1 | 1.22mi |
| 110 Fourth St Youngsville, LA | 3.0 | 2.5 | 1700 | $1,800 | $1.06 | 43d | 1 | 1.23mi |
| 104 Field Pt Youngsville, LA | 4.0 | 2.0 | 1700 | $2,500 | $1.47 | 43d | 1 | 1.25mi |
| 204 Benson GRV Youngsville, LA | 4.0 | 2.0 | 1700 | $2,500 | $1.47 | 43d | 1 | 1.25mi |
| — Youngsville, LA | 4.0 | 3.0 | 2072 | $2,550 | $1.23 | 43d | 1 | 1.25mi |
| 139 Iberia St Unit I Youngsville, LA | 3.0 | 3.0 | 1645 | $1,900 | $1.16 | 43d | 1 | 1.37mi |
HOA detail
- Monthly dues
- $30 · $360/yr
- Likely covers
- gas
Listing history 9 events
-
2026-03-26status Pending
-
2026-03-18status Active
-
2026-03-18$285,000 Active
-
2023-04-06price $289,000
-
2023-03-22price $295,000
-
2023-03-04$300,000 Active
-
2019-07-28$250,000
-
2016-10-07soldstatus $225,100
-
2016-05-23$225,100
ⓘ Source: listings_history table (triggers on properties + properties_extension) + one-shot
backfill from property_details.listing_events for pre-trigger history.
Tax reassessment forecast LA · Resets to sale price
- Current annual tax
- $2,642 · $220/mo
- Projected year-2 tax
- $2,642 · $220/mo
- Expected delta
- $0/yr ($0/mo · 0.0%)
ⓘ Screening estimate from a state-policy table — verify with the county assessor before closing.
Climate risk First Street
- Flood 2/10 Low FEMA zone X (unshaded) · 6% chance over 30 yrs
- Wildfire 1/10 Low
- Heat 9/10 Extreme 7 d/yr ≥108°F today · 21 d/yr by 30 yrs out
- Wind 9/10 Extreme 99% chance of damaging wind over 30 yrs
- Air quality 1/10 Low 0 unhealthy d/yr today · 0 by 30 yrs out
Nearby sold comps map
Loading sold comps map…
Walkable amenities ~0.75 mi
Loading nearby amenities…
Taxation est. · year 1
- Rental income
- $28,429
- − Mortgage interest
- −$15,964
- − Property taxes
- −$2,642
- − Insurance
- −$1,425
- − Repairs & maintenance
- −$2,274
- − Management
- −$2,274
- − HOA
- −$360
- − Depreciation
- −$8,291
- Taxable loss
- −$4,801
- Est. tax savings @ 24.0%
- +$1,152
- After-tax cash flow
- $1,250/yr
For passive investors: Depreciation is non-cash, so a rental often shows a tax loss while cash-flowing — sheltering income. Rental losses are passive: they offset passive income freely, and up to $25,000/yr can offset ordinary (W-2) income if you actively participate and your MAGI is under $100k (phasing out to $0 by $150k); unused losses carry forward. On sale, claimed depreciation is recaptured at up to 25%, and gains may owe capital-gains tax (a 1031 exchange can defer both). Figures are a year-1 estimate at your 24.0% rate — not tax advice; consult a CPA.
Schools (NCES district)
- District
- Lafayette Parish
- NCES district ID
- 2200870
- Math proficiency
- 38% ▼ -32.00%
- Reading proficiency
- 46% ▼ -24.00%
- Median HH income
- $50,238
- Composite
- 36.15/100
- National rank
- #4741
- State rank
- #19 of 98 in LA
Livability — Youngsville
- Score
- 78/100
- State rank
- #8
- US rank
- #2614
Category grades
Schools grade is shown separately in the Schools card above.
Census & demographics
- Census place
- Youngsville, LA
- County
- Lafayette Parish · 207,544 people
- City population
- 32,167
- Metro
- Lafayette, LA
- Population (ZIP)
- 32,167
- Household income
- $93,204
- Rent vs Own
- Severe rent burden
- 424.0
Population outlook (Lafayette County) Hauer SSP2
- Today (2025)
- 280,930 people
- By 2030
- 301,092 · +7.2%
- By 2040
- 339,456 · +20.8%
- By 2050
- 375,156 · +33.5%
- By 2075
- 451,672 · +60.8%
- By 2100
- 497,203 · +77.0%
Race, ethnicity, and origin ACS 2023
- Neighborhood character
- Predominantly White (82%)
- Race & ethnicity
- White 82% Black 10% Two or more races 5% Hispanic / Latino 4% Asian 1%
- Common ancestry
- Lithuanian 24% Romanian 3% Italian 1%
- Foreign-born
- 3% · Canada
- Languages at home
- 94% English-only · French/Haitian/Cajun 3% Spanish 2%
Political lean MEDSL · Lafayette
- 2024 margin
- Solid R (+31.4) · D 33.5% · R 64.8% · Other 1.7%
- 2008→2024 swing
- -0.1pp no change · 2008: -31.3pp · 2024: -31.4pp
- All cycles
- 2024: R+31.4 2020: R+28.7 2016: R+33.6 2012: R+33.7 2008: R+31.3
Not yet ingested
- Civics
- —
Market trends
- HPI YoY
- ▼ -41.24%
- Current HPI
- 135.2825
- Rent YoY
- ▲ 1.65%
- Metro
- Lafayette, LA
- State GDP YoY
- ▲ 3.29%
- F500 in state
- 10
Industry mix (Fortune 500 HQ in LA)
| Industry | F500 HQs | Revenue |
|---|---|---|
| Telecommunications | 2 | $23B |
|
||
| Utilities | 1 | $12B |
|
||
| Wholesale / Distribution | 1 | $5B |
|
||
| Advertising | 1 | $2B |
|
||
Price history
+26.6% since first listed9 events — show timeline
- 2026-03-26 Pending — AcadianaMLS
- 2026-03-18 Relisted — AcadianaMLS
- 2026-03-18 Listed $285,000 AcadianaMLS
- 2023-04-06 Price Changed $289,000 AcadianaMLS
- 2023-03-22 Price Changed $295,000 AcadianaMLS
- 2023-03-04 Listed $300,000 AcadianaMLS
- 2019-07-28 Listed $250,000 AcadianaMLS
- 2016-10-07 Sold (MLS) $225,100 AcadianaMLS
- 2016-05-23 Listed $225,100 AcadianaMLS
Property tax history
+9.7%/yrLatest (2025): $2,642 · -1.2% YoY. Source: county tax records.
Cash-flow waterfall
monthlySold comps — $/sqft
last 12 mo · ≤1 miLoading sold comps…