4271 N 1st St Spc 42 · San Jose, CA
Flood risk 6/10 · Moderate
- FEMA flood zone
- AE
- Chance of flooding over 30 yrs
- 0.53%
- Est. flood insurance / yr
- $1,737 – $8,500
Fire risk 1/10 · Minimal
- Est. fire insurance / yr
- $659 – $1,223
Heat risk 5/10 · Moderate
- Hot days now (above 91°F)
- 8 days/yr
- Hot days in 30 yrs
- 16 days/yr
Wind risk 1/10 · Minimal
- Chance of severe wind over 30 yrs
- —
Air-quality risk 7/10 · Major
- Unhealthy air days now
- 13 days/yr
- Unhealthy air days in 30 yrs
- 13 days/yr
Risk factors via First Street. Map © Google.
Why this score? — see what drove the A- grade
The composite is a weighted blend of 9 inputs, each scored 0–100. Each bar is that input's sub-score; the figure is the points it added to the 100-point composite (weight × sub-score).
- Cash flow +30.0/30.0
- ARV discount +13.3/15.0
- DSCR +10.0/10.0
- 1% rule +9.5/10.0
- Schools +5.3/10.0
- Rent growth +4.0/5.0
- Appreciation +3.9/10.0
- Livability +3.9/5.0
- Condition / age +2.5/5.0
$340,000
🖨 Deal sheet 📄 Offer letter ✓ Due diligence
Listing remarks MLS
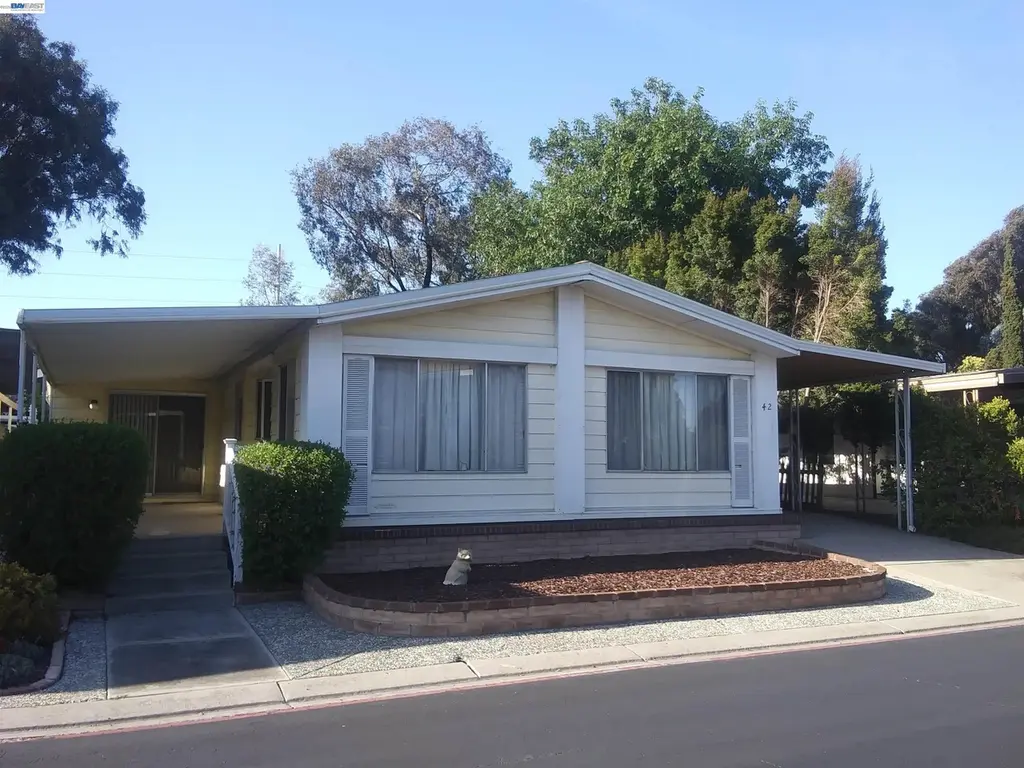
Spacious triple-wide in a gated, family community. Combination living and dining room. Dining room includes a built-in hutch. Bright kitchen with breakfast counter and lots of counter/storage space, includes all appliances. Family room has a built-in desk and bookshelves. Master bath includes dual sinks and a garden tub. Inside laundry room, includes washer/dryer. Central Heating and A/C. Large deck in back yard perfect for entertaining. 1980 Golden West S/N GW4243A/B/C
Key facts
- Garage
- Community pool
- Built 1980
Property features AI
Finance
- HOA & community: Pets allowed (cats and dogs, size limits apply); Community clubhouse; Community pool; Gated community
Exterior
- Parking: Carport; Covered parking (1 space); 1 garage space
- Security: Security gate; Gated community
- Utilities: Public water; Public sewer; Cable connected
- Home design: Manufactured in park (mobile home); Triple wide
- Construction: Metal skirting
- Exterior features: Fenced; Front yard; Security gate; Community pool; Clubhouse; Gated community
Interior
- Kitchen: Dishwasher; Built-in oven; Garbage disposal; Refrigerator
- Bedrooms: 2 bedrooms
- Flooring: Vinyl; Carpet
- Bathrooms: 2 full bathrooms
- Heating & cooling: Central heating; Central air conditioning
- Interior features: No additional rooms; Back yard
- Laundry & utility: Washer; Dryer
Neighborhood map
What this means for you Summary
Snapshot
- This is a 2-bed/2.0-bath manufactured listed at $340k.
Deal economics
- At list price, monthly cash flow is $1k ($14k/yr) — positive.
- The deal already cash-flows at list — no discount required.
- Meets the 1% rule at list price ($5k rent vs $340k).
- Cap rate 11.8% vs local median 1.6% in San Jose — top-decile yield for the area; either an underpriced asset or a hidden risk that comps aren't pricing in. Stress-test before assuming the spread holds.
Location & tenants
- Location reads 78/100 on livability (#68 in CA, #2,559 nationally) — a middle-class / working-renter tenant base. Strengths: amenities A+, commute A+, employment A+; Watch: crime F, cost of living F.
- Santa Clara Unified (urban): math 49% / reading 66% proficiency, ranked #75 of 517 in CA (top 14%) — acceptable for families but not a draw, mixed tenant base, ~2y average lease.
- Market conditions: Rents rising fast (+5.9%/yr); 19 active listings in the ZIP; 10 comparable units currently listed for rent nearby; rentals leasing fast (median 2d on market — plan ~1-2 weeks tenant-placement turnaround); high-income renter base; 3,838 units permitted in Santa Clara County in 2024 (1,886 in 5+ unit buildings).
Forward outlook
- Local home prices are declining (-2.1%/yr); year-one equity from $2k of loan paydown is wiped out by about $7k of value loss. Plan a longer hold.
- Santa Clara County population projected at +24% by 2050 — long-run rental-demand tailwind backs the buy-and-hold thesis.
- At projected returns (-2.1% appreciation + 5.9% rent growth), your $95k cash investment doubles in ~6 years — after that, you're playing with house money.
Negotiation context
- Only 12 days on market — expect competitive offers; lowballing is unlikely to land.
- Current owner paid $205k; list at $340k implies a 66% gain — meaningful room to come down on a strong offer.
Risks & watch-outs
- Watch-outs: flood insurance adds $427/mo.
- Climate carrying-cost: in FEMA flood zone AE (mandatory federal flood insurance); extreme-heat days projected 8→16/yr by 2055 (HVAC capex compounding) — expect insurance premiums to compound above CPI over the hold.
Questions for the listing agent
- What's the actual annual flood-insurance premium (NFIP or private), and is the property in a SFHA with mandatory coverage?
- Is there a deadline driving the sale (1031 exchange, divorce, estate, relocation)? That informs how much negotiation room exists.
- Crime grade is F in this area — have there been break-ins, vandalism, or insurance claims at this property in the last 3 years? What carrier currently insures it and at what premium?
- What's the average days-on-market for RENTAL listings here right now (not sales)? A rising rental-DOM trend means longer vacancies and softer asking-rent achievability than the comps imply.
- What's the recent tenant-quality profile in this submarket — average credit score on applications, eviction rate, late-payment / NSF rate, and stable-employment percentage? A property-management company in the area should have these aggregated.
- How much new for-sale + rental construction is in the pipeline within 1–3 miles? Heavy new supply typically softens prices + rents 12–24 months out; constrained supply supports both.
Investment metrics
- 1% rule
- 1.45% ✓
- Cap rate
- 11.77%
- Cash-on-cash
- 19.58%
- DSCR
- 1.87
- GRM
- 5.7
CMA / ARV
- ARV (on-the-fly)
- $390,720
- Comps found
- 6
Show comp detail 6 sales within ~0.75 mi
| Address | Dist | Beds/Ba | Sqft | Sold | Price | $/sf | Match |
|---|---|---|---|---|---|---|---|
| 4271 N First St #10 | 0.00mi | 3/2.0 (+1) | 1,800 (+2%) | 11mo | $340,000 | $189 | 82 |
| 4271 N First St #153 | 0.00mi | 3/2.0 (+1) | 1,688 (-4%) | 24mo | $375,000 | $222 | 68 |
| 424 Shorewood Ln #424 | 0.27mi | 3/2.0 (+1) | 1,620 (-8%) | 2mo | $352,000 | $217 | 68 |
| 4271 N 1st St #105 | 0.17mi | 2/2.0 | 1,510 (-14%) | 8mo | $404,000 | $268 | 62 |
| 4271 N First St #131 | 0.39mi | 2/2.0 | 1,527 (-13%) | 15mo | $390,000 | $255 | 47 |
| 503 Summerland Dr | 0.14mi | 3/2.0 (+1) | 1,500 (-15%) | 22mo | $275,000 | $183 | 46 |
Match score weights: distance 35% · size 25% · config 20% · recency 20%. Top-matched comps best support the ARV.
Projected returns pro-forma
-2.15% appreciation · 5.94% rent growth · sell at horizon
- IRR
- 10.7%
- Equity multiple
- 1.46×
- Total profit
- $44,230
- Equity at exit
- $63,672
- IRR
- 21.0%
- Equity multiple
- 3.19×
- Total profit
- $208,632
- Equity at exit
- $52,179
Cash invested: $95,200 (down + closing). Projections, not guarantees.
Landlord ↔ Tenant lean methodology
- Overall (CITY)
- 0 Strongly Tenant-Friendly
- State California
- 18 Strongly Tenant-Friendly · D+13
- County
- — inherits STATE
- City San Jose
- 0 Strongly Tenant-Friendly · D+24
ZIP-level market 95134
- Home prices YoY
- -0.8%
- Rents YoY
- 5.9%
- Active inventory
- 19
- Price-to-rent
- 5.7×
Monthly cashflow live
- Estimated rent
- $4,940 high interval (Pro) →
- Mortgage (P&I)
- −$1,783
- Tax est. 1.5%
- −$425 /mo · $5,100/yr
- Insurance
- −$142
- Flood insurance flood zone
- −$427 /mo · $5,118/yr
- HOA
- −$0
- Vacancy / Maint / Mgmt
- −$1,037
- Net cashflow
- $1,126
Break-even live
UW: 25.0% down · 7.5% · 30yr · 1.5% tax · 5.0% vac · 8.0% maint · 8.0% mgmt
Financing live
Cash to close
- Down payment
- $85,000
- Closing costs
- $10,200
- Reserves months
- —
- Total cash needed
- —
Loan-product check · same deal, 3 products live
Conventional
25% down · 7.5% · 30yr
- Down + closing
- —
- Monthly P&I
- —
- Monthly cashflow
- —
- DSCR
- —
- Eligible?
- —
Personal DTI + credit; lowest rate.
DSCR
20% down · 8.5% · 30yr
- Down + closing
- —
- Monthly P&I
- —
- Monthly cashflow
- —
- DSCR
- —
- Eligible?
- —
No personal income docs; deal must DSCR.
Hard money
10% down · 12.0% · 12mo
- Down + closing
- —
- Monthly P&I
- —
- Monthly cashflow
- —
- DSCR
- —
- Eligible?
- —
Short-term bridge; refi at stabilization.
Rent comps 10 comps
| Address | Beds | Baths | Sqft | Rent | $/sqft | DOM | Units | Dist |
|---|---|---|---|---|---|---|---|---|
| 1 Vista Montana San Jose, CA | 1.0–3.0 | 1.0–2.0 | 1184 | $4,288 | $3.62 | 1d | 7 | 0.35mi |
| 99 Vista Montana San Jose, CA | 1.0–3.0 | 1.0–3.0 | 1085 | $4,029 | $3.71 | 1d | 20 | 0.44mi |
| 2333 Calle del Mundo Santa Clara, CA | 1.0–3.0 | 1.0–2.0 | 991 | $4,909 | $4.95 | 1d | 15 | 0.70mi |
| 5150 Calle del Sol Santa Clara, CA | 3.0 | 1.0–3.0 | 1357 | $10,128 | $7.46 | 2d | 89 | 0.74mi |
| 4516 Carlyle Ct #582 Santa Clara, CA | 3.0 | 2.0 | 1345 | $6,060 | $4.51 | 14d | 1 | 1.18mi |
| 3700 Casa Verde St San Jose, CA | 1.0–3.0 | 1.0–2.0 | 989 | $4,048 | $4.09 | 1d | 18 | 1.22mi |
| 1650 Hope Dr Santa Clara, CA | 1.0–3.0 | 1.0–2.0 | 1017 | $4,000 | $3.93 | 1d | 10 | 1.31mi |
| 4424 Headen Way Santa Clara, CA | 3.0 | 2.5 | 1716 | $5,400 | $3.15 | 23d | 1 | 1.37mi |
| 1933 Silva Pl Santa Clara, CA | 3.0 | 2.5 | 1726 | $4,695 | $2.72 | 12d | 1 | 1.43mi |
| 3500 Palmilla Dr San Jose, CA | 3.0 | 1.0–2.0 | 1077 | $5,668 | $5.26 | 1d | 72 | 1.43mi |
Listing history 10 events
-
2026-06-18days on market $340,000 Coming Soon 12 DOM
-
2026-06-17days on market $340,000 Coming Soon 11 DOM
-
2026-06-16days on market $340,000 Coming Soon 10 DOM
-
2026-06-15days on market $340,000 Coming Soon 9 DOM
-
2026-06-13days on market $340,000 Coming Soon 7 DOM
-
2026-06-13days on market $340,000 Coming Soon 6 DOM
-
2026-06-09days on market $340,000 Coming Soon 3 DOM
-
2026-06-08days on market $340,000 Coming Soon 2 DOM
-
2026-06-07remarks 690-char remark
-
2026-06-07$340,000 Coming Soon 1 DOM
ⓘ Source: listings_history table (triggers on properties + properties_extension) + one-shot
backfill from property_details.listing_events for pre-trigger history.
Climate risk First Street
- Flood 6/10 Major FEMA zone AE · 53% chance over 30 yrs
- Wildfire 1/10 Low
- Heat 5/10 Major 8 d/yr ≥91°F today · 16 d/yr by 30 yrs out
- Wind 1/10 Low
- Air quality 7/10 Severe 13 unhealthy d/yr today · 13 by 30 yrs out
Nearby sold comps map
Loading sold comps map…
Walkable amenities ~0.75 mi
Loading nearby amenities…
Taxation est. · year 1
- Rental income
- $59,281
- − Mortgage interest
- −$19,045
- − Property taxes
- −$5,100
- − Insurance
- −$6,818
- − Repairs & maintenance
- −$4,743
- − Management
- −$4,743
- − Depreciation
- −$9,891
- Taxable income
- $8,942
- Est. tax owed @ 24.0%
- −$2,146
- After-tax cash flow
- $11,372/yr
For passive investors: Depreciation is non-cash, so a rental often shows a tax loss while cash-flowing — sheltering income. Rental losses are passive: they offset passive income freely, and up to $25,000/yr can offset ordinary (W-2) income if you actively participate and your MAGI is under $100k (phasing out to $0 by $150k); unused losses carry forward. On sale, claimed depreciation is recaptured at up to 25%, and gains may owe capital-gains tax (a 1031 exchange can defer both). Figures are a year-1 estimate at your 24.0% rate — not tax advice; consult a CPA.
Schools (NCES district)
- District
- Santa Clara Unified
- NCES district ID
- 0635430
- Math proficiency
- 49% ▼ -3.00%
- Reading proficiency
- 66% ▲ 4.00%
- Median HH income
- $97,320
- Composite
- 53.46/100
- National rank
- #1459
- State rank
- #75 of 517 in CA
Livability — San Jose
- Score
- 78/100
- State rank
- #68
- US rank
- #2559
Category grades
Schools grade is shown separately in the Schools card above.
Census & demographics
- Census place
- San Jose, CA
- County
- Santa Clara County · 1,806,974 people
- City population
- 954,479
- Metro
- San Jose-Sunnyvale-Santa Clara, CA
- Population (ZIP)
- 30,471
- Household income
- $203,649
- Rent vs Own
- Severe rent burden
- 921.0
Population outlook (Santa Clara County) Hauer SSP2
- Today (2025)
- 2,179,074 people
- By 2030
- 2,301,297 · +5.6%
- By 2040
- 2,528,195 · +16.0%
- By 2050
- 2,712,135 · +24.5%
- By 2075
- 2,998,701 · +37.6%
- By 2100
- 2,931,429 · +34.5%
Race, ethnicity, and origin ACS 2023
- Neighborhood character
- Diverse neighborhood (Simpson 0.56)
- Race & ethnicity
- Asian 63% White 17% Hispanic / Latino 13% Two or more races 5% Black 3%
- Hispanic origin (detail)
- Mexican 8%
- Common ancestry
- Lithuanian 1% Italian 1% Subsaharan African 1%
- Foreign-born
- 65% · China, Canada, South Korea
- Languages at home
- 28% English-only · Other Indo-European 28% Other Asian/Pacific 14% Chinese 11%
Political lean MEDSL · Santa Clara
- 2024 margin
- Solid D (+40.0) · D 68.1% · R 28.1% · Other 3.8%
- 2008→2024 swing
- -0.9pp no change · 2008: 40.9pp · 2024: 40.0pp
- All cycles
- 2024: D+40.0 2020: D+47.4 2016: D+52.5 2012: D+42.1 2008: D+40.9
Not yet ingested
- Civics
- —
Market trends
- HPI YoY
- ▼ -2.15%
- Current HPI
- 276.0008
- Rent YoY
- ▲ 5.94%
- Metro
- San Jose-Sunnyvale-Santa Clara, CA
- State GDP YoY
- ▲ 3.21%
- F500 in state
- 116
Industry mix (Fortune 500 HQ in CA)
| Industry | F500 HQs | Revenue |
|---|---|---|
| Technology | 27 | $1,492B |
|
||
| Financial Services | 3 | $174B |
|
||
| Retail | 3 | $44B |
|
||
| Insurance | 3 | $26B |
|
||
| Media / Entertainment | 2 | $115B |
|
||
| Pharmaceuticals / Biotech | 2 | $62B |
|
||
Price history
+61.9% since first listed4 events — show timeline
- 2026-06-07 Coming Soon $340,000 bridgeMLS, Bay East AOR, or Contra Costa AOR
- 2017-11-28 Sold (MLS) $205,000 MLSListings
- 2017-10-26 Pending — MLSListings
- 2017-10-20 Listed $210,000 MLSListings
Property tax history
-9.5%/yrLatest (2011): $497 · -10.3% YoY. Source: county tax records.
Cash-flow waterfall
monthlySold comps — $/sqft
last 12 mo · ≤1 miLoading sold comps…