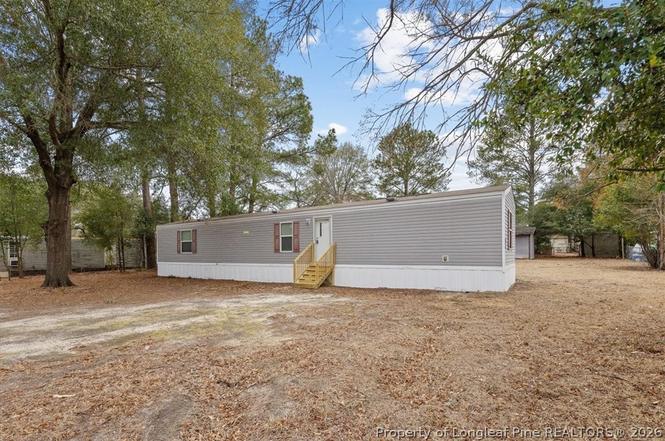
5552 Jackson St · Hope Mills, NC
Flood risk 1/10 · Minimal
- FEMA flood zone
- X (unshaded)
- Chance of flooding over 30 yrs
- 0.0%
- Est. flood insurance / yr
- $507 – $1,088
Fire risk 6/10 · Moderate
- Est. fire insurance / yr
- $906 – $1,684
Heat risk 7/10 · Major
- Hot days now (above 106°F)
- 7 days/yr
- Hot days in 30 yrs
- 16 days/yr
Wind risk 7/10 · Major
- Chance of severe wind over 30 yrs
- 78.0%
Air-quality risk 1/10 · Minimal
- Unhealthy air days now
- 0 days/yr
- Unhealthy air days in 30 yrs
- 0 days/yr
Risk factors via First Street. Map © Google.
Why this score? — see what drove the D+ grade
The composite is a weighted blend of 9 inputs, each scored 0–100. Each bar is that input's sub-score; the figure is the points it added to the 100-point composite (weight × sub-score).
- Cash flow +18.8/30.0
- ARV discount +7.5/15.0
- DSCR +5.9/10.0
- 1% rule +5.0/10.0
- Rent growth +3.6/5.0
- Livability +3.4/5.0
- Schools +3.1/10.0
- Condition / age +2.5/5.0
- Appreciation +0.0/10.0
$142,900
🖨 Deal sheet 📄 Offer letter ✓ Due diligence
Listing remarks
Looking for an affordable home with room to grow? This move-in-ready home offers the perfect combination of space, comfort, and value! 5552 Jackson St, Hope Mills, NC? Why keep paying rent when you can own? This move-in-ready home offers the space you need, the affordability you want, and the opportunity to start building equity instead of paying your landlord's mortgage. This property is 2 lots combined with two different tax numbers (0413-97-7958 and 0413-97-7984). Total Acre . 40 Open-concept layout Spacious kitchen with breakfast peninsula Large lot with room to enjoy Affordable monthly payment potential Conveniently located near shopping, dining, schools, and Fort Libe
Key facts
- 0.4 acre lot
- Built 2018
- Listed 118 days
Property features AI
Exterior
- Utilities: Water from spring and well; No sewer (sewer not available)
- Home design: Manufactured home; Residential property
- Construction: Aluminum siding
Interior
- Kitchen: Cooktop; Dishwasher; Microwave; Oven; Refrigerator
- Bedrooms: 3 total rooms
- Flooring: Laminate flooring; Carpet
- Bathrooms: 2 full bathrooms
- Heating & cooling: Heat pump heating; Central electric air conditioning; Ceiling fans
- Interior features: Ceiling fans; Eat-in kitchen; Laminate counters; Open floorplan
Neighborhood map
What this means for you Summary
Snapshot
- This is a 3-bed/2.0-bath land listed at $143k.
Deal economics
- At list price, monthly cash flow is $144 ($2k/yr) — positive.
- The deal already cash-flows at list — no discount required.
- Meets the 1% rule at list price ($1k rent vs $143k).
- Recommended offer: $130k (9.0% below list) — sets the bar for market timing.
- Cap rate 7.5% vs local median 4.8% in Hope Mills — top-decile yield for the area; either an underpriced asset or a hidden risk that comps aren't pricing in. Stress-test before assuming the spread holds.
Location & tenants
- Location reads 67/100 on livability (#234 in NC) — a middle-class / working-renter tenant base. Strengths: cost of living A+, housing A+, health & safety B+; Watch: crime D-, amenities F, commute F.
- Cumberland County Schools (urban): math 32% / reading 41% proficiency, ranked #126 of 178 in NC (top 71%) — families likely to look elsewhere, expect single-tenant / working-renter base with shorter leases.
- Zoned schools: Gray'S Creek Middle (math 33% / reading 48%, grade F, #215 of 475 statewide, top 46%, 1,126 students, 50% FRL); Gray'S Creek High (math 61% / reading 58%, grade C+, #216 of 535 statewide, top 43%, 1,395 students, 44% FRL).
- Zoned-school proficiency averages 50% at this address vs 36% district-wide (+14 pts) — the actual schools serving this property are materially stronger than the Cumberland County Schools average implies; a family-tenant draw the district grade alone would hide.
- Market conditions: Rents rising fast (+4.3%/yr); 317 active listings in the ZIP; 7 comparable units currently listed for rent nearby; rentals at typical pace (median 21d on market — plan ~3-4 weeks tenant-placement turnaround); 1,125 units permitted in Cumberland County in 2024 (104 in 5+ unit buildings).
Forward outlook
- Local home prices are declining (-3.0%/yr); year-one equity from $988 of loan paydown is wiped out by about $4k of value loss. Plan a longer hold.
Negotiation context
- It's been on market 118 days — a 9% lower offer ($130k) is reasonable based on typical stale-listing flexibility.
Risks & watch-outs
- Climate carrying-cost: major wind risk, 78% chance of damaging wind over 30y; major wildfire risk; extreme-heat days projected 7→16/yr by 2055 (HVAC capex compounding) — expect insurance premiums to compound above CPI over the hold.
Questions for the listing agent
- It's been on market 118 days. Have you received any prior offers? Is the seller open to a 9% concession, seller financing, or rate buy-down credit?
- Why hasn't it sold? Are there any deal-killer items the seller is aware of (foundation, flood, title, zoning, code violations)?
- Is there a deadline driving the sale (1031 exchange, divorce, estate, relocation)? That informs how much negotiation room exists.
- Schools are D-rated, which usually means shorter tenancies and higher turnover. Who's the typical renter profile here, and what's been the actual vacancy rate?
- Crime grade is D in this area — have there been break-ins, vandalism, or insurance claims at this property in the last 3 years? What carrier currently insures it and at what premium?
- The area grade is low — what's the realistic commute time and amenity access for the typical tenant pool here? Any planned neighborhood developments (good or bad) we should know about?
- What's the average days-on-market for RENTAL listings here right now (not sales)? A rising rental-DOM trend means longer vacancies and softer asking-rent achievability than the comps imply.
- What's the recent tenant-quality profile in this submarket — average credit score on applications, eviction rate, late-payment / NSF rate, and stable-employment percentage? A property-management company in the area should have these aggregated.
- How much new for-sale + rental construction is in the pipeline within 1–3 miles? Heavy new supply typically softens prices + rents 12–24 months out; constrained supply supports both.
Investment metrics
- 1% rule
- 1.00% ✓
- Cap rate
- 7.50%
- Cash-on-cash
- 4.33%
- DSCR
- 1.19
- GRM
- 8.3
CMA / ARV
No comps found within radius.
Projected returns pro-forma
-3.0% appreciation · 4.28% rent growth · sell at horizon
- IRR
- -8.1%
- Equity multiple
- 0.70×
- Total profit
- $-12,081
- Equity at exit
- $21,307
- IRR
- 3.0%
- Equity multiple
- 1.23×
- Total profit
- $9,265
- Equity at exit
- $12,355
Cash invested: $40,012 (down + closing). Projections, not guarantees.
Landlord ↔ Tenant lean methodology
- Overall (STATE)
- 85 Strongly Landlord-Friendly
- State North Carolina
- 85 Strongly Landlord-Friendly · R+3
- County
- — inherits STATE
- City
- — inherits STATE
ZIP-level market 28348
- Home prices YoY
- -14.0%
- Rents YoY
- 4.3%
- Active inventory
- 317
- Price-to-rent
- 8.3×
Monthly cashflow live
- Estimated rent
- $1,433 high interval (Pro) →
- Mortgage (P&I)
- −$749
- Tax est. 1.5%
- −$179 /mo · $2,144/yr
- Insurance
- −$60
- HOA
- −$0
- Vacancy / Maint / Mgmt
- −$301
- Net cashflow
- $144
Break-even live
UW: 25.0% down · 7.5% · 30yr · 1.5% tax · 5.0% vac · 8.0% maint · 8.0% mgmt
Financing live
Cash to close
- Down payment
- $35,725
- Closing costs
- $4,287
- Reserves months
- —
- Total cash needed
- —
Loan-product check · same deal, 3 products live
Conventional
25% down · 7.5% · 30yr
- Down + closing
- —
- Monthly P&I
- —
- Monthly cashflow
- —
- DSCR
- —
- Eligible?
- —
Personal DTI + credit; lowest rate.
DSCR
20% down · 8.5% · 30yr
- Down + closing
- —
- Monthly P&I
- —
- Monthly cashflow
- —
- DSCR
- —
- Eligible?
- —
No personal income docs; deal must DSCR.
Hard money
10% down · 12.0% · 12mo
- Down + closing
- —
- Monthly P&I
- —
- Monthly cashflow
- —
- DSCR
- —
- Eligible?
- —
Short-term bridge; refi at stabilization.
Rent comps 7 comps
| Address | Beds | Baths | Sqft | Rent | $/sqft | DOM | Units | Dist |
|---|---|---|---|---|---|---|---|---|
| 3717 Damien Dr Hope Mills, NC | 2.0 | 2.0 | 975 | $1,280 | $1.31 | 13d | 3 | 0.82mi |
| 4901 Madison Dr Hope Mills, NC | 2.0 | 2.0 | 900 | $950 | $1.06 | 13d | 1 | 0.84mi |
| 4065 Professional Dr Unit 4065 Hope Mills, NC | 2.0 | 2.0 | 1050 | $1,095 | $1.04 | 23d | 1 | 0.96mi |
| 4065 Professional Dr Hope Mills, NC | 2.0 | 2.0 | 1050 | $1,095 | $1.04 | 21d | 1 | 0.96mi |
| 4079 Professional Dr Hope Mills, NC | 2.0 | 2.0 | 1050 | $1,095 | $1.04 | 23d | 1 | 0.98mi |
| 4033 Professional Dr Unit 4033 Hope Mills, NC | 2.0 | 2.0 | 1050 | $1,095 | $1.04 | 23d | 1 | 1.02mi |
| 3916 Middle St Hope Mills, NC | 2.0 | 1.0 | 905 | $1,115 | $1.23 | 13d | 1 | 1.34mi |
Listing history 19 events
-
2026-06-18days on market $142,900 Active 118 DOM
-
2026-06-17days on market $142,900 Active 117 DOM
-
2026-06-16days on market $142,900 Active 116 DOM
-
2026-06-15days on market $142,900 Active 115 DOM
-
2026-06-14days on market $142,900 Active 113 DOM
-
2026-06-13days on market $142,900 Active 112 DOM
-
2026-06-10days on market $142,900 Active 110 DOM
-
2026-06-09days on market $142,900 Active 109 DOM
-
2026-06-08days on market $142,900 Active 108 DOM
-
2026-06-07pricedays on market $142,900 Active 107 DOM
-
2026-06-03days on market $144,900 Active 103 DOM
-
2026-06-02days on market $144,900 Active 102 DOM
-
2026-06-01days on market $144,900 Active 101 DOM
-
2026-05-31days on market $144,900 Active 100 DOM
-
2026-05-30days on market $144,900 Active 99 DOM
-
2026-04-08price $144,900
-
2026-03-25price $145,900
-
2026-03-12price $147,500
-
2026-02-21$149,000 Active
ⓘ Source: listings_history table (triggers on properties + properties_extension) + one-shot
backfill from property_details.listing_events for pre-trigger history.
Climate risk First Street
- Flood 1/10 Low FEMA zone X (unshaded) · 0% chance over 30 yrs
- Wildfire 6/10 Major
- Heat 7/10 Severe 7 d/yr ≥106°F today · 16 d/yr by 30 yrs out
- Wind 7/10 Severe 78% chance of damaging wind over 30 yrs
- Air quality 1/10 Low 0 unhealthy d/yr today · 0 by 30 yrs out
Nearby sold comps map
Loading sold comps map…
Walkable amenities ~0.75 mi
Loading nearby amenities…
Taxation est. · year 1
- Rental income
- $17,191
- − Mortgage interest
- −$8,005
- − Property taxes
- −$2,144
- − Insurance
- −$714
- − Repairs & maintenance
- −$1,375
- − Management
- −$1,375
- − Depreciation
- −$4,157
- Taxable loss
- −$579
- Est. tax savings @ 24.0%
- +$139
- After-tax cash flow
- $1,870/yr
For passive investors: Depreciation is non-cash, so a rental often shows a tax loss while cash-flowing — sheltering income. Rental losses are passive: they offset passive income freely, and up to $25,000/yr can offset ordinary (W-2) income if you actively participate and your MAGI is under $100k (phasing out to $0 by $150k); unused losses carry forward. On sale, claimed depreciation is recaptured at up to 25%, and gains may owe capital-gains tax (a 1031 exchange can defer both). Figures are a year-1 estimate at your 24.0% rate — not tax advice; consult a CPA.
Schools (NCES district)
- District
- Cumberland County Schools
- NCES district ID
- 3700011
- Math proficiency
- 32% ▼ -2.00%
- Reading proficiency
- 41% ▼ -1.00%
- Median HH income
- $44,168
- Composite
- 31.0/100
- National rank
- #6096
- State rank
- #126 of 178 in NC
Livability — Hope Mills
- Score
- 67/100
- State rank
- #234
- US rank
- #10761
Category grades
Schools grade is shown separately in the Schools card above.
Census & demographics
- County
- Cumberland County · 265,314 people
- City population
- 39,196
- Metro
- Fayetteville, NC
- Population (ZIP)
- 39,196
- Household income
- $66,129
- Rent vs Own
- Severe rent burden
- 746.0
Population outlook (Cumberland County) Hauer SSP2
- Today (2025)
- 330,855 people
- By 2030
- 333,523 · +0.8%
- By 2040
- 335,583 · +1.4%
- By 2050
- 335,325 · +1.4%
- By 2075
- 342,853 · +3.6%
- By 2100
- 340,698 · +3.0%
Race, ethnicity, and origin ACS 2023
- Neighborhood character
- Diverse neighborhood (Simpson 0.67)
- Race & ethnicity
- White 49% Black 27% Hispanic / Latino 13% Two or more races 11% Asian 2% Native American 2%
- Hispanic origin (detail)
- Mexican 4% Puerto Rican 5%
- Common ancestry
- Romanian 2% Lithuanian 1% Serbian 1%
- Foreign-born
- 5% · Canada, South Korea, Vietnam
- Languages at home
- 90% English-only · Spanish 8% Other Indo-European 1%
Political lean MEDSL · Cumberland
- 2024 margin
- D (+13.4) · D 56.1% · R 42.7% · Other 1.2%
- 2008→2024 swing
- -4.3pp toward R · 2008: 17.7pp · 2024: 13.4pp
- All cycles
- 2024: D+13.4 2020: D+16.6 2016: D+16.0 2012: D+19.7 2008: D+17.7
Not yet ingested
- Civics
- —
Market trends
- HPI YoY
- ▼ -37.14%
- Current HPI
- 228.3122
- Rent YoY
- ▲ 4.28%
- Metro
- Fayetteville, NC
- State GDP YoY
- ▲ 3.28%
- F500 in state
- 26
Industry mix (Fortune 500 HQ in NC)
| Industry | F500 HQs | Revenue |
|---|---|---|
| Financial Services | 2 | $213B |
|
||
| Retail | 2 | $95B |
|
||
| Industrial Conglomerate | 1 | $38B |
|
||
| Metals / Steel | 1 | $35B |
|
||
| Utilities | 1 | $30B |
|
||
| Industrial Machinery | 1 | $19B |
|
||
Price history
-2.8% since first listed4 events — show timeline
- 2026-04-08 Price Changed $144,900 LPRMLS
- 2026-03-25 Price Changed $145,900 LPRMLS
- 2026-03-12 Price Changed $147,500 LPRMLS
- 2026-02-21 Listed $149,000 LPRMLS
Property tax history
+6.0%/yrLatest (2025): $217 · +6.1% YoY. Source: county tax records.
Cash-flow waterfall
monthlySold comps — $/sqft
last 12 mo · ≤1 miLoading sold comps…