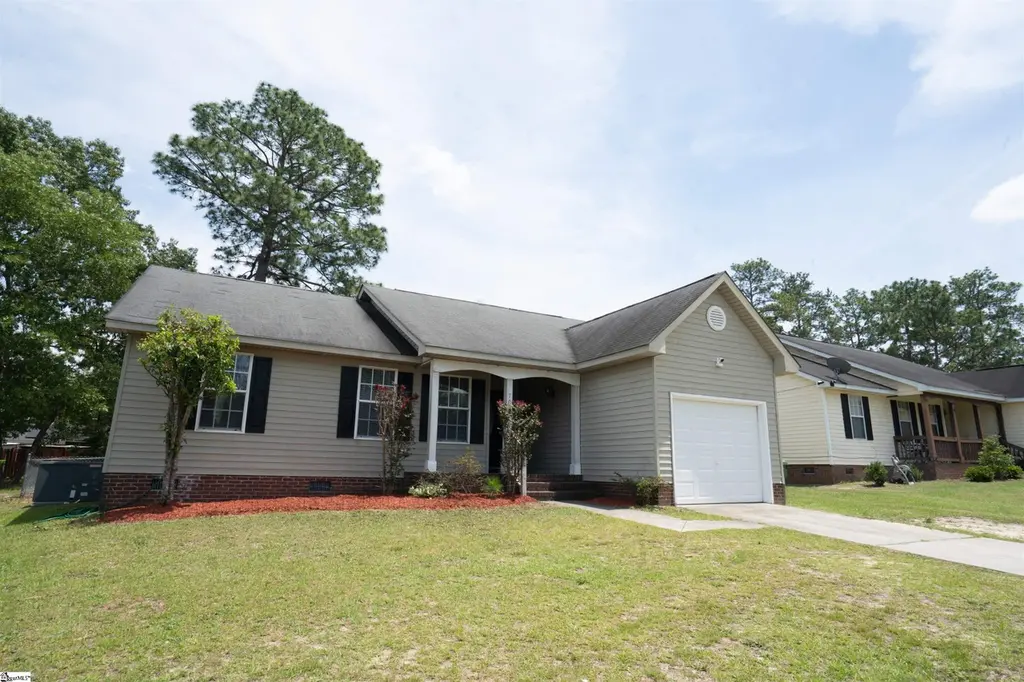
705 Bitternut Rd · Columbia, SC
Flood risk 1/10 · Minimal
- FEMA flood zone
- X
- Chance of flooding over 30 yrs
- 0.0%
- Est. flood insurance / yr
- $435 – $905
Fire risk 2/10 · Minimal
- Est. fire insurance / yr
- $783 – $1,453
Heat risk 7/10 · Major
- Hot days now (above threshold)
- 7 days/yr
- Hot days in 30 yrs
- 16 days/yr
Wind risk No data
- Chance of severe wind over 30 yrs
- —
Air-quality risk No data
- Unhealthy air days now
- —
- Unhealthy air days in 30 yrs
- —
Risk factors via First Street. Map © Google.
Why this score? — see what drove the D grade
The composite is a weighted blend of 9 inputs, each scored 0–100. Each bar is that input's sub-score; the figure is the points it added to the 100-point composite (weight × sub-score).
- Cash flow +13.4/30.0
- ARV discount +11.1/15.0
- DSCR +4.0/10.0
- Livability +3.9/5.0
- 1% rule +3.0/10.0
- Rent growth +3.0/5.0
- Schools +2.6/10.0
- Condition / age +2.5/5.0
- Appreciation +0.0/10.0
$194,900
🖨 Deal sheet 📄 Offer letter ✓ Due diligence
Listing remarks
Welcome to 705 Bitternut Rd- a charming 3 bedroom, 2 bath home offering a spacious layout designed for everyday living. The kitchen features a tile backsplash, stainless steel appliances, and plenty of cabinet and counter space. Step outside to enjoy the backyard deck overlooking the fully fenced yard-perfect for relaxing, entertaining, or enjoying time outdoors. Conveniently located near Fort Jackson, shopping, dining, and major commute routes, this home offers an excellent combination of comfort, convenience, and value. Whether you're a first-time homebuyer, looking to downsize, or simply seeking a fresh start, this home is ready for its next owner. Located in the established Quail Point
Key facts
- Spacious backyard
- Columbia location
- 9,583 sq ft lot
Tags
Property features AI
Finance
- HOA & community: No HOA fees
Exterior
- Parking: Attached 1-car garage; Paved concrete driveway
- Utilities: Public water; Electric water heater; Public sewer; Public garbage pickup; Connected to electric power
- Home design: Single-story residential home; Built in 1996; Crawl space foundation
- Construction: Composition shingle roof; Vinyl siding exterior; Crawl space foundation; Built in 1996
- Exterior features: Deck; Fenced yard; Vinyl siding
Interior
- Kitchen: 12 x 12 kitchen; Smooth electric cooktop; Electric cooktop listed separately (same cooktop); Range hood; Dishwasher; Refrigerator; Granite countertops
- Bedrooms: Primary bedroom on main level with full bath, tub/shower and walk-in closet (approx. 12 x 13); Second bedroom (approx. 10 x 11); Third bedroom (approx. 10 x 11)
- Flooring: Laminate flooring
- Bathrooms: Two full bathrooms (both on the main level)
- Heating & cooling: Forced air heating; Central forced cooling
- Interior features: Ceiling fans; Granite countertops; No fireplace; Combo living and dining room
- Laundry & utility: Laundry on the first floor in the kitchen area; Electric dryer hookup
Neighborhood map
What this means for you Summary
Snapshot
- This is a 3-bed/2.0-bath single-family listed at $195k.
Deal economics
- At list price, monthly cash flow is $4 ($47/yr) — positive.
- The deal already cash-flows at list — no discount required.
- To meet the 1% rule (rent ≥ 1% of price), the offer needs to be $157k (19.6% below list).
- Recommended offer: $157k (19.6% below list) — sets the bar for 1% rule.
- Cap rate 6.3% vs local median 5.0% in Columbia — meaningfully above typical; check what's discounted (condition, days-on-market, listing class) to confirm the premium yield is real.
Location & tenants
- Location reads 78/100 on livability (#18 in SC, #2,436 nationally) — a middle-class / working-renter tenant base. Strengths: amenities A+, commute A+, cost of living A+; Watch: schools D+, employment D, crime F.
- Richland 01 (urban): math 26% / reading 36% proficiency, ranked #54 of 80 in SC (top 68%) — families likely to look elsewhere, expect single-tenant / working-renter base with shorter leases; 64% free/reduced lunch — lower-income household profile, screen leases tightly.
- Market conditions: Rents rising (+2.1%/yr); 295 active listings in the ZIP; 9 comparable units currently listed for rent nearby; rentals at typical pace (median 24d on market — plan ~3-4 weeks tenant-placement turnaround); 3,472 units permitted in Richland County in 2024 (1,096 in 5+ unit buildings).
- This rent runs 32% of the median local income ($59k/yr) — at the standard rent-burdened threshold; future hikes will face affordability resistance.
Forward outlook
- Local home prices are declining (-3.0%/yr); year-one equity from $1k of loan paydown is wiped out by about $6k of value loss. Plan a longer hold.
- Richland County population projected at +30% by 2050 — long-run rental-demand tailwind backs the buy-and-hold thesis.
Negotiation context
- Only 10 days on market — expect competitive offers; lowballing is unlikely to land.
- 2 sale attempts since 5y ago with the ask held roughly flat each time — persistent listings suggest the price (not the market) is what's stuck; bring a comps-based counter.
- Current owner paid $168k; 16% above their basis — modest negotiation headroom, anchor on the comps not their cost.
Risks & watch-outs
- Climate carrying-cost: extreme-heat days projected 7→16/yr by 2055 (HVAC capex compounding) — expect insurance premiums to compound above CPI over the hold.
Questions for the listing agent
- Is there a deadline driving the sale (1031 exchange, divorce, estate, relocation)? That informs how much negotiation room exists.
- Schools are D-rated, which usually means shorter tenancies and higher turnover. Who's the typical renter profile here, and what's been the actual vacancy rate?
- Crime grade is F in this area — have there been break-ins, vandalism, or insurance claims at this property in the last 3 years? What carrier currently insures it and at what premium?
- The area grade is low — what's the realistic commute time and amenity access for the typical tenant pool here? Any planned neighborhood developments (good or bad) we should know about?
- What's the average days-on-market for RENTAL listings here right now (not sales)? A rising rental-DOM trend means longer vacancies and softer asking-rent achievability than the comps imply.
- What's the recent tenant-quality profile in this submarket — average credit score on applications, eviction rate, late-payment / NSF rate, and stable-employment percentage? A property-management company in the area should have these aggregated.
- How much new for-sale + rental construction is in the pipeline within 1–3 miles? Heavy new supply typically softens prices + rents 12–24 months out; constrained supply supports both.
Investment metrics
- 1% rule
- 0.80% ✗
- Cap rate
- 6.32%
- Cash-on-cash
- 0.09%
- DSCR
- 1.00
- GRM
- 10.4
CMA / ARV
- ARV (on-the-fly)
- $212,100
- Comps found
- 2
Show comp detail 2 sales within ~0.75 mi
| Address | Dist | Beds/Ba | Sqft | Sold | Price | $/sf | Match |
|---|---|---|---|---|---|---|---|
| 236 Hunters Rd | 0.66mi | 3/2.0 | 1,349 (+11%) | 1mo | $197,000 | $146 | 50 |
| 250 Saskatoon Dr | 0.69mi | 3/2.5 | 1,307 (+8%) | 22mo | $228,530 | $175 | 35 |
Match score weights: distance 35% · size 25% · config 20% · recency 20%. Top-matched comps best support the ARV.
Projected returns pro-forma
-3.0% appreciation · 2.08% rent growth · sell at horizon
- IRR
- -17.2%
- Equity multiple
- 0.40×
- Total profit
- $-32,817
- Equity at exit
- $29,060
- IRR
- -10.8%
- Equity multiple
- 0.37×
- Total profit
- $-34,233
- Equity at exit
- $16,851
Cash invested: $54,572 (down + closing). Projections, not guarantees.
Landlord ↔ Tenant lean methodology
- Overall (STATE)
- 90 Strongly Landlord-Friendly
- State South Carolina
- 90 Strongly Landlord-Friendly · R+6
- County
- — inherits STATE
- City
- — inherits STATE
ZIP-level market 29209
- Rents YoY
- 2.1%
- Active inventory
- 295
- Price-to-rent
- 10.4×
Monthly cashflow live
- Estimated rent
- $1,567 high interval (Pro) →
- Mortgage (P&I)
- −$1,022
- Tax from tax record
- −$131 /mo · $1,567/yr
- Insurance
- −$81
- HOA
- −$0
- Vacancy / Maint / Mgmt
- −$329
- Net cashflow
- $4
Break-even live
UW: 25.0% down · 7.5% · 30yr · 1.5% tax · 5.0% vac · 8.0% maint · 8.0% mgmt
Financing live
Cash to close
- Down payment
- $48,725
- Closing costs
- $5,847
- Reserves months
- —
- Total cash needed
- —
Loan-product check · same deal, 3 products live
Conventional
25% down · 7.5% · 30yr
- Down + closing
- —
- Monthly P&I
- —
- Monthly cashflow
- —
- DSCR
- —
- Eligible?
- —
Personal DTI + credit; lowest rate.
DSCR
20% down · 8.5% · 30yr
- Down + closing
- —
- Monthly P&I
- —
- Monthly cashflow
- —
- DSCR
- —
- Eligible?
- —
No personal income docs; deal must DSCR.
Hard money
10% down · 12.0% · 12mo
- Down + closing
- —
- Monthly P&I
- —
- Monthly cashflow
- —
- DSCR
- —
- Eligible?
- —
Short-term bridge; refi at stabilization.
Rent comps 9 comps
| Address | Beds | Baths | Sqft | Rent | $/sqft | DOM | Units | Dist |
|---|---|---|---|---|---|---|---|---|
| 429 Mockernut Ln Columbia, SC | 3.0 | 1.0 | 1010 | $1,250 | $1.24 | 23d | 1 | 0.18mi |
| 329 Ovanta Rd Columbia, SC | 3.0 | 1.5 | 1100 | $1,200 | $1.09 | 23d | 1 | 0.21mi |
| 101 Shagbark Ave Columbia, SC | 3.0 | 1.0 | 1000 | $1,295 | $1.29 | 19d | 1 | 0.28mi |
| 385 Saskatoon Dr Unit 385 Columbia, SC | 3.0 | 2.0 | 1330 | $2,000 | $1.50 | 23d | 1 | 0.81mi |
| 305 Shoreditch Dr Columbia, SC | 3.0 | 1.5 | 1378 | $1,586 | $1.15 | 19d | 1 | 0.96mi |
| 313 Shoreditch Dr Columbia, SC | 3.0 | 1.5 | 1056 | $1,775 | $1.68 | 23d | 1 | 0.98mi |
| 302 Crooked Pine Ct Columbia, SC | 3.0 | 2.0 | 1399 | $1,883 | $1.35 | 23d | 1 | 1.11mi |
| 455 Hunters Crossing Dr Hopkins, SC | 3.0 | 2.0 | 1381 | $1,699 | $1.23 | 14d | 1 | 1.12mi |
| 345 Bevington Brook Ln Hopkins, SC | 3.0 | 2.0 | 1475 | $2,195 | $1.49 | 23d | 1 | 1.43mi |
Listing history 10 events
-
2026-06-18price $194,900 Active 10 DOM
-
2026-06-18days on market $200,000 Active 10 DOM
-
2026-06-17days on market $200,000 Active 9 DOM
-
2026-06-16remarks 699-char remark
-
2026-06-16days on market $200,000 Active 8 DOM
-
2026-06-15days on market $200,000 Active 7 DOM
-
2026-06-14days on market $200,000 Active 5 DOM
-
2026-06-10days on market $200,000 Active 2 DOM
-
2026-06-09remarks 456-char remark
-
2026-06-09$200,000 Active 1 DOM
ⓘ Source: listings_history table (triggers on properties + properties_extension) + one-shot
backfill from property_details.listing_events for pre-trigger history.
Tax reassessment forecast SC · Resets to sale price
- Current annual tax
- $1,567 · $131/mo
- Projected year-2 tax
- $1,567 · $131/mo
- Expected delta
- $0/yr ($0/mo · 0.0%)
ⓘ Screening estimate from a state-policy table — verify with the county assessor before closing.
Climate risk First Street
- Flood 1/10 Low FEMA zone X · 0% chance over 30 yrs
- Wildfire 2/10 Low
- Heat 7/10 Severe
Nearby sold comps map
Loading sold comps map…
Walkable amenities ~0.75 mi
Loading nearby amenities…
Taxation est. · year 1
- Rental income
- $18,802
- − Mortgage interest
- −$10,917
- − Property taxes
- −$1,567
- − Insurance
- −$974
- − Repairs & maintenance
- −$1,504
- − Management
- −$1,504
- − Depreciation
- −$5,670
- Taxable loss
- −$3,336
- Est. tax savings @ 24.0%
- +$801
- After-tax cash flow
- $847/yr
For passive investors: Depreciation is non-cash, so a rental often shows a tax loss while cash-flowing — sheltering income. Rental losses are passive: they offset passive income freely, and up to $25,000/yr can offset ordinary (W-2) income if you actively participate and your MAGI is under $100k (phasing out to $0 by $150k); unused losses carry forward. On sale, claimed depreciation is recaptured at up to 25%, and gains may owe capital-gains tax (a 1031 exchange can defer both). Figures are a year-1 estimate at your 24.0% rate — not tax advice; consult a CPA.
Schools (NCES district)
- District
- Richland 01
- NCES district ID
- 4503360
- Math proficiency
- 26% ▼ -7.00%
- Reading proficiency
- 36% ▼ -5.00%
- Median HH income
- $38,931
- Composite
- 25.94/100
- National rank
- #7335
- State rank
- #54 of 80 in SC
Livability — Columbia
- Score
- 78/100
- State rank
- #18
- US rank
- #2436
Category grades
Schools grade is shown separately in the Schools card above.
Census & demographics
- County
- Richland County · 389,530 people
- City population
- 335,994
- Metro
- Columbia, SC
- Population (ZIP)
- 38,041
- Household income
- $58,772
- Rent vs Own
- Severe rent burden
- 1716.0
Population outlook (Richland County) Hauer SSP2
- Today (2025)
- 459,667 people
- By 2030
- 487,524 · +6.1%
- By 2040
- 542,035 · +17.9%
- By 2050
- 595,371 · +29.5%
- By 2075
- 732,998 · +59.5%
- By 2100
- 820,415 · +78.5%
Race, ethnicity, and origin ACS 2023
- Neighborhood character
- Diverse neighborhood (Simpson 0.62)
- Race & ethnicity
- Black 48% White 39% Two or more races 6% Hispanic / Latino 6% Asian 2%
- Hispanic origin (detail)
- Mexican 3% Puerto Rican 2%
- Common ancestry
- Slovak 2% Serbian 2% Italian 1%
- Foreign-born
- 6% · Canada, Jamaica
- Languages at home
- 93% English-only · Spanish 3% Arabic 1% Other Indo-European 1%
Political lean MEDSL · Richland
- 2024 margin
- Solid D (+34.6) · D 66.4% · R 31.8% · Other 1.8%
- 2008→2024 swing
- +5.7pp toward D · 2008: 28.9pp · 2024: 34.6pp
- All cycles
- 2024: D+34.6 2020: D+38.3 2016: D+32.9 2012: D+33.3 2008: D+28.9
Not yet ingested
- Civics
- —
Market trends
- HPI YoY
- ▼ -142.10%
- Current HPI
- 205.5679
- Rent YoY
- ▲ 2.08%
- Metro
- Columbia, SC
- State GDP YoY
- ▲ 4.51%
- F500 in state
- 2
Industry mix (Fortune 500 HQ in SC)
| Industry | F500 HQs | Revenue |
|---|---|---|
| Packaging | 1 | $7B |
|
||
Price history
+2122.2% since first listed9 events — show timeline
- 2026-06-08 Listed $200,000 Greater Greenville MLS
- 2021-09-27 Sold (Public Records) $167,500 Public Records
- 2021-08-05 Delisted — Consolidated MLS
- 2021-08-03 Listed $155,000 Consolidated MLS
- 2021-05-23 Sold (Public Records) $81,150 Public Records
- 2006-04-07 Sold (Public Records) $86,700 Public Records
- 2001-03-02 Sold (Public Records) $83,000 Public Records
- 1996-07-24 Sold (Public Records) $75,600 Public Records
- 1996-05-14 Sold (Public Records) $9,000 Public Records
Property tax history
-3.5%/yrLatest (2025): $1,567 · +4.3% YoY. Source: county tax records.
Cash-flow waterfall
monthlySold comps — $/sqft
last 12 mo · ≤1 miLoading sold comps…