 🏷️ Likely Rental
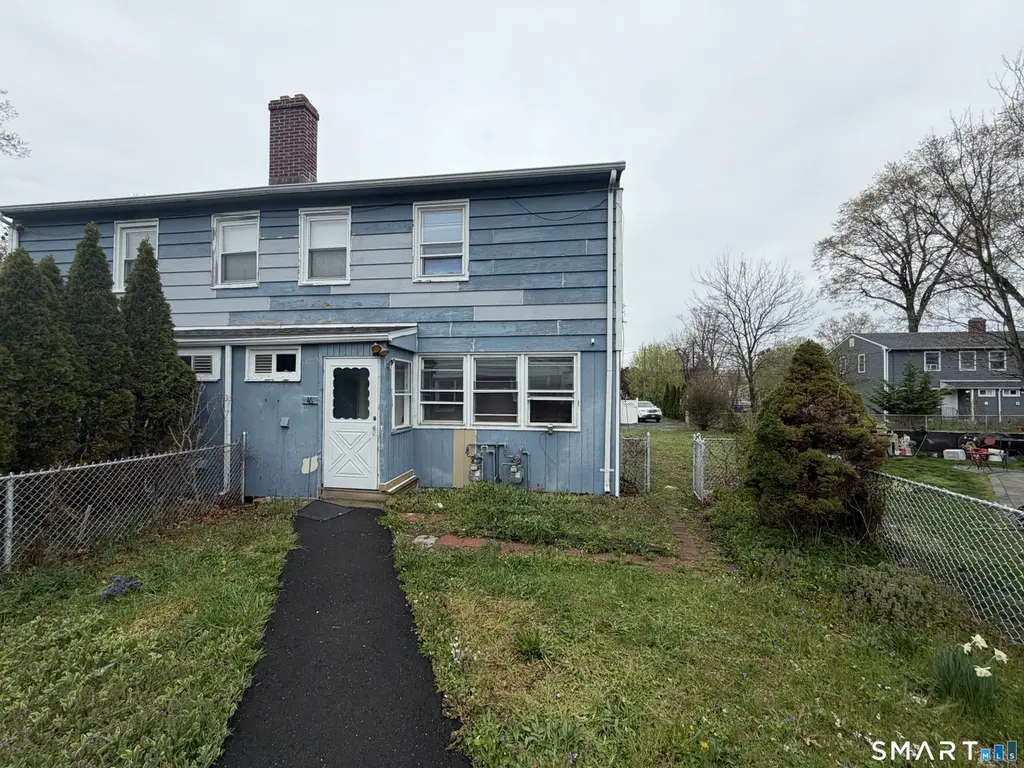
46 Vought Pl · Stratford, CT
Flood risk No data
- FEMA flood zone
- —
- Chance of flooding over 30 yrs
- —
- Est. flood insurance / yr
- —
Fire risk No data
- Est. fire insurance / yr
- —
Heat risk No data
- Hot days now (above threshold)
- —
- Hot days in 30 yrs
- —
Wind risk No data
- Chance of severe wind over 30 yrs
- —
Air-quality risk No data
- Unhealthy air days now
- —
- Unhealthy air days in 30 yrs
- —
Risk factors via First Street. Map © Google.
Why this score? — see what drove the B+ grade
The composite is a weighted blend of 9 inputs, each scored 0–100. Each bar is that input's sub-score; the figure is the points it added to the 100-point composite (weight × sub-score).
- Cash flow +30.0/30.0
- ARV discount +15.0/15.0
- 1% rule +10.0/10.0
- DSCR +10.0/10.0
- Livability +3.8/5.0
- Schools +2.8/10.0
- Rent growth +2.5/5.0
- Condition / age +1.0/5.0
- Appreciation +0.0/10.0
$90,000
🖨 Deal sheet 📄 Offer letter ✓ Due diligence
Listing remarks
2 BR, 1 BA townhouse-style unit with great potential! Features include a large fenced yard, preferred rear parking, and oversized shed for storage. Home needs work and is being sold as-is. Per HOA, all required repairs must be completed prior to occupancy. HOA includes real estate taxes, heat, water, sewer, and certain maintenance costs. Owner-occupied community, no rentals permitted. Buyer must meet HOA requirements: minimum 650 credit score, $3,500/month gross income, max 36 DTI, and submission of 2 years of tax returns and supporting documentation. Full details provided during application process.
Key facts
- $576 HOA
- 2 parking spots
- Built 1942
Property features AI
Finance
- Other: Professional on-site property management; Pets allowed (contact Stonybrook for details)
- Financial info: $576 monthly HOA fee
- HOA & community: Homeowners association with monthly fee; Association fee includes front desk receptionist, water, sewer, property management, and taxes
Exterior
- Parking: Paved off-street parking; 2 parking spaces
- Utilities: Public water connected; Public sewer connected; Natural gas service
- Home design: Co-op unit (Condo/Co-Op for sale); Located in the Stonybrook Gardens complex; End unit; Unit on 1st floor; Blue exterior color
- Construction: Frame construction
- Exterior features: Wood siding; Level lot on a cul-de-sac
Interior
- Kitchen: Gas range; Range hood
- Bedrooms: 2 bedrooms
- Bathrooms: 1 full bathroom
- Heating & cooling: Baseboard heat; Natural gas hot water (40-gallon tank)
- Interior features: 5 total rooms; 2 levels; Crawl space basement; Attic with pull-down stairs
- Laundry & utility: Washer and dryer included; Laundry in utility room on main level
Neighborhood map
What this means for you Summary
Snapshot
- This is a 2-bed/1.0-bath condo listed at $90k. Condition is rated poor.
Deal economics
- At list price, monthly cash flow is $548 ($7k/yr) — positive.
- The deal already cash-flows at list — no discount required.
- Meets the 1% rule at list price ($2k rent vs $90k).
Location & tenants
- Location reads 76/100 on livability (#56 in CT, #3,523 nationally) — a middle-class / working-renter tenant base. Strengths: housing A+, health & safety A+, crime A-; Watch: commute F.
- Stratford School District (urban): math 22% / reading 38% proficiency, ranked #122 of 153 in CT (top 80%) — families likely to look elsewhere, expect single-tenant / working-renter base with shorter leases.
- Market conditions: 138 active listings in the ZIP; 40 comparable units currently listed for rent nearby; rentals at typical pace (median 22d on market — plan ~3-4 weeks tenant-placement turnaround); 852 units permitted in Greater Bridgeport Planning Region in 2024 (698 in 5+ unit buildings).
Forward outlook
- Local home prices are declining (-3.0%/yr); year-one equity from $622 of loan paydown is wiped out by about $3k of value loss. Plan a longer hold.
- At projected returns (-3.0% appreciation + 3.0% rent growth), your $25k cash investment doubles in ~5 years — after that, you're playing with house money.
Negotiation context
- Only 9 days on market — expect competitive offers; lowballing is unlikely to land.
Risks & watch-outs
- Watch-outs: HOA is 26% of rent; built in 1942 — expect roof / HVAC / electrical / plumbing capex.
Questions for the listing agent
- Have any recent inspections been done? Can we get a copy of the seller's disclosures and any deferred-maintenance estimates?
- Built in 1942 — when were the roof, HVAC, electrical panel, plumbing, and water heater last replaced?
- What does the HOA fee cover, when was the last increase, and are there any pending special assessments or reserve-fund shortfalls?
- Any open or pending special assessments — roof, HVAC, plumbing, elevator, façade? What's the per-unit balance and payoff schedule, and is the seller paying it off at close or rolling it to the buyer?
- Is there a deadline driving the sale (1031 exchange, divorce, estate, relocation)? That informs how much negotiation room exists.
- What's the average days-on-market for RENTAL listings here right now (not sales)? A rising rental-DOM trend means longer vacancies and softer asking-rent achievability than the comps imply.
- What's the recent tenant-quality profile in this submarket — average credit score on applications, eviction rate, late-payment / NSF rate, and stable-employment percentage? A property-management company in the area should have these aggregated.
- How much new apartment / multifamily construction is in the pipeline within 1–3 miles? Heavy new supply (>2% of stock underway) typically softens rents 12–24 months out; light construction supports rent growth.
Investment metrics
- 1% rule
- 2.46% ✓
- Cap rate
- 13.60%
- Cash-on-cash
- 26.08%
- DSCR
- 2.16
- GRM
- 3.4
CMA / ARV
- ARV (median comp)
- $157,445
- List price
- $90,000
- Delta
- -42.84%
- Verdict
- UNDERPRICED
- Comps
- 20 within 1.0 mi
Projected returns pro-forma
-3.0% appreciation · 3.0% rent growth · sell at horizon
- IRR
- 20.1%
- Equity multiple
- 1.82×
- Total profit
- $20,686
- Equity at exit
- $13,419
- IRR
- 28.5%
- Equity multiple
- 3.56×
- Total profit
- $64,504
- Equity at exit
- $7,782
Cash invested: $25,200 (down + closing). Projections, not guarantees.
Landlord ↔ Tenant lean methodology
- Overall (STATE)
- 27 Tenant-Leaning
- State Connecticut
- 27 Tenant-Leaning · D+7
- County
- — inherits STATE
- City
- — inherits STATE
ZIP-level market 06614
- Active inventory
- 138
- Price-to-rent
- 3.4×
Monthly cashflow live
- Estimated rent
- $2,210 high interval (Pro) →
- Mortgage (P&I)
- −$472
- Tax est. 1.5%
- −$112 /mo · $1,350/yr
- Insurance
- −$38
- HOA
- −$576
- Vacancy / Maint / Mgmt
- −$464
- Net cashflow
- $548
Break-even live
UW: 25.0% down · 7.5% · 30yr · 1.5% tax · 5.0% vac · 8.0% maint · 8.0% mgmt
Financing live
Cash to close
- Down payment
- $22,500
- Closing costs
- $2,700
- Reserves months
- —
- Total cash needed
- —
Loan-product check · same deal, 3 products live
Conventional
25% down · 7.5% · 30yr
- Down + closing
- —
- Monthly P&I
- —
- Monthly cashflow
- —
- DSCR
- —
- Eligible?
- —
Personal DTI + credit; lowest rate.
DSCR
20% down · 8.5% · 30yr
- Down + closing
- —
- Monthly P&I
- —
- Monthly cashflow
- —
- DSCR
- —
- Eligible?
- —
No personal income docs; deal must DSCR.
Hard money
10% down · 12.0% · 12mo
- Down + closing
- —
- Monthly P&I
- —
- Monthly cashflow
- —
- DSCR
- —
- Eligible?
- —
Short-term bridge; refi at stabilization.
Rent comps 40 comps
| Address | Beds | Baths | Sqft | Rent | $/sqft | DOM | Units | Dist |
|---|---|---|---|---|---|---|---|---|
| 591 Pearl Harbor St Bridgeport, CT | 2.0 | 1.0 | 900 | $1,750 | $1.94 | 3d | 1 | 0.56mi |
| 172 Swanson Ave Stratford, CT | 3.0 | 1.5 | 1495 | $3,300 | $2.21 | 3d | 1 | 0.58mi |
| 285 Clover St Unit 2 Stratford, CT | 3.0 | 1.0 | 1152 | $2,150 | $1.87 | 44d | 1 | 0.78mi |
| 285 Clover St Unit 2 Stratford, CT | 2.0 | 1.0 | 1152 | $2,150 | $1.87 | 24d | 1 | 0.78mi |
| 184 Pearl Harbor St Unit 2 Bridgeport, CT | 2.0 | 1.0 | 850 | $2,000 | $2.35 | 24d | 1 | 0.83mi |
| 228 Weber St Unit 2ndfl Stratford, CT | 2.0 | 1.0 | 937 | $2,100 | $2.24 | 44d | 1 | 0.85mi |
| 231 Nichols Ave Stratford, CT | 3.0 | 1.0 | 1200 | $3,000 | $2.50 | 19d | 1 | 0.87mi |
| 64 Velvet St Bridgeport, CT | 3.0 | 1.0 | 1430 | $2,500 | $1.75 | 12d | 1 | 0.93mi |
| 600 Bond St Unit 113 Bridgeport, CT | 2.0 | 1.0 | 893 | $3,000 | $3.36 | 44d | 1 | 0.94mi |
| 47 Clover St Stratford, CT | 2.0 | 1.0 | 1280 | $1,950 | $1.52 | 14d | 1 | 1.01mi |
| 197-199 Dupont Pl Bridgeport, CT | 1.0 | 1.0 | 976 | $1,700 | $1.74 | 3d | 1 | 1.01mi |
| 119 Dupont Pl Bridgeport, CT | 2.0 | 1.0 | 820 | $2,000 | $2.44 | 44d | 1 | 1.01mi |
| 191 DuPont Pl Bridgeport, CT | 2.0 | 1.0 | 810 | $1,850 | $2.28 | 24d | 1 | 1.02mi |
| 1874 Barnum Ave Unit 2E Stratford, CT | 3.0 | 1.0 | 1000 | $2,800 | $2.80 | 3d | 1 | 1.03mi |
| 1095 Hillside Ave Unit 1 Stratford, CT | 2.0 | 1.0 | 1186 | $2,300 | $1.94 | 24d | 1 | 1.03mi |
| 444 Huntington Rd Stratford, CT | 2.0 | 1.0 | 934 | $2,150 | $2.30 | 3d | 1 | 1.06mi |
| 371 Dover St Unit 371 Bridgeport, CT | 2.0 | 1.0 | 900 | $2,100 | $2.33 | 44d | 1 | 1.07mi |
| 25 Colonial Dr Unit NA Stratford, CT | 3.0 | 1.0 | 1310 | $3,400 | $2.60 | 11d | 1 | 1.12mi |
| 129 Sage Ave Unit 2R Bridgeport, CT | 2.0 | 1.0 | 1030 | $1,750 | $1.70 | 21d | 1 | 1.15mi |
| 144 Palisade Ave Bridgeport, CT | 3.0 | 1.0 | 1096 | $2,600 | $2.37 | 44d | 1 | 1.17mi |
| 268 Bond St Bridgeport, CT | 2.0 | 1.0 | 900 | $2,200 | $2.44 | 44d | 1 | 1.18mi |
| 35 Nob Hill Cir Unit D Bridgeport, CT | 2.0 | 1.0 | 900 | $2,050 | $2.28 | 44d | 1 | 1.19mi |
| 985 Huntington Rd Stratford, CT | 2.0 | 1.0 | 900 | $1,750 | $1.94 | 24d | 1 | 1.20mi |
| 2336 Barnum Ave Stratford, CT | 2.0 | 1.0 | 1272 | $1,950 | $1.53 | 3d | 1 | 1.20mi |
| 282 Texas Ave Unit Nob Bridgeport, CT | 2.0 | 1.0 | 980 | $2,000 | $2.04 | 14d | 1 | 1.20mi |
| 136 Peace St Unit 4 Stratford, CT | 2.0 | 1.0 | 800 | $1,700 | $2.12 | 44d | 1 | 1.21mi |
| 192 Peace St Unit 1st floor Stratford, CT | 2.0 | 1.0 | 712 | $2,000 | $2.81 | 44d | 1 | 1.24mi |
| 246 Judson Pl Apt B Bridgeport, CT | 3.0 | 1.0 | 1000 | $2,800 | $2.80 | 14d | 1 | 1.26mi |
| 54 Remington St Bridgeport, CT | 3.0 | 1.0 | 1004 | $1,900 | $1.89 | 3d | 1 | 1.28mi |
| 250 Summerfield Ave Unit 1 Bridgeport, CT | 2.0 | 1.0 | 1000 | $1,875 | $1.88 | 3d | 1 | 1.29mi |
| 110-112 Pixlee Pl Unit 2 Bridgeport, CT | 2.0 | 1.0 | 1151 | $1,800 | $1.56 | 21d | 1 | 1.32mi |
| 1804 Barnum Ave Unit 10 Bridgeport, CT | 2.0 | 1.0 | 1100 | $2,000 | $1.82 | 44d | 1 | 1.33mi |
| 335 Ridgefield Ave Bridgeport, CT | 3.0 | 1.0 | 1400 | $2,250 | $1.61 | 3d | 1 | 1.34mi |
| 253 East Ave Unit 253 Bridgeport, CT | 2.0 | 1.0 | 1267 | $1,750 | $1.38 | 24d | 1 | 1.34mi |
| 333 Ridgefield Ave Bridgeport, CT | 3.0 | 1.0 | 1400 | $2,250 | $1.61 | 3d | 1 | 1.34mi |
| 125 Louisiana Ave #125 Bridgeport, CT | 2.0 | 1.0 | 1448 | $1,750 | $1.21 | 44d | 1 | 1.34mi |
| 116 Hastings St Bridgeport, CT | 2.0 | 1.5 | 857 | $2,400 | $2.80 | 14d | 1 | 1.35mi |
| 654 Longbrook Ave #654 Stratford, CT | 2.0 | 1.5 | 907 | $2,500 | $2.76 | 24d | 1 | 1.38mi |
| 120 Huntington Tpke #809 Bridgeport, CT | 2.0 | 1.0 | 940 | $2,100 | $2.23 | 3d | 1 | 1.38mi |
| 53 Pixlee Pl Unit 2nd Bridgeport, CT | 3.0 | 1.0 | 1475 | $2,195 | $1.49 | 3d | 1 | 1.39mi |
HOA detail condo
- Monthly dues
- $576 · $6,912/yr
- Likely covers
- watersewer
- Assessments
- None detected in remarks — confirm with the listing agent.
Listing history 2 events
-
2026-05-14status Under Contract 607-char remark
-
2026-05-05$90,000 Active 607-char remark
ⓘ Source: listings_history table (triggers on properties + properties_extension) + one-shot
backfill from property_details.listing_events for pre-trigger history.
Nearby sold comps map
Loading sold comps map…
Walkable amenities ~0.75 mi
Loading nearby amenities…
Taxation est. · year 1
- Rental income
- $26,516
- − Mortgage interest
- −$5,041
- − Property taxes
- −$1,350
- − Insurance
- −$450
- − Repairs & maintenance
- −$2,121
- − Management
- −$2,121
- − HOA
- −$6,912
- − Depreciation
- −$2,618
- Taxable income
- $5,902
- Est. tax owed @ 24.0%
- −$1,417
- After-tax cash flow
- $5,156/yr
For passive investors: Depreciation is non-cash, so a rental often shows a tax loss while cash-flowing — sheltering income. Rental losses are passive: they offset passive income freely, and up to $25,000/yr can offset ordinary (W-2) income if you actively participate and your MAGI is under $100k (phasing out to $0 by $150k); unused losses carry forward. On sale, claimed depreciation is recaptured at up to 25%, and gains may owe capital-gains tax (a 1031 exchange can defer both). Figures are a year-1 estimate at your 24.0% rate — not tax advice; consult a CPA.
Condition & rehab AI · 22 photos
This property requires extensive renovations and repairs to bring it up to a livable condition. Immediate safety and aesthetic issues need addressing, including exposed wiring, missing fixtures, and peeling paint. Upgrading the kitchen, windows, and HVAC, along with landscaping, would significantly increase its value.
Repairs flagged
- Major Exposed wiring in kitchen — Safety hazard
- Major Missing countertops in kitchen — Aesthetic and functionality
- Major Missing fixtures in bathroom — Aesthetic and functionality
- Major Peeling paint throughout — Safety and aesthetics
- Major Exposed subfloor in kitchen — Safety and functionality
- Major Old windows — Safety and energy efficiency
- Major Old HVAC appliances — Energy efficiency and comfort
Value-add opportunities
- Both Painting and updating kitchen cabinets — Improves aesthetics and functionality
- Both Upgrading windows and HVAC — Enhances energy efficiency and comfort
- Both Landscaping and yard maintenance — Improves curb appeal and property value
Renovation cost estimate screening
| Repair item | Severity | Est. cost |
|---|---|---|
| Exposed wiring in kitchen · Safety hazard | Major | $15,000–50,000 |
| Missing countertops in kitchen · Aesthetic and functionality | Major | $15,000–50,000 |
| Missing fixtures in bathroom · Aesthetic and functionality | Major | $15,000–50,000 |
| Peeling paint throughout · Safety and aesthetics | Major | $15,000–50,000 |
| Exposed subfloor in kitchen · Safety and functionality | Major | $15,000–50,000 |
| Old windows · Safety and energy efficiency | Major | $15,000–50,000 |
| Old HVAC appliances · Energy efficiency and comfort | Major | $15,000–50,000 |
| Total estimated repair cost · 7 items | $105,000–350,000 |
Value-add ROI direction
- Both Painting and updating kitchen cabinets — Improves aesthetics and functionality ↑
- Both Upgrading windows and HVAC — Enhances energy efficiency and comfort ↑
- Both Landscaping and yard maintenance — Improves curb appeal and property value ↑
ⓘ Cost ranges are severity-bucket heuristics (US national rule-of-thumb). Get contractor quotes + a written scope before underwriting a rehab budget.
Schools (NCES district)
- District
- Stratford School District
- NCES district ID
- 0904440
- Math proficiency
- 22% ▼ -12.00%
- Reading proficiency
- 38% ▼ -10.00%
- Median HH income
- $67,912
- Composite
- 27.85/100
- National rank
- #6877
- State rank
- #122 of 153 in CT
Livability — Stratford
- Score
- 76/100
- State rank
- #56
- US rank
- #3523
Category grades
Schools grade is shown separately in the Schools card above.
Census & demographics
- City population
- 17,136
- Population (ZIP)
- 35,538
Population outlook (Greater Bridgeport County) Hauer SSP2
- By 2040
- 365,581
Race, ethnicity, and origin ACS 2023
- Neighborhood character
- Predominantly White (70%)
- Race & ethnicity
- White 70% Hispanic / Latino 17% Two or more races 8% Black 8% Asian 2%
- Hispanic origin (detail)
- Mexican 3% Puerto Rican 7% Dominican 2%
- Common ancestry
- Romanian 8% Scotch-Irish 3% Lithuanian 2%
- Foreign-born
- 11% · Canada, Jamaica, Dominican Republic
- Languages at home
- 80% English-only · Spanish 11% Other Indo-European 3% French/Haitian/Cajun 2%
Political lean MEDSL · Greater Bridgeport
- 2024 margin
- Strong D (+23.3) · D 60.9% · R 37.6% · Other 1.5%
- All cycles
- 2024: D+23.3
Not yet ingested
- Civics
- —
Market trends
- HPI YoY
- ▼ -343.74%
- Current HPI
- 206.0128
- Rent YoY
- —
- Metro
- —
- State GDP YoY
- ▲ 1.06%
- F500 in state
- 38
Industry mix (Fortune 500 HQ in CT)
| Industry | F500 HQs | Revenue |
|---|---|---|
| Industrial Machinery | 4 | $38B |
|
||
| Insurance | 3 | $71B |
|
||
| Financial Services | 2 | $25B |
|
||
| Transportation / Logistics | 2 | $18B |
|
||
| Healthcare | 1 | $247B |
|
||
| Telecommunications | 1 | $55B |
|
||
Price history
2 events — show timeline
- 2026-05-14 Pending — Smart MLS
- 2026-05-05 Listed $90,000 Smart MLS
Cash-flow waterfall
monthlySold comps — $/sqft
last 12 mo · ≤1 miLoading sold comps…