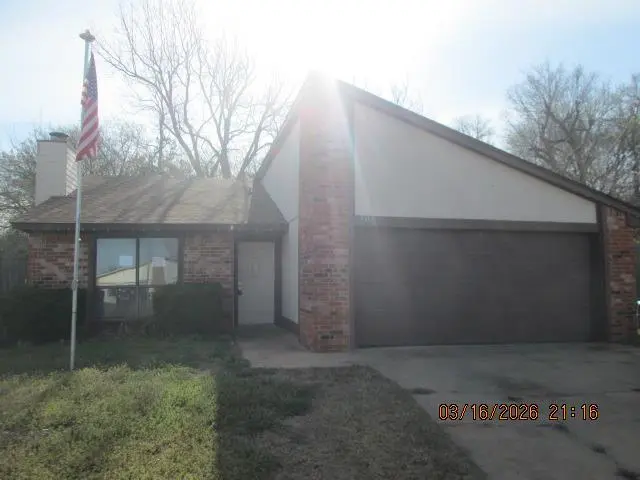
105 Stonewood Dr · Noble, OK
Flood risk 1/10 · Minimal
- FEMA flood zone
- X (unshaded)
- Chance of flooding over 30 yrs
- 0.0%
- Est. flood insurance / yr
- $507 – $1,088
Fire risk 5/10 · Moderate
- Est. fire insurance / yr
- $2,463 – $4,575
Heat risk 6/10 · Moderate
- Hot days now (above 109°F)
- 7 days/yr
- Hot days in 30 yrs
- 18 days/yr
Wind risk 3/10 · Minor
- Chance of severe wind over 30 yrs
- 5.0%
Air-quality risk 2/10 · Minimal
- Unhealthy air days now
- 1 days/yr
- Unhealthy air days in 30 yrs
- 1 days/yr
Risk factors via First Street. Map © Google.
Why this score? — see what drove the B grade
The composite is a weighted blend of 9 inputs, each scored 0–100. Each bar is that input's sub-score; the figure is the points it added to the 100-point composite (weight × sub-score).
- Cash flow +29.1/30.0
- ARV discount +15.0/15.0
- DSCR +10.0/10.0
- 1% rule +8.1/10.0
- Livability +3.3/5.0
- Rent growth +2.5/5.0
- Condition / age +2.5/5.0
- Schools +2.1/10.0
- Appreciation +0.0/10.0
$106,000
🖨 Deal sheet 📄 Offer letter ✓ Due diligence
Listing remarks MLS
BUYERS TO VERIFY ALL INFORMATION! PROPERTY TO BE SOLD AS IS, ALL OFFERS MUST BE SUBMITTED WITH CREDIT APPROVAL AND/OR PROOF OF FUNDS LETTER AND EARNEST MONEY. COMMISSION COULD BE PAID ON NET TO SELLER.
Key facts
- 9,583 sq ft lot
- 2 garage spots
- Built 1981
Property features AI
Finance
- Other: REO / Bank-owned; Vacant and unoccupied; No home warranty
- Financial info: Not assumable
- HOA & community: No mandatory association dues
Exterior
- Parking: 2-car garage
- Utilities: Assessor-reported living area 1,221
- Home design: Single-family residence; One story; Existing property
- Construction: Brick and frame construction; Composition roof; Slab foundation; Built (existing)
- Exterior features: Wood fencing; Located on a cul-de-sac
Interior
- Bedrooms: 3 bedrooms (single-level)
- Bathrooms: 2 full bathrooms
- Interior features: One living area; Masonry fireplace
Neighborhood map
What this means for you Summary
Snapshot
- This is a 3-bed/2.0-bath single-family listed at $106k.
Deal economics
- At list price, monthly cash flow is $366 ($4k/yr) — positive.
- The deal already cash-flows at list — no discount required.
- Meets the 1% rule at list price ($1k rent vs $106k).
- Cap rate 10.4% vs local median 3.7% in Noble — top-decile yield for the area; either an underpriced asset or a hidden risk that comps aren't pricing in. Stress-test before assuming the spread holds.
Location & tenants
- Location reads 66/100 on livability (#107 in OK) — a middle-class / working-renter tenant base. Strengths: employment A+, cost of living A+, housing A+; Watch: amenities F, commute F, health & safety F.
- Noble (suburban): math 23% / reading 25% proficiency, ranked #108 of 270 in OK (top 40%) — low school quality limits family demand, transient renter base, plan for 1-2y turnover.
- Zoned schools: John K Hubbard Es (math 27% / reading 27%, grade F, #311 of 845 statewide, top 40%, 646 students, 0% FRL); Noble Hs (math 17% / reading 27%, grade F, #222 of 447 statewide, top 52%, 883 students, 0% FRL) — zoned schools average 0% FRL vs 53% district-wide (53 pts lower); this property's tenant base skews higher-income than the district average.
- Market conditions: 214 active listings in the ZIP; 10 comparable units currently listed for rent nearby; rentals at typical pace (median 22d on market — plan ~3-4 weeks tenant-placement turnaround); 592 units permitted in Cleveland County in 2024 (12 in 5+ unit buildings).
Forward outlook
- Local home prices are declining (-3.0%/yr); year-one equity from $733 of loan paydown is wiped out by about $3k of value loss. Plan a longer hold.
- Cleveland County population projected at +40% by 2050 — long-run rental-demand tailwind backs the buy-and-hold thesis.
- At projected returns (-3.0% appreciation + 3.0% rent growth), your $30k cash investment doubles in ~8 years — after that, you're playing with house money.
Negotiation context
- Only 7 days on market — expect competitive offers; lowballing is unlikely to land.
- 5 sale attempts since 22y ago with the ask held roughly flat each time — persistent listings suggest the price (not the market) is what's stuck; bring a comps-based counter.
Risks & watch-outs
- Climate carrying-cost: moderate wildfire risk; extreme-heat days projected 7→18/yr by 2055 (HVAC capex compounding) — expect insurance premiums to compound above CPI over the hold.
Questions for the listing agent
- Is there a deadline driving the sale (1031 exchange, divorce, estate, relocation)? That informs how much negotiation room exists.
- Schools are F-rated, which usually means shorter tenancies and higher turnover. Who's the typical renter profile here, and what's been the actual vacancy rate?
- What's the average days-on-market for RENTAL listings here right now (not sales)? A rising rental-DOM trend means longer vacancies and softer asking-rent achievability than the comps imply.
- What's the recent tenant-quality profile in this submarket — average credit score on applications, eviction rate, late-payment / NSF rate, and stable-employment percentage? A property-management company in the area should have these aggregated.
- How much new for-sale + rental construction is in the pipeline within 1–3 miles? Heavy new supply typically softens prices + rents 12–24 months out; constrained supply supports both.
Investment metrics
- 1% rule
- 1.31% ✓
- Cap rate
- 10.44%
- Cash-on-cash
- 14.81%
- DSCR
- 1.66
- GRM
- 6.4
CMA / ARV
- ARV (on-the-fly)
- $186,813
- Comps found
- 12
Show comp detail 12 sales within ~0.75 mi
| Address | Dist | Beds/Ba | Sqft | Sold | Price | $/sf | Match |
|---|---|---|---|---|---|---|---|
| 108 Stonewood Dr | 0.03mi | 3/2.0 | 1,231 (+1%) | 7mo | $147,000 | $119 | 91 |
| 208 Stonewood Dr | 0.08mi | 3/2.0 | 1,256 (+3%) | 3mo | $187,900 | $150 | 89 |
| 4732 Forest Hills Dr | 0.24mi | 3/2.0 | 1,252 (+2%) | 2mo | $185,000 | $148 | 83 |
| 4636 Forest Hills Dr | 0.14mi | 3/2.0 | 1,331 (+9%) | 2mo | $190,000 | $143 | 77 |
| 4736 Forest Hills Dr | 0.25mi | 3/2.0 | 1,335 (+9%) | 3mo | $182,600 | $137 | 70 |
| 4601 Forest Hills Dr | 0.09mi | 3/2.0 | 1,356 (+11%) | 11mo | $207,500 | $153 | 68 |
| 337 Crest Ln | 0.52mi | 3/1.5 | 1,170 (-4%) | 7mo | $165,000 | $141 | 61 |
| 838 Twin Lakes Dr | 0.64mi | 3/2.0 | 1,208 (-1%) | 9mo | $212,000 | $175 | 61 |
| 827 Twin Lakes Dr | 0.65mi | 3/2.0 | 1,336 (+9%) | 2mo | $215,000 | $161 | 53 |
| 835 Twin Lakes Dr | 0.62mi | 3/2.0 | 1,340 (+10%) | 6mo | $211,000 | $157 | 50 |
| 819 Twin Lakes Dr | 0.67mi | 3/2.0 | 1,316 (+8%) | 11mo | $215,000 | $163 | 47 |
| 823 Twin Lakes Dr | 0.65mi | 3/2.0 | 1,399 (+15%) | 16mo | $215,000 | $154 | 32 |
Match score weights: distance 35% · size 25% · config 20% · recency 20%. Top-matched comps best support the ARV.
Projected returns pro-forma
-3.0% appreciation · 3.0% rent growth · sell at horizon
- IRR
- 5.4%
- Equity multiple
- 1.21×
- Total profit
- $6,171
- Equity at exit
- $15,805
- IRR
- 14.8%
- Equity multiple
- 2.20×
- Total profit
- $35,490
- Equity at exit
- $9,165
Cash invested: $29,680 (down + closing). Projections, not guarantees.
Landlord ↔ Tenant lean methodology
- Overall (STATE)
- 83 Strongly Landlord-Friendly
- State Oklahoma
- 83 Strongly Landlord-Friendly · R+20
- County
- — inherits STATE
- City
- — inherits STATE
ZIP-level market 73068
- Home prices YoY
- -4.8%
- Active inventory
- 214
- Price-to-rent
- 6.4×
Monthly cashflow live
- Estimated rent
- $1,387 high interval (Pro) →
- Mortgage (P&I)
- −$556
- Tax from tax record
- −$129 /mo · $1,553/yr
- Insurance
- −$44
- HOA
- −$0
- Vacancy / Maint / Mgmt
- −$291
- Net cashflow
- $366
Break-even live
UW: 25.0% down · 7.5% · 30yr · 1.5% tax · 5.0% vac · 8.0% maint · 8.0% mgmt
Financing live
Cash to close
- Down payment
- $26,500
- Closing costs
- $3,180
- Reserves months
- —
- Total cash needed
- —
Loan-product check · same deal, 3 products live
Conventional
25% down · 7.5% · 30yr
- Down + closing
- —
- Monthly P&I
- —
- Monthly cashflow
- —
- DSCR
- —
- Eligible?
- —
Personal DTI + credit; lowest rate.
DSCR
20% down · 8.5% · 30yr
- Down + closing
- —
- Monthly P&I
- —
- Monthly cashflow
- —
- DSCR
- —
- Eligible?
- —
No personal income docs; deal must DSCR.
Hard money
10% down · 12.0% · 12mo
- Down + closing
- —
- Monthly P&I
- —
- Monthly cashflow
- —
- DSCR
- —
- Eligible?
- —
Short-term bridge; refi at stabilization.
Rent comps 10 comps
| Address | Beds | Baths | Sqft | Rent | $/sqft | DOM | Units | Dist |
|---|---|---|---|---|---|---|---|---|
| 834 Highgarden Cir Noble, OK | 3.0 | 2.0 | 1464 | $1,695 | $1.16 | 4d | 1 | 0.58mi |
| 1008 Redstone Dr Noble, OK | 3.0 | 2.0 | 1063 | $1,300 | $1.22 | 23d | 1 | 0.61mi |
| 703 Willis St Noble, OK | 3.0 | 1.5 | 1167 | $1,195 | $1.02 | 4d | 1 | 1.05mi |
| 513 Redwood Dr Noble, OK | 4.0 | 1.5 | 1419 | $1,495 | $1.05 | 21d | 1 | 1.05mi |
| 513 Redwood Dr Noble, OK | 4.0 | 2.0 | 1419 | $1,495 | $1.05 | 23d | 1 | 1.05mi |
| 1416 Sandstone Dr Noble, OK | 3.0 | 2.0 | 1420 | $1,595 | $1.12 | 4d | 1 | 1.24mi |
| 1012 N 5th St #1014 Noble, OK | 2.0 | 1.0 | 975 | $975 | $1.00 | 21d | 1 | 1.30mi |
| 1014 N 5th St Noble, OK | 2.0 | 1.0 | 975 | $975 | $1.00 | 21d | 1 | 1.30mi |
| 1006 Aspen Ct Noble, OK | 2.0 | 2.0 | 850 | $1,050 | $1.24 | 23d | 1 | 1.42mi |
| 1008 Aspen Ct Noble, OK | 2.0 | 2.0 | 880 | $1,050 | $1.19 | 12d | 1 | 1.43mi |
Listing history 13 events
-
2026-05-16status Pending
-
2026-05-12status Active
-
2026-05-07status Pending
-
2026-05-03$106,000 Active
-
2026-02-06historical
-
2025-12-05price $154,000
-
2025-09-11$150,000 Active
-
2018-09-05soldstatus $115,000
-
2007-06-21soldstatus $68,000 201-char remark
Show marketing remark (201 chars)
BUYERS TO VERIFY ALL INFORMATION! PROPERTY TO BE SOLD AS IS, ALL OFFERS MUST BE SUBMITTED WITH CREDIT APPROVAL AND/OR PROOF OF FUNDS LETTER AND EARNEST MONEY. COMMISSION COULD BE PAID ON NET TO SELLER.
-
2007-02-01$74,900 201-char remark
Show marketing remark (201 chars)
BUYERS TO VERIFY ALL INFORMATION! PROPERTY TO BE SOLD AS IS, ALL OFFERS MUST BE SUBMITTED WITH CREDIT APPROVAL AND/OR PROOF OF FUNDS LETTER AND EARNEST MONEY. COMMISSION COULD BE PAID ON NET TO SELLER.
-
2004-07-01soldstatus $79,900
-
2004-06-29soldstatus $80,000
-
2004-02-06$79,900
ⓘ Source: listings_history table (triggers on properties + properties_extension) + one-shot
backfill from property_details.listing_events for pre-trigger history.
Tax reassessment forecast OK · Resets to sale price
- Current annual tax
- $1,553 · $129/mo
- Projected year-2 tax
- $1,553 · $129/mo
- Expected delta
- $0/yr ($0/mo · 0.0%)
ⓘ Screening estimate from a state-policy table — verify with the county assessor before closing.
Climate risk First Street
- Flood 1/10 Low FEMA zone X (unshaded) · 0% chance over 30 yrs
- Wildfire 5/10 Major
- Heat 6/10 Major 7 d/yr ≥109°F today · 18 d/yr by 30 yrs out
- Wind 3/10 Moderate 5% chance of damaging wind over 30 yrs
- Air quality 2/10 Low 1 unhealthy d/yr today · 1 by 30 yrs out
Nearby sold comps map
Loading sold comps map…
Walkable amenities ~0.75 mi
Loading nearby amenities…
Taxation est. · year 1
- Rental income
- $16,644
- − Mortgage interest
- −$5,938
- − Property taxes
- −$1,553
- − Insurance
- −$530
- − Repairs & maintenance
- −$1,332
- − Management
- −$1,332
- − Depreciation
- −$3,084
- Taxable income
- $2,877
- Est. tax owed @ 24.0%
- −$690
- After-tax cash flow
- $3,705/yr
For passive investors: Depreciation is non-cash, so a rental often shows a tax loss while cash-flowing — sheltering income. Rental losses are passive: they offset passive income freely, and up to $25,000/yr can offset ordinary (W-2) income if you actively participate and your MAGI is under $100k (phasing out to $0 by $150k); unused losses carry forward. On sale, claimed depreciation is recaptured at up to 25%, and gains may owe capital-gains tax (a 1031 exchange can defer both). Figures are a year-1 estimate at your 24.0% rate — not tax advice; consult a CPA.
Schools (NCES district)
- District
- Noble
- NCES district ID
- 4021630
- Math proficiency
- 23% ▼ -8.00%
- Reading proficiency
- 25% ▼ -7.00%
- Median HH income
- $50,812
- Composite
- 21.31/100
- National rank
- #8384
- State rank
- #108 of 270 in OK
Livability — Noble
- Score
- 66/100
- State rank
- #107
- US rank
- #11489
Category grades
Schools grade is shown separately in the Schools card above.
Census & demographics
- Census place
- Noble, OK
- County
- Cleveland County · 239,547 people
- City population
- 12,258
- Metro
- Oklahoma City, OK
- Population (ZIP)
- 12,258
- Household income
- $73,821
- Rent vs Own
- Severe rent burden
- 301.0
Population outlook (Cleveland County) Hauer SSP2
- Today (2025)
- 323,621 people
- By 2030
- 349,070 · +7.9%
- By 2040
- 400,168 · +23.7%
- By 2050
- 454,101 · +40.3%
- By 2075
- 602,926 · +86.3%
- By 2100
- 734,485 · +127.0%
Race, ethnicity, and origin ACS 2023
- Neighborhood character
- Predominantly White (82%)
- Race & ethnicity
- White 82% Two or more races 8% Hispanic / Latino 5% Native American 5% Black 1%
- Hispanic origin (detail)
- Mexican 4% Puerto Rican 1%
- Common ancestry
- Slovak 3% Lithuanian 2% Italian 2%
- Foreign-born
- 1% · Canada
- Languages at home
- 98% English-only · Spanish 1%
Political lean MEDSL · Cleveland
- 2024 margin
- R (+14.9) · D 41.4% · R 56.4% · Other 2.2%
- 2008→2024 swing
- +9.1pp toward D · 2008: -24.0pp · 2024: -14.9pp
- All cycles
- 2024: R+14.9 2020: R+14.1 2016: R+21.7 2012: R+25.9 2008: R+24.0
Not yet ingested
- Civics
- —
Market trends
- HPI YoY
- ▼ -13.99%
- Current HPI
- 278.428
- Rent YoY
- —
- Metro
- Oklahoma City, OK
- State GDP YoY
- ▲ 1.55%
- F500 in state
- 6
Industry mix (Fortune 500 HQ in OK)
| Industry | F500 HQs | Revenue |
|---|---|---|
| Energy | 3 | $48B |
|
||
Price history
+32.7% since first listed13 events — show timeline
- 2026-05-16 Pending — MLSOK
- 2026-05-12 Relisted — MLSOK
- 2026-05-07 Pending — MLSOK
- 2026-05-03 Listed $106,000 MLSOK
- 2026-02-06 Listing Removed — MLSOK
- 2025-12-05 Price Changed $154,000 MLSOK
- 2025-09-11 Listed $150,000 MLSOK
- 2018-09-05 Sold (Public Records) $115,000 Public Records
- 2007-06-21 Sold (MLS) $68,000 MLSOK
- 2007-02-01 Listed $74,900 MLSOK
- 2004-07-01 Sold (MLS) $79,900 MLSOK
- 2004-06-29 Sold (Public Records) $80,000 Public Records
- 2004-02-06 Listed $79,900 MLSOK
Property tax history
+4.9%/yrLatest (2024): $1,553 · +1.8% YoY. Source: county tax records.
Cash-flow waterfall
monthlySold comps — $/sqft
last 12 mo · ≤1 miLoading sold comps…