None · Avra Valley, AZ
Flood risk 1/10 · Minimal
- FEMA flood zone
- X (unshaded)
- Chance of flooding over 30 yrs
- 0.0%
- Est. flood insurance / yr
- $507 – $1,088
Fire risk 5/10 · Moderate
- Est. fire insurance / yr
- $610 – $1,132
Heat risk 8/10 · Major
- Hot days now (above 110°F)
- 7 days/yr
- Hot days in 30 yrs
- 18 days/yr
Wind risk 1/10 · Minimal
- Chance of severe wind over 30 yrs
- —
Air-quality risk 1/10 · Minimal
- Unhealthy air days now
- 0 days/yr
- Unhealthy air days in 30 yrs
- 0 days/yr
Risk factors via First Street. Map © Google.
Why this score? — see what drove the D- grade
The composite is a weighted blend of 9 inputs, each scored 0–100. Each bar is that input's sub-score; the figure is the points it added to the 100-point composite (weight × sub-score).
- Cash flow +17.5/30.0
- DSCR +5.5/10.0
- 1% rule +3.4/10.0
- Rent growth +3.4/5.0
- Schools +3.1/10.0
- Livability +2.7/5.0
- Condition / age +2.5/5.0
- ARV discount +0.0/15.0
- Appreciation +0.0/10.0
$299,900
🖨 Deal sheet 📄 Offer letter ✓ Due diligence
Listing remarks MLS
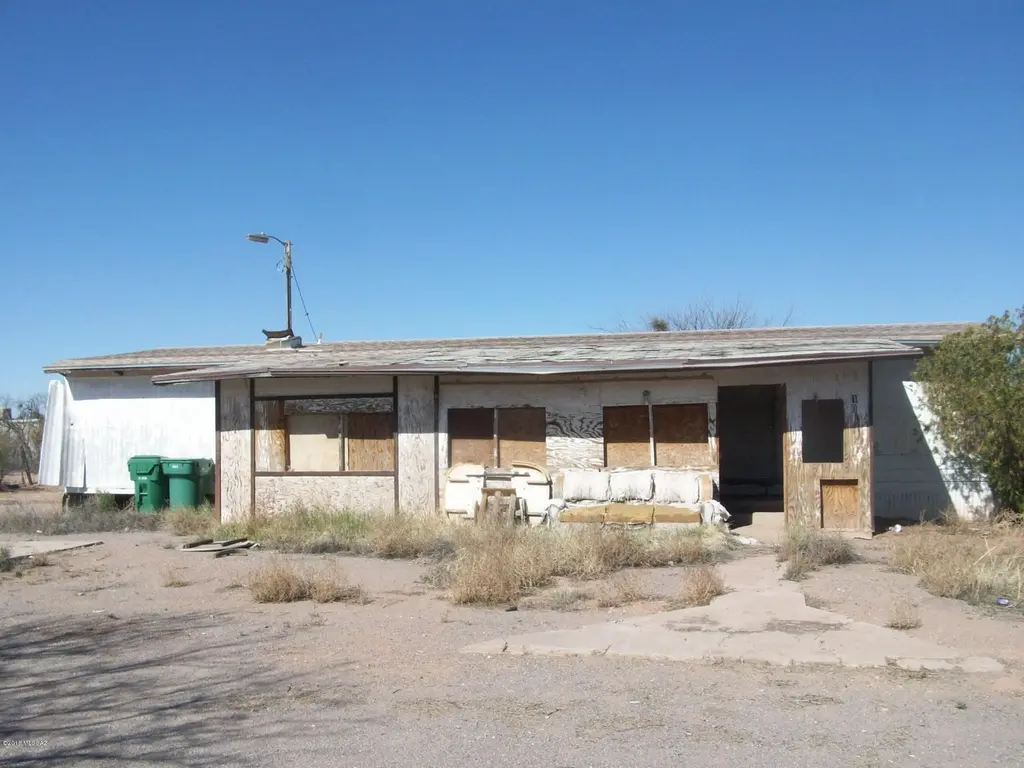
This is a 1977 Affixed Double wide mobile home - approx 1700 sq ft on 1.18 acre lot in Marana. Priced for quick sale.
Key facts
- Paved road
- Extended guest space
- Rental income
Tags
Property features AI
Finance
- Other: Property sits on a 51,226 sq. ft. lot; Zoned Pima County - SH; County-maintained road responsibility
- Financial info: Financial details not provided
- HOA & community: Community allows horses
Exterior
- Parking: 1 covered/carport space; Circular driveway; RV access/parking; Oversized parking
- Security: Security features not provided
- Utilities: Water from water company; Septic tank
- Home design: Manufactured home; Single-story; Fixer condition
- Construction: Frame construction; Shingle and metal roof
- Exterior features: Covered patio; Patio; Chain link fencing; Paved road access; East/West exposure; Horses allowed
Interior
- Kitchen: Exhaust fan; Dishwasher; Refrigerator; Lazy Susan; Prep sink; Electric oven; Microwave
- Bedrooms: Bedrooms information not provided
- Flooring: Ceramic tile
- Bathrooms: 4 full bathrooms
- Heating & cooling: Heat pump; Forced air heating; Central air conditioning
- Interior features: Kitchen island; Wet bar; Walk-in closets; Low-emissivity, ENERGY STAR-qualified, double pane insulated windows
- Laundry & utility: Laundry area in kitchen
Neighborhood map
What this means for you Summary
Snapshot
- This is a 5-bed/4.0-bath manufactured listed at $300k.
Deal economics
- At list price, monthly cash flow is $231 ($3k/yr) — positive.
- The deal already cash-flows at list — no discount required.
- To meet the 1% rule (rent ≥ 1% of price), the offer needs to be $252k (16.1% below list).
- Recommended offer: $252k (16.1% below list) — sets the bar for 1% rule.
- Cap rate 7.2% vs local median 5.9% in Avra Valley — meaningfully above typical; check what's discounted (condition, days-on-market, listing class) to confirm the premium yield is real.
Location & tenants
- Location reads 54/100 on livability (#275 in AZ) — a working-class tenant base; expect higher turnover. Strengths: cost of living A+, housing A+; Watch: schools F, crime D-, amenities F.
- Marana Unified District (4404) (suburban): math 31% / reading 37% proficiency, ranked #83 of 249 in AZ (top 33%) — families likely to look elsewhere, expect single-tenant / working-renter base with shorter leases.
- Market conditions: Rents rising (+3.4%/yr); 412 active listings in the ZIP; solid renter incomes; 5,268 units permitted in Pima County in 2024 (996 in 5+ unit buildings).
- This rent runs 35% of the median local income ($86k/yr) — at the standard rent-burdened threshold; future hikes will face affordability resistance.
Forward outlook
- Local home prices are declining (-3.0%/yr); year-one equity from $2k of loan paydown is wiped out by about $9k of value loss. Plan a longer hold.
- Pima County population projected at +8% by 2050 — modest demand growth; plan on rents tracking national, not racing it.
Negotiation context
- Only 5 days on market — expect competitive offers; lowballing is unlikely to land.
- 3 sale attempts since 8y ago with the ask held roughly flat each time — persistent listings suggest the price (not the market) is what's stuck; bring a comps-based counter.
- Current owner paid $18k; list at $300k implies a 1566% gain — meaningful room to come down on a strong offer.
Risks & watch-outs
- Climate carrying-cost: moderate wildfire risk; extreme-heat days projected 7→18/yr by 2055 (HVAC capex compounding) — expect insurance premiums to compound above CPI over the hold.
Questions for the listing agent
- Built in 1978 — when were the roof, HVAC, electrical panel, plumbing, and water heater last replaced?
- Is there a deadline driving the sale (1031 exchange, divorce, estate, relocation)? That informs how much negotiation room exists.
- Schools are F-rated, which usually means shorter tenancies and higher turnover. Who's the typical renter profile here, and what's been the actual vacancy rate?
- Crime grade is D in this area — have there been break-ins, vandalism, or insurance claims at this property in the last 3 years? What carrier currently insures it and at what premium?
- The area grade is low — what's the realistic commute time and amenity access for the typical tenant pool here? Any planned neighborhood developments (good or bad) we should know about?
- What's the average days-on-market for RENTAL listings here right now (not sales)? A rising rental-DOM trend means longer vacancies and softer asking-rent achievability than the comps imply.
- What's the recent tenant-quality profile in this submarket — average credit score on applications, eviction rate, late-payment / NSF rate, and stable-employment percentage? A property-management company in the area should have these aggregated.
- How much new for-sale + rental construction is in the pipeline within 1–3 miles? Heavy new supply typically softens prices + rents 12–24 months out; constrained supply supports both.
Investment metrics
- 1% rule
- 0.84% ✗
- Cap rate
- 7.22%
- Cash-on-cash
- 3.30%
- DSCR
- 1.15
- GRM
- 9.9
CMA / ARV
- ARV (median comp)
- $248,036
- List price
- $299,900
- Delta
- 29.01%
- Verdict
- OVERPRICED
- Comps
- 10 within 1.0 mi
Show comp detail 1 sale within ~0.75 mi
| Address | Dist | Beds/Ba | Sqft | Sold | Price | $/sf | Match |
|---|---|---|---|---|---|---|---|
| 16741 W Whitewing Way | 0.73mi | 4/2.0 (-1) | 1,624 (+13%) | 2mo | $123,000 | $76 | 30 |
Match score weights: distance 35% · size 25% · config 20% · recency 20%. Top-matched comps best support the ARV.
Projected returns pro-forma
-3.0% appreciation · 3.43% rent growth · sell at horizon
- IRR
- -10.8%
- Equity multiple
- 0.61×
- Total profit
- $-32,973
- Equity at exit
- $44,716
- IRR
- -1.0%
- Equity multiple
- 0.93×
- Total profit
- $-5,910
- Equity at exit
- $25,930
Cash invested: $83,972 (down + closing). Projections, not guarantees.
Landlord ↔ Tenant lean methodology
- Overall (STATE)
- 87 Strongly Landlord-Friendly
- State Arizona
- 87 Strongly Landlord-Friendly · R+3
- County
- — inherits STATE
- City
- — inherits STATE
ZIP-level market 85653
- Home prices YoY
- -21.8%
- Rents YoY
- 3.4%
- Active inventory
- 412
- Price-to-rent
- 9.9×
Monthly cashflow live
- Estimated rent
- $2,515 medium interval (Pro) →
- Mortgage (P&I)
- −$1,573
- Tax from tax record
- −$59 /mo · $708/yr
- Insurance
- −$125
- HOA
- −$0
- Vacancy / Maint / Mgmt
- −$528
- Net cashflow
- $231
Break-even live
UW: 25.0% down · 7.5% · 30yr · 1.5% tax · 5.0% vac · 8.0% maint · 8.0% mgmt
Financing live
Cash to close
- Down payment
- $74,975
- Closing costs
- $8,997
- Reserves months
- —
- Total cash needed
- —
Loan-product check · same deal, 3 products live
Conventional
25% down · 7.5% · 30yr
- Down + closing
- —
- Monthly P&I
- —
- Monthly cashflow
- —
- DSCR
- —
- Eligible?
- —
Personal DTI + credit; lowest rate.
DSCR
20% down · 8.5% · 30yr
- Down + closing
- —
- Monthly P&I
- —
- Monthly cashflow
- —
- DSCR
- —
- Eligible?
- —
No personal income docs; deal must DSCR.
Hard money
10% down · 12.0% · 12mo
- Down + closing
- —
- Monthly P&I
- —
- Monthly cashflow
- —
- DSCR
- —
- Eligible?
- —
Short-term bridge; refi at stabilization.
Listing history 10 events
-
2026-05-13historical
-
2026-03-29price $320,000
-
2026-03-29$299,900 Active
-
2018-05-04soldstatus $18,000 Closed 117-char remark
Show marketing remark (117 chars)
This is a 1977 Affixed Double wide mobile home - approx 1700 sq ft on 1.18 acre lot in Marana. Priced for quick sale.
-
2018-04-24status Pending 117-char remark
Show marketing remark (117 chars)
This is a 1977 Affixed Double wide mobile home - approx 1700 sq ft on 1.18 acre lot in Marana. Priced for quick sale.
-
2018-04-03$18,000 Active 117-char remark
Show marketing remark (117 chars)
This is a 1977 Affixed Double wide mobile home - approx 1700 sq ft on 1.18 acre lot in Marana. Priced for quick sale.
-
2002-08-15soldstatus $62,500
-
1989-12-01soldstatus $30,000
-
1985-03-01soldstatus $39,000
-
1979-06-01soldstatus $5,000
ⓘ Source: listings_history table (triggers on properties + properties_extension) + one-shot
backfill from property_details.listing_events for pre-trigger history.
Tax reassessment forecast AZ · Resets to sale price
- Current annual tax
- $708 · $59/mo
- Projected year-2 tax
- $1,979 · $165/mo
- Expected delta
- +$1,272/yr (+$106/mo · 179.8%)
ⓘ Screening estimate from a state-policy table — verify with the county assessor before closing.
Climate risk First Street
- Flood 1/10 Low FEMA zone X (unshaded) · 0% chance over 30 yrs
- Wildfire 5/10 Major
- Heat 8/10 Severe 7 d/yr ≥110°F today · 18 d/yr by 30 yrs out
- Wind 1/10 Low
- Air quality 1/10 Low 0 unhealthy d/yr today · 0 by 30 yrs out
Nearby sold comps map
Loading sold comps map…
Walkable amenities ~0.75 mi
Loading nearby amenities…
Taxation est. · year 1
- Rental income
- $30,186
- − Mortgage interest
- −$16,799
- − Property taxes
- −$708
- − Insurance
- −$1,500
- − Repairs & maintenance
- −$2,415
- − Management
- −$2,415
- − Depreciation
- −$8,724
- Taxable loss
- −$2,374
- Est. tax savings @ 24.0%
- +$570
- After-tax cash flow
- $3,337/yr
For passive investors: Depreciation is non-cash, so a rental often shows a tax loss while cash-flowing — sheltering income. Rental losses are passive: they offset passive income freely, and up to $25,000/yr can offset ordinary (W-2) income if you actively participate and your MAGI is under $100k (phasing out to $0 by $150k); unused losses carry forward. On sale, claimed depreciation is recaptured at up to 25%, and gains may owe capital-gains tax (a 1031 exchange can defer both). Figures are a year-1 estimate at your 24.0% rate — not tax advice; consult a CPA.
Schools (NCES district)
- District
- Marana Unified District (4404)
- NCES district ID
- 0404630
- Math proficiency
- 31% ▼ -11.00%
- Reading proficiency
- 37% ▼ -5.00%
- Median HH income
- $65,282
- Composite
- 30.96/100
- National rank
- #6103
- State rank
- #83 of 249 in AZ
Livability — Avra Valley
- Score
- 54/100
- State rank
- #275
- US rank
- #23869
Category grades
Schools grade is shown separately in the Schools card above.
Census & demographics
- Census place
- Avra Valley, AZ
- County
- Pima County · 1,012,107 people
- Metro
- Tucson, AZ
- Population (ZIP)
- 23,574
- Household income
- $86,154
- Rent vs Own
- Severe rent burden
- 181.0
Population outlook (Pima County) Hauer SSP2
- Today (2025)
- 1,066,056 people
- By 2030
- 1,086,684 · +1.9%
- By 2040
- 1,117,160 · +4.8%
- By 2050
- 1,149,778 · +7.9%
- By 2075
- 1,271,480 · +19.3%
- By 2100
- 1,321,160 · +23.9%
Race, ethnicity, and origin ACS 2023
- Neighborhood character
- Diverse neighborhood (Simpson 0.55)
- Race & ethnicity
- White 61% Hispanic / Latino 27% Two or more races 15% Black 3% Native American 2% Asian 1%
- Hispanic origin (detail)
- Mexican 22% Puerto Rican 2%
- Common ancestry
- Romanian 4% Lithuanian 2% Slovak 2%
- Foreign-born
- 6% · Canada
- Languages at home
- 88% English-only · Spanish 9% Other Asian/Pacific 1%
Political lean MEDSL · Pima
- 2024 margin
- D (+15.2) · D 57.0% · R 41.8% · Other 1.2%
- 2008→2024 swing
- +9.1pp toward D · 2008: 6.1pp · 2024: 15.2pp
- All cycles
- 2024: D+15.2 2020: D+18.7 2016: D+13.5 2012: D+5.8 2008: D+6.1
Not yet ingested
- Civics
- —
Market trends
- HPI YoY
- ▼ -69.29%
- Current HPI
- 249.3403
- Rent YoY
- ▲ 3.43%
- Metro
- Tucson, AZ
- State GDP YoY
- ▲ 4.54%
- F500 in state
- 20
Industry mix (Fortune 500 HQ in AZ)
| Industry | F500 HQs | Revenue |
|---|---|---|
| Technology | 2 | $13B |
|
||
| Mining / Metals | 1 | $23B |
|
||
| Environmental Services | 1 | $16B |
|
||
| Metals / Steel | 1 | $14B |
|
||
| Technology Distribution | 1 | $9B |
|
||
| Homebuilding | 1 | $8B |
|
||
Price history
+5898.0% since first listed12 events — show timeline
- 2026-05-30 Listing Removed — MLSSAZ
- 2026-05-24 Listed $299,900 MLSSAZ
- 2026-05-13 Listing Removed — MLSSAZ
- 2026-03-29 Price Changed $320,000 MLSSAZ
- 2026-03-29 Listed $299,900 MLSSAZ
- 2018-05-04 Sold (MLS) $18,000 MLSSAZ
- 2018-04-24 Pending — MLSSAZ
- 2018-04-03 Listed $18,000 MLSSAZ
- 2002-08-15 Sold (Public Records) $62,500 Public Records
- 1989-12-01 Sold (Public Records) $30,000 Public Records
- 1985-03-01 Sold (Public Records) $39,000 Public Records
- 1979-06-01 Sold (Public Records) $5,000 Public Records
Property tax history
+1.3%/yrLatest (2025): $708 · +4.8% YoY. Source: county tax records.
Cash-flow waterfall
monthlySold comps — $/sqft
last 12 mo · ≤1 miLoading sold comps…