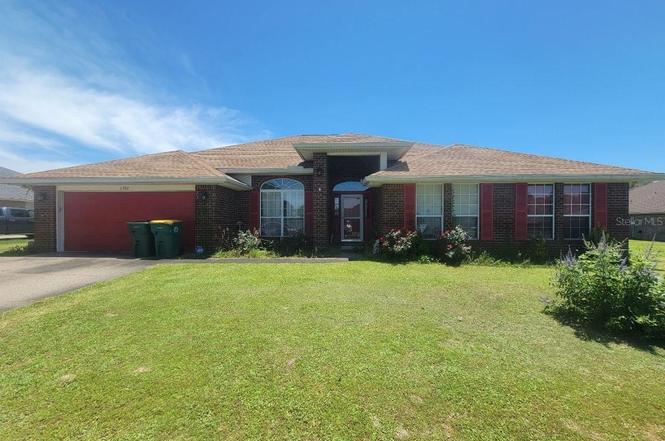
2382 Barberee Dr · Crestview, FL
Flood risk 1/10 · Minimal
- FEMA flood zone
- X (unshaded)
- Chance of flooding over 30 yrs
- 0.0%
- Est. flood insurance / yr
- $507 – $1,088
Fire risk 5/10 · Moderate
- Est. fire insurance / yr
- $947 – $1,759
Heat risk 9/10 · Severe
- Hot days now (above 107°F)
- 7 days/yr
- Hot days in 30 yrs
- 20 days/yr
Wind risk 9/10 · Severe
- Chance of severe wind over 30 yrs
- 99.0%
Air-quality risk 2/10 · Minimal
- Unhealthy air days now
- 1 days/yr
- Unhealthy air days in 30 yrs
- 1 days/yr
Risk factors via First Street. Map © Google.
Why this score? — see what drove the C- grade
The composite is a weighted blend of 9 inputs, each scored 0–100. Each bar is that input's sub-score; the figure is the points it added to the 100-point composite (weight × sub-score).
- Cash flow +21.0/30.0
- ARV discount +7.5/15.0
- DSCR +6.7/10.0
- Schools +5.2/10.0
- 1% rule +4.9/10.0
- Livability +3.8/5.0
- Rent growth +2.8/5.0
- Condition / age +2.5/5.0
- Appreciation +0.0/10.0
$230,000
🖨 Deal sheet 📄 Offer letter ✓ Due diligence
Listing remarks MLS
BRICK MAILBOX, DIMENSIONAL SHINGLES,
Key facts
- 0.52 acre lot
- Garage
- Built 2007
Property features AI
Finance
- Other: Homestead exempt; Zoning: RR; Living area reported as 2,944 (appraiser source); Building area reported as 4,336 (appraiser source)
- Financial info: No lease restrictions indicated
- HOA & community: Part of Silver Creek Estates Homeowners Association; HOA approval required; HOA dues $125 annually (about $10.42/month); Pets allowed
Exterior
- Parking: Attached garage with 1 garage space
- Utilities: Public water; Other sewer; Electricity available; Water available
- Home design: Single Family Residence; One story; Faces southwest
- Construction: Concrete construction; Shingle roof; Other foundation details; Built on a 0.52-acre lot
- Exterior features: Other exterior features; Asphalt road access
Interior
- Kitchen: Range; Refrigerator
- Bedrooms: 4 bedrooms
- Flooring: Tile
- Bathrooms: 3 full bathrooms
- Heating & cooling: Central heating; Other cooling
- Interior features: Other interior features
- Laundry & utility: Other laundry features
Neighborhood map
What this means for you Summary
Snapshot
- This is a 4-bed/3.0-bath single-family listed at $230k.
Deal economics
- At list price, monthly cash flow is $326 ($4k/yr) — positive.
- The deal already cash-flows at list — no discount required.
- To meet the 1% rule (rent ≥ 1% of price), the offer needs to be $228k (0.7% below list).
- Recommended offer: $228k (0.7% below list) — sets the bar for 1% rule.
- Cap rate 8.0% vs local median 4.4% in Crestview — top-decile yield for the area; either an underpriced asset or a hidden risk that comps aren't pricing in. Stress-test before assuming the spread holds.
Location & tenants
- Location reads 75/100 on livability (#252 in FL, #3,858 nationally) — a middle-class / working-renter tenant base. Strengths: cost of living A+, housing A+, health & safety A+; Watch: employment D, amenities F, commute F.
- Okaloosa (other): math 60% / reading 60% proficiency, ranked #12 of 73 in FL (top 16%) — acceptable for families but not a draw, mixed tenant base, ~2y average lease.
- Market conditions: Rents rising (+1.2%/yr); 349 active listings in the ZIP; 1 comparable units currently listed for rent nearby; solid renter incomes; 1,268 units permitted in Okaloosa County in 2024 (175 in 5+ unit buildings).
- This rent runs 35% of the median local income ($78k/yr) — at the standard rent-burdened threshold; future hikes will face affordability resistance.
Forward outlook
- Local home prices are declining (-3.0%/yr); year-one equity from $2k of loan paydown is wiped out by about $7k of value loss. Plan a longer hold.
- Okaloosa County population projected at +37% by 2050 — long-run rental-demand tailwind backs the buy-and-hold thesis.
Negotiation context
- Only 2 days on market — expect competitive offers; lowballing is unlikely to land.
- 3 sale attempts since 19y ago with the ask held roughly flat each time — persistent listings suggest the price (not the market) is what's stuck; bring a comps-based counter.
Risks & watch-outs
- Climate carrying-cost: severe wind risk, 99% chance of damaging wind over 30y; moderate wildfire risk; extreme-heat days projected 7→20/yr by 2055 (HVAC capex compounding) — expect insurance premiums to compound above CPI over the hold.
Questions for the listing agent
- What does the HOA fee cover, when was the last increase, and are there any pending special assessments or reserve-fund shortfalls?
- Is there a deadline driving the sale (1031 exchange, divorce, estate, relocation)? That informs how much negotiation room exists.
- Schools are B-rated — typically a magnet for longer-tenancy family renters. What's the average tenant stay here, and is there a school-zone premium baked into asking?
- What's the average days-on-market for RENTAL listings here right now (not sales)? A rising rental-DOM trend means longer vacancies and softer asking-rent achievability than the comps imply.
- What's the recent tenant-quality profile in this submarket — average credit score on applications, eviction rate, late-payment / NSF rate, and stable-employment percentage? A property-management company in the area should have these aggregated.
- How much new for-sale + rental construction is in the pipeline within 1–3 miles? Heavy new supply typically softens prices + rents 12–24 months out; constrained supply supports both.
Investment metrics
- 1% rule
- 0.99% ✗
- Cap rate
- 7.99%
- Cash-on-cash
- 6.07%
- DSCR
- 1.27
- GRM
- 8.4
CMA / ARV
- ARV (on-the-fly)
- $468,096
- Comps found
- 12
Show comp detail 12 sales within ~0.75 mi
| Address | Dist | Beds/Ba | Sqft | Sold | Price | $/sf | Match |
|---|---|---|---|---|---|---|---|
| 2378 Barberee Dr | 0.04mi | 4/2.5 | 2,826 (-4%) | 16mo | $465,000 | $165 | 76 |
| 2508 Rutgers Rd | 0.29mi | 5/3.5 (+1) | 2,995 (+2%) | 3mo | $399,900 | $134 | 74 |
| 2504 Rutgers Rd | 0.28mi | 5/3.5 (+1) | 2,995 (+2%) | 4mo | $399,900 | $134 | 74 |
| 6202 Nanterre Cv | 0.29mi | 4/2.0 | 2,767 (-6%) | 1mo | $480,000 | $173 | 72 |
| 2345 Genevieve Way | 0.21mi | 4/3.0 | 2,522 (-14%) | 2mo | $407,000 | $161 | 64 |
| 2384 Barberee Dr | 0.02mi | 4/2.0 | 2,583 (-12%) | 15mo | $409,850 | $159 | 62 |
| 2502 Rutgers Rd | 0.28mi | 5/3.0 (+1) | 2,595 (-12%) | 2mo | $360,000 | $139 | 60 |
| 2428 Genevieve Way | 0.33mi | 5/3.0 (+1) | 2,585 (-12%) | 1mo | $386,600 | $150 | 58 |
| 2512 Rutgers Rd | 0.32mi | 5/3.0 (+1) | 2,595 (-12%) | 3mo | $379,900 | $146 | 58 |
| 2405 Dakota Way | 0.47mi | 5/3.0 (+1) | 3,113 (+6%) | 6mo | $548,000 | $176 | 58 |
| 2415 Dakota Way | 0.55mi | 5/3.0 (+1) | 2,971 (+1%) | 13mo | $550,000 | $185 | 57 |
| 6256 Evan Cir | 0.32mi | 4/3.0 | 2,604 (-12%) | 14mo | $415,000 | $159 | 54 |
Match score weights: distance 35% · size 25% · config 20% · recency 20%. Top-matched comps best support the ARV.
Projected returns pro-forma
-3.0% appreciation · 1.17% rent growth · sell at horizon
- IRR
- -8.9%
- Equity multiple
- 0.68×
- Total profit
- $-20,692
- Equity at exit
- $34,294
- IRR
- -1.9%
- Equity multiple
- 0.88×
- Total profit
- $-7,782
- Equity at exit
- $19,886
Cash invested: $64,400 (down + closing). Projections, not guarantees.
Landlord ↔ Tenant lean methodology
- Overall (STATE)
- 87 Strongly Landlord-Friendly
- State Florida
- 87 Strongly Landlord-Friendly · R+3
- County
- — inherits STATE
- City
- — inherits STATE
ZIP-level market 32536
- Home prices YoY
- -16.2%
- Rents YoY
- 1.2%
- Active inventory
- 349
- Price-to-rent
- 8.4×
Monthly cashflow live
- Estimated rent
- $2,284 medium interval (Pro) →
- Mortgage (P&I)
- −$1,206
- Tax from tax record
- −$166 /mo · $1,997/yr
- Insurance
- −$96
- HOA
- −$10
- Vacancy / Maint / Mgmt
- −$480
- Net cashflow
- $326
Break-even live
UW: 25.0% down · 7.5% · 30yr · 1.5% tax · 5.0% vac · 8.0% maint · 8.0% mgmt
Financing live
Cash to close
- Down payment
- $57,500
- Closing costs
- $6,900
- Reserves months
- —
- Total cash needed
- —
Loan-product check · same deal, 3 products live
Conventional
25% down · 7.5% · 30yr
- Down + closing
- —
- Monthly P&I
- —
- Monthly cashflow
- —
- DSCR
- —
- Eligible?
- —
Personal DTI + credit; lowest rate.
DSCR
20% down · 8.5% · 30yr
- Down + closing
- —
- Monthly P&I
- —
- Monthly cashflow
- —
- DSCR
- —
- Eligible?
- —
No personal income docs; deal must DSCR.
Hard money
10% down · 12.0% · 12mo
- Down + closing
- —
- Monthly P&I
- —
- Monthly cashflow
- —
- DSCR
- —
- Eligible?
- —
Short-term bridge; refi at stabilization.
Rent comps 1 comps
| Address | Beds | Baths | Sqft | Rent | $/sqft | DOM | Units | Dist |
|---|---|---|---|---|---|---|---|---|
| 2609 Corner Creek Rd Crestview, FL | 4.0 | 2.0 | 2098 | $2,100 | $1.00 | 43d | 1 | 1.30mi |
HOA detail
- Monthly dues
- $10 · $120/yr
Listing history 3 events
-
2026-06-18days on market $230,000 Active 2 DOM
-
2026-06-16remarks 71-char remark
-
2026-06-16$230,000 Active 1 DOM
ⓘ Source: listings_history table (triggers on properties + properties_extension) + one-shot
backfill from property_details.listing_events for pre-trigger history.
Tax reassessment forecast FL · Resets to sale price
- Current annual tax
- $1,997 · $166/mo
- Projected year-2 tax
- $1,997 · $166/mo
- Expected delta
- $0/yr ($0/mo · -0.0%)
ⓘ Screening estimate from a state-policy table — verify with the county assessor before closing.
Climate risk First Street
- Flood 1/10 Low FEMA zone X (unshaded) · 0% chance over 30 yrs
- Wildfire 5/10 Major
- Heat 9/10 Extreme 7 d/yr ≥107°F today · 20 d/yr by 30 yrs out
- Wind 9/10 Extreme 99% chance of damaging wind over 30 yrs
- Air quality 2/10 Low 1 unhealthy d/yr today · 1 by 30 yrs out
Nearby sold comps map
Loading sold comps map…
Walkable amenities ~0.75 mi
Loading nearby amenities…
Taxation est. · year 1
- Rental income
- $27,404
- − Mortgage interest
- −$12,884
- − Property taxes
- −$1,997
- − Insurance
- −$1,150
- − Repairs & maintenance
- −$2,192
- − Management
- −$2,192
- − HOA
- −$120
- − Depreciation
- −$6,691
- Taxable income
- $177
- Est. tax owed @ 24.0%
- −$43
- After-tax cash flow
- $3,865/yr
For passive investors: Depreciation is non-cash, so a rental often shows a tax loss while cash-flowing — sheltering income. Rental losses are passive: they offset passive income freely, and up to $25,000/yr can offset ordinary (W-2) income if you actively participate and your MAGI is under $100k (phasing out to $0 by $150k); unused losses carry forward. On sale, claimed depreciation is recaptured at up to 25%, and gains may owe capital-gains tax (a 1031 exchange can defer both). Figures are a year-1 estimate at your 24.0% rate — not tax advice; consult a CPA.
Schools (NCES district)
- District
- Okaloosa
- NCES district ID
- 1201380
- Math proficiency
- 60% ▼ -12.00%
- Reading proficiency
- 60% ▼ -4.00%
- Median HH income
- $55,601
- Composite
- 51.62/100
- National rank
- #1705
- State rank
- #12 of 73 in FL
Livability — Crestview
- Score
- 75/100
- State rank
- #252
- US rank
- #3858
Category grades
Schools grade is shown separately in the Schools card above.
Census & demographics
- County
- Okaloosa County · 194,352 people
- City population
- 58,889
- Metro
- Crestview-Fort Walton Beach-Destin, FL
- Population (ZIP)
- 25,599
- Household income
- $78,119
- Rent vs Own
- Severe rent burden
- 634.0
Population outlook (Okaloosa County) Hauer SSP2
- Today (2025)
- 235,133 people
- By 2030
- 253,483 · +7.8%
- By 2040
- 289,537 · +23.1%
- By 2050
- 322,954 · +37.3%
- By 2075
- 399,624 · +70.0%
- By 2100
- 425,311 · +80.9%
Race, ethnicity, and origin ACS 2023
- Neighborhood character
- Diverse neighborhood (Simpson 0.56)
- Race & ethnicity
- White 64% Black 16% Hispanic / Latino 12% Two or more races 9% Asian 3%
- Hispanic origin (detail)
- Mexican 4% Puerto Rican 2% Dominican 1%
- Common ancestry
- Lithuanian 2% Slovak 2% Italian 2%
- Foreign-born
- 6% · Canada, South Korea
- Languages at home
- 91% English-only · Spanish 7% Tagalog/Filipino 1%
Political lean MEDSL · Okaloosa
- 2024 margin
- Solid R (+42.4) · D 28.2% · R 70.7% · Other 1.1%
- 2008→2024 swing
- +2.5pp toward D · 2008: -44.9pp · 2024: -42.4pp
- All cycles
- 2024: R+42.4 2020: R+39.1 2016: R+47.8 2012: R+49.4 2008: R+44.9
Not yet ingested
- Civics
- —
Market trends
- HPI YoY
- ▼ -51.48%
- Current HPI
- 265.9926
- Rent YoY
- ▲ 1.17%
- Metro
- Crestview-Fort Walton Beach-Destin, FL
- State GDP YoY
- ▲ 3.28%
- F500 in state
- 36
Industry mix (Fortune 500 HQ in FL)
| Industry | F500 HQs | Revenue |
|---|---|---|
| Industrial Technology | 2 | $29B |
|
||
| Insurance | 2 | $17B |
|
||
| Retail | 1 | $60B |
|
||
| Technology Distribution | 1 | $58B |
|
||
| Homebuilding | 1 | $35B |
|
||
| Technology Manufacturing | 1 | $35B |
|
||
Price history
-4.7% since first listed5 events — show timeline
- 2026-06-16 Listed $230,000 Stellar MLS as Distributed by MLS Grid
- 2007-07-20 Sold (MLS) $241,300 ECAR
- 2007-07-20 Sold (MLS) $241,300 NAMLS
- 2007-02-21 Listed $241,300 ECAR
- 2007-02-21 Listed $241,300 NAMLS
Property tax history
+1.2%/yrLatest (2025): $1,997 · +3.3% YoY. Source: county tax records.
Cash-flow waterfall
monthlySold comps — $/sqft
last 12 mo · ≤1 miLoading sold comps…