 8-Plex
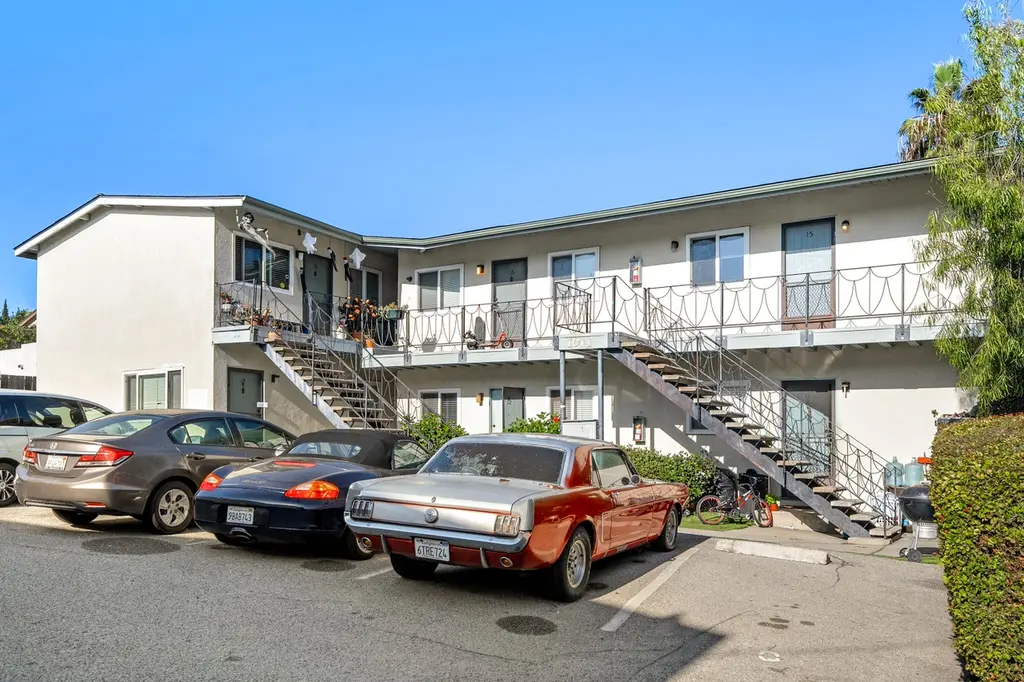
1011 Laguna St · Santa Barbara, CA
Flood risk 4/10 · Minor
- FEMA flood zone
- X (unshaded)
- Chance of flooding over 30 yrs
- 0.22%
- Est. flood insurance / yr
- $507 – $1,088
Fire risk 2/10 · Minimal
- Est. fire insurance / yr
- $659 – $1,223
Heat risk 6/10 · Moderate
- Hot days now (above 84°F)
- 7 days/yr
- Hot days in 30 yrs
- 20 days/yr
Wind risk 1/10 · Minimal
- Chance of severe wind over 30 yrs
- —
Air-quality risk 8/10 · Major
- Unhealthy air days now
- 13 days/yr
- Unhealthy air days in 30 yrs
- 13 days/yr
Risk factors via First Street. Map © Google.
Why this score? — see what drove the C- grade
The composite is a weighted blend of 9 inputs, each scored 0–100. Each bar is that input's sub-score; the figure is the points it added to the 100-point composite (weight × sub-score).
- Cash flow +15.5/30.0
- ARV discount +15.0/15.0
- DSCR +4.8/10.0
- Schools +4.6/10.0
- Livability +3.6/5.0
- Rent growth +3.5/5.0
- 1% rule +3.1/10.0
- Condition / age +2.5/5.0
- Appreciation +0.0/10.0
$2,500,000
🖨 Deal sheet 📄 Offer letter ✓ Due diligence
Multi-family units
County records classify this as Multi-Family (5+ Unit). Listing-text estimate: 8 units. confirmed
5+ unit building — per-unit beds/baths from public records are typically unavailable; the breakdown below (if shown) is an estimate from the listing text.
Listing remarks MLS
Neighboring Property Available - 333 E Carrillo! Exceptional opportunity to acquire a well-maintained 8-unit multifamily property located in the heart of Downtown Santa Barbara. The property features an attractive unit mix of (8) 1 BD/1BA units, several of which have been recently updated to enhance livability and appeal. One unit will be delivered vacant at COE. Upstairs units feature vaulted ceilings that create a bright, spacious atmosphere, contributing to the property's overall charm and character. Tenants benefit from off-street parking—a rare convenience in this central location—along with close proximity to Santa Barbara's vibrant State Street corridor, parks, beaches, and major employers. New Roof (2023) ∙ Updated Plumbing ∙ All Windows Replaced ∙ On-site L
Key facts
- Off-street parking
- New roof
- All windows replaced
Tags
Neighborhood map
What this means for you Summary
Snapshot
- This is a 8 × 1-bed/1.0-bath units multifamily listed at $2.50M.
Deal economics
- At list price, monthly cash flow is $1k ($12k/yr) — positive. Per door: $128/mo.
- The deal already cash-flows at list — no discount required.
- To meet the 1% rule (rent ≥ 1% of price), the offer needs to be $2.03M (18.9% below list).
- Recommended offer: $2.03M (18.9% below list) — sets the bar for 1% rule.
- Cap rate 6.8% vs local median 1.8% in Santa Barbara — top-decile yield for the area; either an underpriced asset or a hidden risk that comps aren't pricing in. Stress-test before assuming the spread holds.
Location & tenants
- Location reads 71/100 on livability (#219 in CA) — a middle-class / working-renter tenant base. Strengths: commute A+, employment A+, health & safety A+; Watch: schools C-, crime F, cost of living F.
- Santa Barbara Unified (urban): math 45% / reading 54% proficiency, ranked #409 of 1,400 in CA (top 29%) — families likely to look elsewhere, expect single-tenant / working-renter base with shorter leases.
- Market conditions: Rents rising (+4.0%/yr); 52 active listings in the ZIP; solid renter incomes; 719 units permitted in Santa Barbara County in 2024 (217 in 5+ unit buildings).
- At $20,277/mo this rent would consume 270% of the median local household income ($90k/yr) (locally 3070% of renters already pay >50% of income on rent) — very limited rent-growth headroom before tenants either downsize or default.
Forward outlook
- Local home prices are declining (-3.0%/yr); year-one equity from $17k of loan paydown is wiped out by about $75k of value loss. Plan a longer hold.
- Santa Barbara County population projected at +20% by 2050 — long-run rental-demand tailwind backs the buy-and-hold thesis.
Negotiation context
- It's been on market 191 days — a 12% lower offer ($2.20M) is reasonable based on typical stale-listing flexibility.
Risks & watch-outs
- Watch-outs: built in 1957 — expect roof / HVAC / electrical / plumbing capex.
- Climate carrying-cost: extreme-heat days projected 7→20/yr by 2055 (HVAC capex compounding) — expect insurance premiums to compound above CPI over the hold.
Questions for the listing agent
- It's been on market 191 days. Have you received any prior offers? Is the seller open to a 19% concession, seller financing, or rate buy-down credit?
- Can we see the unit-by-unit rent roll, current vacancy, and any below-market leases? What's the average tenancy length?
- What capital expenditures (roof, boiler, parking lot, exteriors) have been made in the last 5 years, and what's planned in the next 2?
- Built in 1957 — when were the roof, HVAC, electrical panel, plumbing, and water heater last replaced?
- Why hasn't it sold? Are there any deal-killer items the seller is aware of (foundation, flood, title, zoning, code violations)?
- Is there a deadline driving the sale (1031 exchange, divorce, estate, relocation)? That informs how much negotiation room exists.
- Crime grade is F in this area — have there been break-ins, vandalism, or insurance claims at this property in the last 3 years? What carrier currently insures it and at what premium?
- What's the average days-on-market for RENTAL listings here right now (not sales)? A rising rental-DOM trend means longer vacancies and softer asking-rent achievability than the comps imply.
- What's the recent tenant-quality profile in this submarket — average credit score on applications, eviction rate, late-payment / NSF rate, and stable-employment percentage? A property-management company in the area should have these aggregated.
- How much new apartment / multifamily construction is in the pipeline within 1–3 miles? Heavy new supply (>2% of stock underway) typically softens rents 12–24 months out; light construction supports rent growth.
Investment metrics
- 1% rule
- 0.81% ✗
- Cap rate
- 6.78%
- Cash-on-cash
- 1.75%
- DSCR
- 1.08
- GRM
- 10.3
CMA / ARV
- ARV (median comp)
- $3,247,802
- List price
- $2,500,000
- Delta
- -23.02%
- Verdict
- UNDERPRICED
- Comps
- 9 within 1.0 mi
Show comp detail 1 sale within ~0.75 mi
| Address | Dist | Beds/Ba | Sqft | Sold | Price | $/sf | Match |
|---|---|---|---|---|---|---|---|
| 1418 Alta Vista Rd | 0.51mi | 7/5.0 (-1) | 3,816 (+2%) | 6mo | $3,300,000 | $865 | 50 |
Match score weights: distance 35% · size 25% · config 20% · recency 20%. Top-matched comps best support the ARV.
Projected returns pro-forma
-3.0% appreciation · 3.95% rent growth · sell at horizon
- IRR
- -12.6%
- Equity multiple
- 0.54×
- Total profit
- $-321,550
- Equity at exit
- $372,758
- IRR
- -2.4%
- Equity multiple
- 0.83×
- Total profit
- $-118,787
- Equity at exit
- $216,154
Cash invested: $700,000 (down + closing). Projections, not guarantees.
Landlord ↔ Tenant lean methodology
- Overall (STATE)
- 18 Strongly Tenant-Friendly
- State California
- 18 Strongly Tenant-Friendly · D+13
- County
- — inherits STATE
- City
- — inherits STATE
ZIP-level market 93101
- Rents YoY
- 4.0%
- Active inventory
- 52
- Price-to-rent
- 82.2×
Monthly cashflow live
- Estimated rent
- $20,277 medium interval (Pro) →
- Mortgage (P&I)
- −$13,110
- Tax from tax record
- −$845 /mo · $10,139/yr
- Insurance
- −$1,042
- HOA
- −$0
- Vacancy / Maint / Mgmt
- −$4,258
- Net cashflow
- $1,022
Break-even live
8-unit breakdown (identical units grouped — click to expand)
| Units | Beds | Baths | Est. rent |
|---|---|---|---|
| 8× units | 1 | 1 | $20,280 |
| #1 | 1 | 1 | $2,535 |
| #2 | 1 | 1 | $2,535 |
| #3 | 1 | 1 | $2,535 |
| #4 | 1 | 1 | $2,535 |
| #5 | 1 | 1 | $2,535 |
| #6 | 1 | 1 | $2,535 |
| #7 | 1 | 1 | $2,535 |
| #8 | 1 | 1 | $2,535 |
| Total (8 units) | $20,277 | ||
UW: 25.0% down · 7.5% · 30yr · 1.5% tax · 5.0% vac · 8.0% maint · 8.0% mgmt
Financing live
Cash to close
- Down payment
- $625,000
- Closing costs
- $75,000
- Reserves months
- —
- Total cash needed
- —
Loan-product check · same deal, 3 products live
Conventional
25% down · 7.5% · 30yr
- Down + closing
- —
- Monthly P&I
- —
- Monthly cashflow
- —
- DSCR
- —
- Eligible?
- —
Personal DTI + credit; lowest rate.
DSCR
20% down · 8.5% · 30yr
- Down + closing
- —
- Monthly P&I
- —
- Monthly cashflow
- —
- DSCR
- —
- Eligible?
- —
No personal income docs; deal must DSCR.
Hard money
10% down · 12.0% · 12mo
- Down + closing
- —
- Monthly P&I
- —
- Monthly cashflow
- —
- DSCR
- —
- Eligible?
- —
Short-term bridge; refi at stabilization.
Listing history 4 events
-
2026-05-20status Pending 794-char remark
Show marketing remark (794 chars)
Neighboring Property Available - 333 E Carrillo! Exceptional opportunity to acquire a well-maintained 8-unit multifamily property located in the heart of Downtown Santa Barbara. The property features an attractive unit mix of (8) 1 BD/1BA units, several of which have been recently updated to enhance livability and appeal. One unit will be delivered vacant at COE. Upstairs units feature vaulted ceilings that create a bright, spacious atmosphere, contributing to the property's overall charm and character. Tenants benefit from off-street parking—a rare convenience in this central location—along with close proximity to Santa Barbara's vibrant State Street corridor, parks, beaches, and major employers. New Roof (2023) ∙ Updated Plumbing ∙ All Windows Replaced ∙ On-site L
-
2026-05-20price $2,500,000 794-char remark
Show marketing remark (794 chars)
Neighboring Property Available - 333 E Carrillo! Exceptional opportunity to acquire a well-maintained 8-unit multifamily property located in the heart of Downtown Santa Barbara. The property features an attractive unit mix of (8) 1 BD/1BA units, several of which have been recently updated to enhance livability and appeal. One unit will be delivered vacant at COE. Upstairs units feature vaulted ceilings that create a bright, spacious atmosphere, contributing to the property's overall charm and character. Tenants benefit from off-street parking—a rare convenience in this central location—along with close proximity to Santa Barbara's vibrant State Street corridor, parks, beaches, and major employers. New Roof (2023) ∙ Updated Plumbing ∙ All Windows Replaced ∙ On-site L
-
2026-02-23price $2,825,000 794-char remark
Show marketing remark (794 chars)
Neighboring Property Available - 333 E Carrillo! Exceptional opportunity to acquire a well-maintained 8-unit multifamily property located in the heart of Downtown Santa Barbara. The property features an attractive unit mix of (8) 1 BD/1BA units, several of which have been recently updated to enhance livability and appeal. One unit will be delivered vacant at COE. Upstairs units feature vaulted ceilings that create a bright, spacious atmosphere, contributing to the property's overall charm and character. Tenants benefit from off-street parking—a rare convenience in this central location—along with close proximity to Santa Barbara's vibrant State Street corridor, parks, beaches, and major employers. New Roof (2023) ∙ Updated Plumbing ∙ All Windows Replaced ∙ On-site L
-
2025-11-10$2,950,000 Active 794-char remark
Show marketing remark (794 chars)
Neighboring Property Available - 333 E Carrillo! Exceptional opportunity to acquire a well-maintained 8-unit multifamily property located in the heart of Downtown Santa Barbara. The property features an attractive unit mix of (8) 1 BD/1BA units, several of which have been recently updated to enhance livability and appeal. One unit will be delivered vacant at COE. Upstairs units feature vaulted ceilings that create a bright, spacious atmosphere, contributing to the property's overall charm and character. Tenants benefit from off-street parking—a rare convenience in this central location—along with close proximity to Santa Barbara's vibrant State Street corridor, parks, beaches, and major employers. New Roof (2023) ∙ Updated Plumbing ∙ All Windows Replaced ∙ On-site L
ⓘ Source: listings_history table (triggers on properties + properties_extension) + one-shot
backfill from property_details.listing_events for pre-trigger history.
Tax reassessment forecast CA · Resets to sale price
- Current annual tax
- $10,139 · $845/mo
- Projected year-2 tax
- $19,000 · $1,583/mo
- Expected delta
- +$8,861/yr (+$738/mo · 87.4%)
ⓘ Screening estimate from a state-policy table — verify with the county assessor before closing.
Climate risk First Street
- Flood 4/10 Moderate FEMA zone X (unshaded) · 22% chance over 30 yrs
- Wildfire 2/10 Low
- Heat 6/10 Major 7 d/yr ≥84°F today · 20 d/yr by 30 yrs out
- Wind 1/10 Low
- Air quality 8/10 Severe 13 unhealthy d/yr today · 13 by 30 yrs out
Nearby sold comps map
Loading sold comps map…
Walkable amenities ~0.75 mi
Loading nearby amenities…
Taxation est. · year 1
- Rental income
- $243,324
- − Mortgage interest
- −$140,039
- − Property taxes
- −$10,139
- − Insurance
- −$12,500
- − Repairs & maintenance
- −$19,466
- − Management
- −$19,466
- − Depreciation
- −$72,727
- Taxable loss
- −$31,013
- Est. tax savings @ 24.0%
- +$7,443
- After-tax cash flow
- $19,707/yr
For passive investors: Depreciation is non-cash, so a rental often shows a tax loss while cash-flowing — sheltering income. Rental losses are passive: they offset passive income freely, and up to $25,000/yr can offset ordinary (W-2) income if you actively participate and your MAGI is under $100k (phasing out to $0 by $150k); unused losses carry forward. On sale, claimed depreciation is recaptured at up to 25%, and gains may owe capital-gains tax (a 1031 exchange can defer both). Figures are a year-1 estimate at your 24.0% rate — not tax advice; consult a CPA.
Schools (NCES district)
- District
- Santa Barbara Unified
- NCES district ID
- 0601414
- Math proficiency
- 45% ▲ 2.00%
- Reading proficiency
- 54% ▬ 0.00%
- Median HH income
- $67,369
- Composite
- 46.05/100
- National rank
- #5495
- State rank
- #409 of 1400 in CA
Livability — Santa Barbara
- Score
- 71/100
- State rank
- #219
- US rank
- #6964
Category grades
Schools grade is shown separately in the Schools card above.
Census & demographics
- Census place
- Santa Barbara, CA
- County
- Santa Barbara County · 410,380 people
- City population
- 119,998
- Metro
- Santa Maria-Santa Barbara, CA
- Population (ZIP)
- 31,554
- Household income
- $90,148
- Rent vs Own
- Severe rent burden
- 3070.0
Population outlook (Santa Barbara County) Hauer SSP2
- Today (2025)
- 484,679 people
- By 2030
- 505,323 · +4.3%
- By 2040
- 545,783 · +12.6%
- By 2050
- 584,263 · +20.5%
- By 2075
- 682,586 · +40.8%
- By 2100
- 723,188 · +49.2%
Race, ethnicity, and origin ACS 2023
- Neighborhood character
- Diverse neighborhood (Simpson 0.58)
- Race & ethnicity
- Hispanic / Latino 48% White 43% Two or more races 23% Asian 3% Native American 2% Black 1%
- Hispanic origin (detail)
- Mexican 42%
- Common ancestry
- Italian 2% Lithuanian 2% Iranian 1%
- Foreign-born
- 26% · Canada, China
- Languages at home
- 59% English-only · Spanish 36% German/W. Germanic 1% Other Indo-European 1%
Political lean MEDSL · Santa Barbara
- 2024 margin
- Strong D (+26.7) · D 61.8% · R 35.1% · Other 3.1%
- 2008→2024 swing
- +3.8pp toward D · 2008: 22.9pp · 2024: 26.7pp
- All cycles
- 2024: D+26.7 2020: D+32.1 2016: D+28.2 2012: D+17.1 2008: D+22.9
Not yet ingested
- Civics
- —
Market trends
- HPI YoY
- ▼ -1014.03%
- Current HPI
- 305.6871
- Rent YoY
- ▲ 3.95%
- Metro
- Santa Maria-Santa Barbara, CA
- State GDP YoY
- ▲ 3.21%
- F500 in state
- 116
Industry mix (Fortune 500 HQ in CA)
| Industry | F500 HQs | Revenue |
|---|---|---|
| Technology | 27 | $1,492B |
|
||
| Financial Services | 3 | $174B |
|
||
| Retail | 3 | $44B |
|
||
| Insurance | 3 | $26B |
|
||
| Media / Entertainment | 2 | $115B |
|
||
| Pharmaceuticals / Biotech | 2 | $62B |
|
||
Price history
-15.3% since first listed4 events — show timeline
- 2026-05-20 Pending — SBMLS
- 2026-05-20 Price Changed $2,500,000 SBMLS
- 2026-02-23 Price Changed $2,825,000 SBMLS
- 2025-11-10 Listed $2,950,000 SBMLS
Property tax history
+1.7%/yrLatest (2025): $10,139 · +1.7% YoY. Source: county tax records.
Cash-flow waterfall
monthlySold comps — $/sqft
last 12 mo · ≤1 miLoading sold comps…