 Duplex
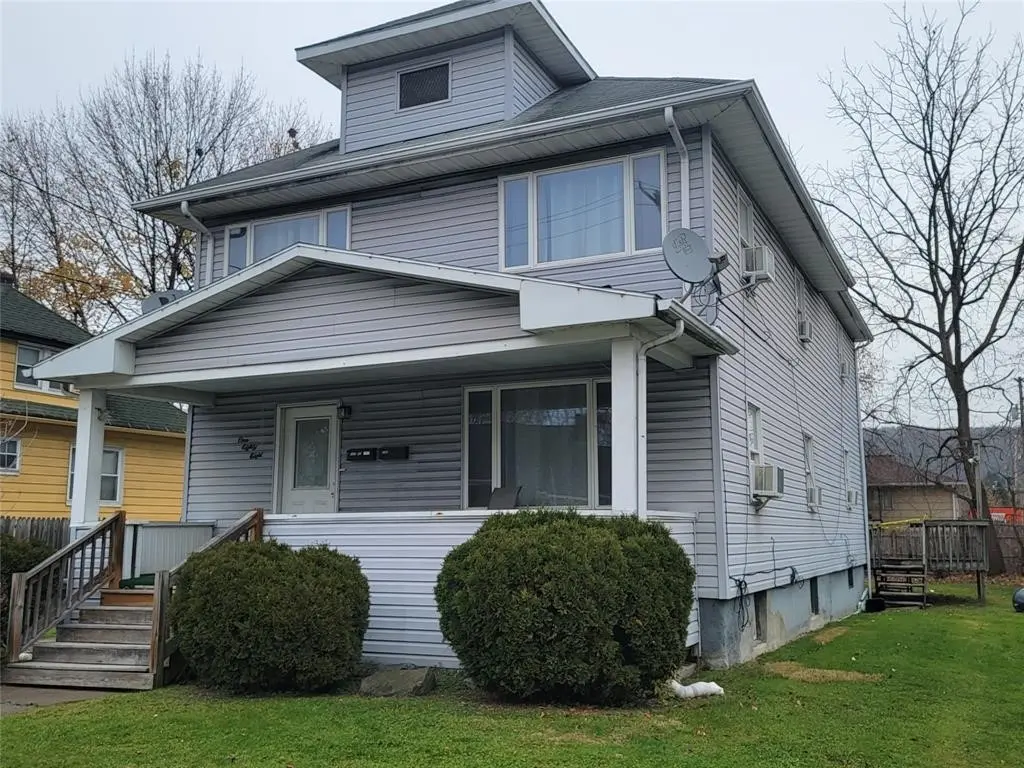
188 N Broad St · Johnson City, NY
Flood risk 9/10 · Severe
- FEMA flood zone
- X
- Chance of flooding over 30 yrs
- 0.99%
- Est. flood insurance / yr
- $473 – $860
Fire risk 3/10 · Minor
- Est. fire insurance / yr
- $691 – $1,283
Heat risk 3/10 · Minor
- Hot days now (above 94°F)
- 8 days/yr
- Hot days in 30 yrs
- 18 days/yr
Wind risk 2/10 · Minimal
- Chance of severe wind over 30 yrs
- 1.0%
Air-quality risk 2/10 · Minimal
- Unhealthy air days now
- 0 days/yr
- Unhealthy air days in 30 yrs
- 1 days/yr
Risk factors via First Street. Map © Google.
Why this score? — see what drove the D+ grade
The composite is a weighted blend of 9 inputs, each scored 0–100. Each bar is that input's sub-score; the figure is the points it added to the 100-point composite (weight × sub-score).
- Cash flow +13.2/30.0
- Appreciation +10.0/10.0
- Rent growth +4.9/5.0
- 1% rule +4.3/10.0
- DSCR +4.0/10.0
- Livability +3.8/5.0
- Schools +3.3/10.0
- Condition / age +2.5/5.0
- ARV discount +0.0/15.0
$295,000
🖨 Deal sheet (PDF) 📄 Offer letter ✓ Due diligence
Multi-family units
County records classify this as Multi-Family (2-4 Unit). Listing-text estimate: 2 units. confirmed
Listing remarks MLS
Looking to upgrade your real estate portfolio? This well-maintained two-family with a great rental history could be the addition you've sought. The two identical units are ideal for tenant or owner-occupant comfort with eat-in kitchens, spacious and bright rooms, LED lighting, laundry, and covered decks for outdoor enjoyment. The second story got a mini makeover in 2022 with new LVP flooring and a new refrigerator, as did the first floor in 2024. Both units have a washer/dryer, and the first-floor washer is new as of 2/2024. Brand new boiler put in March 2026! Conveniently located to services in a lovely neighborhood with sidewalks and mature trees.
Key facts
- Identical units
- Led lighting
- Spacious rooms
Tags
Neighborhood map
What this means for you Summary
Snapshot
- This is a 2 × 2-bed/1.0-bath units multifamily listed at $295k.
Deal economics
- At list price, monthly cash flow is $-61 ($-736/yr) — negative. Per door: $-31/mo.
- To cash-flow at today's rent, offer at most $284k (3.7% below list).
- To meet the 1% rule (rent ≥ 1% of price), the offer needs to be $276k (6.6% below list).
- Recommended offer: $260k (12.0% below list) — sets the bar for market timing.
Location & tenants
- Location reads 76/100 on livability (#238 in NY, #3,739 nationally) — a middle-class / working-renter tenant base. Strengths: cost of living A+, housing A+, health & safety A+; Watch: crime F, employment D-.
- Johnson City Central School District (suburban): math 38% / reading 41% proficiency, ranked #535 of 590 in NY (top 91%) — families likely to look elsewhere, expect single-tenant / working-renter base with shorter leases.
- Zoned schools: Johnson City Elementary/Primary School (496 students, 55% FRL); Johnson City Middle School (math 19% / reading 43%, grade F, #534 of 729 statewide, top 73%, 500 students, 65% FRL); Johnson City Senior High School (math 98% / reading 64%, grade A, #485 of 1,100 statewide, top 45%, 729 students, 60% FRL) — zoned schools at 60% FRL track the district average.
- Zoned-school proficiency averages 56% at this address vs 40% district-wide (+16 pts) — the actual schools serving this property are materially stronger than the Johnson City Central School District average implies; a family-tenant draw the district grade alone would hide.
- Market conditions: Rents rising fast (+9.5%/yr); 102 active listings in the ZIP; 3 comparable units currently listed for rent nearby; rentals at typical pace (median 15d on market — plan ~3-4 weeks tenant-placement turnaround); 340 units permitted in Broome County in 2024 (269 in 5+ unit buildings).
Forward outlook
- In year one you build about $32k of equity ($2k loan paydown + $30k appreciation (10.0% local appreciation)).
- Broome County population projected at -13% by 2050 — secular population decline; favor cash flow + early exit over multi-decade hold.
- At projected returns (10.0% appreciation + 8.0% rent growth), your $83k cash investment doubles in ~3 years — after that, you're playing with house money.
- By year 2, paydown + projected appreciation supports a ~$51k cash-out refi (75% LTV) — recoverable capital for the next deal without selling this one.
Negotiation context
- It's been on market 122 days — a 12% lower offer ($260k) is reasonable based on typical stale-listing flexibility.
- 5 sale attempts since 11y ago with the ask held roughly flat each time — persistent listings suggest the price (not the market) is what's stuck; bring a comps-based counter.
- Current owner paid $82k; list at $295k implies a 260% gain — meaningful room to come down on a strong offer.
Risks & watch-outs
- Watch-outs: flood insurance adds $56/mo; built in 1919 — expect roof / HVAC / electrical / plumbing capex.
Questions for the listing agent
- What do current leases actually rent for vs. the listed asking? Can we see a recent rent roll and the last 12 months of T-12 income?
- It's been on market 122 days. Have you received any prior offers? Is the seller open to a 12% concession, seller financing, or rate buy-down credit?
- Can we see the unit-by-unit rent roll, current vacancy, and any below-market leases? What's the average tenancy length?
- What capital expenditures (roof, boiler, parking lot, exteriors) have been made in the last 5 years, and what's planned in the next 2?
- Built in 1919 — when were the roof, HVAC, electrical panel, plumbing, and water heater last replaced?
- What's the actual annual flood-insurance premium (NFIP or private), and is the property in a SFHA with mandatory coverage?
- Why hasn't it sold? Are there any deal-killer items the seller is aware of (foundation, flood, title, zoning, code violations)?
- Is there a deadline driving the sale (1031 exchange, divorce, estate, relocation)? That informs how much negotiation room exists.
- Crime grade is F in this area — have there been break-ins, vandalism, or insurance claims at this property in the last 3 years? What carrier currently insures it and at what premium?
- The area grade is low — what's the realistic commute time and amenity access for the typical tenant pool here? Any planned neighborhood developments (good or bad) we should know about?
- What's the average days-on-market for RENTAL listings here right now (not sales)? A rising rental-DOM trend means longer vacancies and softer asking-rent achievability than the comps imply.
- What's the recent tenant-quality profile in this submarket — average credit score on applications, eviction rate, late-payment / NSF rate, and stable-employment percentage? A property-management company in the area should have these aggregated.
- How much new apartment / multifamily construction is in the pipeline within 1–3 miles? Heavy new supply (>2% of stock underway) typically softens rents 12–24 months out; light construction supports rent growth.
Investment metrics
- 1% rule
- 0.93% ✗
- Cap rate
- 6.27%
- Cash-on-cash
- -0.08%
- DSCR
- 1.00
- GRM
- 8.9
CMA / ARV
- ARV (median comp)
- $228,184
- List price
- $295,000
- Delta
- 29.28%
- Verdict
- OVERPRICED
- Comps
- 20 within 1.0 mi
Show comp detail 2 sales within ~0.75 mi
| Address | Dist | Beds/Ba | Sqft | Sold | Price | $/sf | Match |
|---|---|---|---|---|---|---|---|
| 38 North St | 0.27mi | 4/2.0 | 1,960 (-11%) | 6mo | $140,000 | $71 | 63 |
| 378 Prospect St | 0.72mi | 4/4.0 | 2,214 (+0%) | 9mo | $171,000 | $77 | 50 |
Match score weights: distance 35% · size 25% · config 20% · recency 20%. Top-matched comps best support the ARV.
Projected returns pro-forma
10.0% appreciation · 8.0% rent growth · sell at horizon
- IRR
- 25.5%
- Equity multiple
- 3.08×
- Total profit
- $171,484
- Equity at exit
- $265,759
- IRR
- 24.0%
- Equity multiple
- 7.59×
- Total profit
- $544,456
- Equity at exit
- $573,120
Cash invested: $82,600 (down + closing). Projections, not guarantees.
Landlord ↔ Tenant lean methodology
- Overall (STATE)
- 15 Strongly Tenant-Friendly
- State New York
- 15 Strongly Tenant-Friendly · D+10
- County
- — inherits STATE
- City
- — inherits STATE
ZIP-level market 13790
- Home prices YoY
- 6.8%
- Rents YoY
- 9.5%
- Active inventory
- 102
- Price-to-rent
- 17.8×
Monthly cashflow live
- Estimated rent
- $2,755 high interval (Pro) →
- Mortgage (P&I)
- −$1,547
- Tax from tax record
- −$512 /mo · $6,147/yr
- Insurance
- −$123
- Flood insurance flood zone
- −$56 /mo · $666/yr
- HOA
- −$0
- Vacancy / Maint / Mgmt
- −$579
- Net cashflow
- $-61
Break-even live
Sensitivity live
| Price | -10% $106 | -5% $22 | +0% $-61 | +5% $-145 | +10% $-228 |
|---|---|---|---|---|---|
| Rent | -10% $-279 | -5% $-170 | +0% $-61 | +5% $48 | +10% $156 |
| Rate | -1.0pp $87 | -0.5pp $14 | base $-61 | +0.5pp $-138 | +1.0pp $-216 |
2-unit breakdown (identical units grouped — click to expand)
| Units | Beds | Baths | Est. rent |
|---|---|---|---|
| 2× units | 2 | 1 | $2,754 |
| #1 | 2 | 1 | $1,377 |
| #2 | 2 | 1 | $1,377 |
| Total (2 units) | $2,755 | ||
UW: 25.0% down · 7.5% · 30yr · 1.5% tax · 5.0% vac · 8.0% maint · 8.0% mgmt
Financing live
Cash to close
- Down payment
- $73,750
- Closing costs
- $8,850
- Reserves months
- —
- Total cash needed
- —
Loan-product check · same deal, 3 products live
Conventional
25% down · 7.5% · 30yr
- Down + closing
- —
- Monthly P&I
- —
- Monthly cashflow
- —
- DSCR
- —
- Eligible?
- —
Personal DTI + credit; lowest rate.
DSCR
20% down · 8.5% · 30yr
- Down + closing
- —
- Monthly P&I
- —
- Monthly cashflow
- —
- DSCR
- —
- Eligible?
- —
No personal income docs; deal must DSCR.
Hard money
10% down · 12.0% · 12mo
- Down + closing
- —
- Monthly P&I
- —
- Monthly cashflow
- —
- DSCR
- —
- Eligible?
- —
Short-term bridge; refi at stabilization.
Rent comps 3 comps
| Address | Beds | Baths | Sqft | Rent | $/sqft | DOM | Units | Dist |
|---|---|---|---|---|---|---|---|---|
| 50 Crocker Ave Johnson City, NY | 4.0 | 2.0 | 1411 | $2,000 | $1.42 | 23d | 1 | 0.69mi |
| 4 Baxter St Unit Left Binghamton, NY | 4.0 | 2.5 | 1800 | $1,500 | $0.83 | 15d | 1 | 1.12mi |
| 57 Fowler Ave Johnson City, NY | 3.0 | 2.5 | 2497 | $2,000 | $0.80 | 15d | 1 | 1.36mi |
Listing history 26 events
-
2026-06-21days on market $295,000 Active 122 DOM
-
2026-06-19days on market $295,000 Active 120 DOM
-
2026-06-18days on market $295,000 Active 119 DOM
-
2026-06-17days on market $295,000 Active 118 DOM
-
2026-06-16days on market $295,000 Active 117 DOM
-
2026-06-15days on market $295,000 Active 116 DOM
-
2026-06-14days on market $295,000 Active 114 DOM
-
2026-06-13days on market $295,000 Active 113 DOM
-
2026-06-10days on market $295,000 Active 111 DOM
-
2026-06-09days on market $295,000 Active 110 DOM
-
2026-06-08days on market $295,000 Active 109 DOM
-
2026-06-07days on market $295,000 Active 108 DOM
-
2026-06-05days on market $295,000 Active 105 DOM
-
2026-06-03days on market $295,000 Active 104 DOM
-
2026-06-02days on market $295,000 Active 103 DOM
-
2026-06-01days on market $295,000 Active 102 DOM
-
2026-05-31days on market $295,000 Active 101 DOM
-
2026-05-30days on market $295,000 Active 100 DOM
-
2026-02-19$295,000 Active 657-char remark
Show marketing remark (657 chars)
Looking to upgrade your real estate portfolio? This well-maintained two-family with a great rental history could be the addition you've sought. The two identical units are ideal for tenant or owner-occupant comfort with eat-in kitchens, spacious and bright rooms, LED lighting, laundry, and covered decks for outdoor enjoyment. The second story got a mini makeover in 2022 with new LVP flooring and a new refrigerator, as did the first floor in 2024. Both units have a washer/dryer, and the first-floor washer is new as of 2/2024. Brand new boiler put in March 2026! Conveniently located to services in a lovely neighborhood with sidewalks and mature trees.
-
2024-11-20$275,000 Active
-
2017-03-13soldstatus $82,000
-
2017-03-10soldstatus $82,000
-
2016-09-20$85,000
-
2015-10-04$95,000
-
2015-02-27$97,000
-
2005-12-16soldstatus $97,500
ⓘ Source: listings_history table (triggers on properties + properties_extension) + one-shot
backfill from property_details.listing_events for pre-trigger history.
Tax reassessment forecast NY · Partial reset (capped growth)
- Current annual tax
- $6,147 · $512/mo
- Projected year-2 tax
- $6,147 · $512/mo
- Expected delta
- $0/yr ($0/mo · 0.0%)
ⓘ Screening estimate from a state-policy table — verify with the county assessor before closing.
Climate risk First Street
- Flood 9/10 Extreme FEMA zone X · 99% chance over 30 yrs
- Wildfire 3/10 Moderate
- Heat 3/10 Moderate 8 d/yr ≥94°F today · 18 d/yr by 30 yrs out
- Wind 2/10 Low 100% chance of damaging wind over 30 yrs
- Air quality 2/10 Low 0 unhealthy d/yr today · 1 by 30 yrs out
Nearby sold comps map
Loading sold comps map…
Walkable amenities ~0.75 mi
Loading nearby amenities…
Taxation est. · year 1
- Rental income
- $33,060
- − Mortgage interest
- −$16,525
- − Property taxes
- −$6,147
- − Insurance
- −$2,142
- − Repairs & maintenance
- −$2,645
- − Management
- −$2,645
- − Depreciation
- −$8,582
- Taxable loss
- −$5,625
- Est. tax savings @ 24.0%
- +$1,350
- After-tax cash flow
- $614/yr
For passive investors: Depreciation is non-cash, so a rental often shows a tax loss while cash-flowing — sheltering income. Rental losses are passive: they offset passive income freely, and up to $25,000/yr can offset ordinary (W-2) income if you actively participate and your MAGI is under $100k (phasing out to $0 by $150k); unused losses carry forward. On sale, claimed depreciation is recaptured at up to 25%, and gains may owe capital-gains tax (a 1031 exchange can defer both). Figures are a year-1 estimate at your 24.0% rate — not tax advice; consult a CPA.
Schools (NCES district)
- District
- Johnson City Central School District
- NCES district ID
- 3615900
- Math proficiency
- 38% ▼ -8.00%
- Reading proficiency
- 41% ▲ 2.00%
- Median HH income
- $40,514
- Composite
- 33.17/100
- National rank
- #5545
- State rank
- #535 of 590 in NY
Livability — Johnson City
- Score
- 76/100
- State rank
- #238
- US rank
- #3739
Category grades
Schools grade is shown separately in the Schools card above.
Census & demographics
- Census place
- Johnson City, NY
- County
- Broome County · 126,805 people
- City population
- 18,739
- Metro
- Binghamton, NY
- Population (ZIP)
- 18,739
- Household income
- $59,045
- Rent vs Own
- Severe rent burden
- 1233.0
Population outlook (Broome County) Hauer SSP2
- Today (2025)
- 187,989 people
- By 2030
- 183,066 · -2.6%
- By 2040
- 172,228 · -8.4%
- By 2050
- 163,161 · -13.2%
- By 2075
- 153,641 · -18.3%
- By 2100
- 140,851 · -25.1%
Race, ethnicity, and origin ACS 2023
- Neighborhood character
- Predominantly White (75%)
- Race & ethnicity
- White 75% Two or more races 9% Asian 8% Black 6% Hispanic / Latino 4%
- Common ancestry
- Romanian 6% Lithuanian 3% Scotch-Irish 2%
- Foreign-born
- 9% · Canada, China, Vietnam
- Languages at home
- 88% English-only · Other Indo-European 4% French/Haitian/Cajun 2% Spanish 2%
Political lean MEDSL · Broome
- 2024 margin
- Toss-up / Even · D 50.2% · R 49.8%
- 2008→2024 swing
- -7.6pp toward R · 2008: 8.0pp · 2024: 0.4pp
- All cycles
- 2024: D+0.4 2020: D+3.5 2016: R+3.7 2012: D+4.6 2008: D+8.0
Not yet ingested
- Civics
- —
Market trends
- HPI YoY
- ▲ 18.06%
- Current HPI
- 285.3668
- Rent YoY
- ▲ 9.47%
- Metro
- Binghamton, NY
- State GDP YoY
- ▲ 2.60%
- F500 in state
- 92
Industry mix (Fortune 500 HQ in NY)
| Industry | F500 HQs | Revenue |
|---|---|---|
| Financial Services | 10 | $950B |
|
||
| Consumer Goods | 9 | $162B |
|
||
| Insurance | 4 | $225B |
|
||
| Telecommunications | 2 | $144B |
|
||
| Pharmaceuticals | 2 | $112B |
|
||
| Media / Entertainment | 2 | $69B |
|
||
Price history
+202.6% since first listed8 events — show timeline
- 2026-02-19 Listed $295,000 GBAOR
- 2024-11-20 Listed $275,000 GBAOR
- 2017-03-13 Sold (Public Records) $82,000 Public Records
- 2017-03-10 Sold (MLS) $82,000 GBAOR
- 2016-09-20 Listed $85,000 GBAOR
- 2015-10-04 Listed $95,000 GBAOR
- 2015-02-27 Listed $97,000 GBAOR
- 2005-12-16 Sold (Public Records) $97,500 Public Records
Property tax history
+2.2%/yrLatest (2025): $6,147 · +1.7% YoY. Source: county tax records.
Cash-flow waterfall
monthlySold comps — $/sqft
last 12 mo · ≤1 miLoading sold comps…