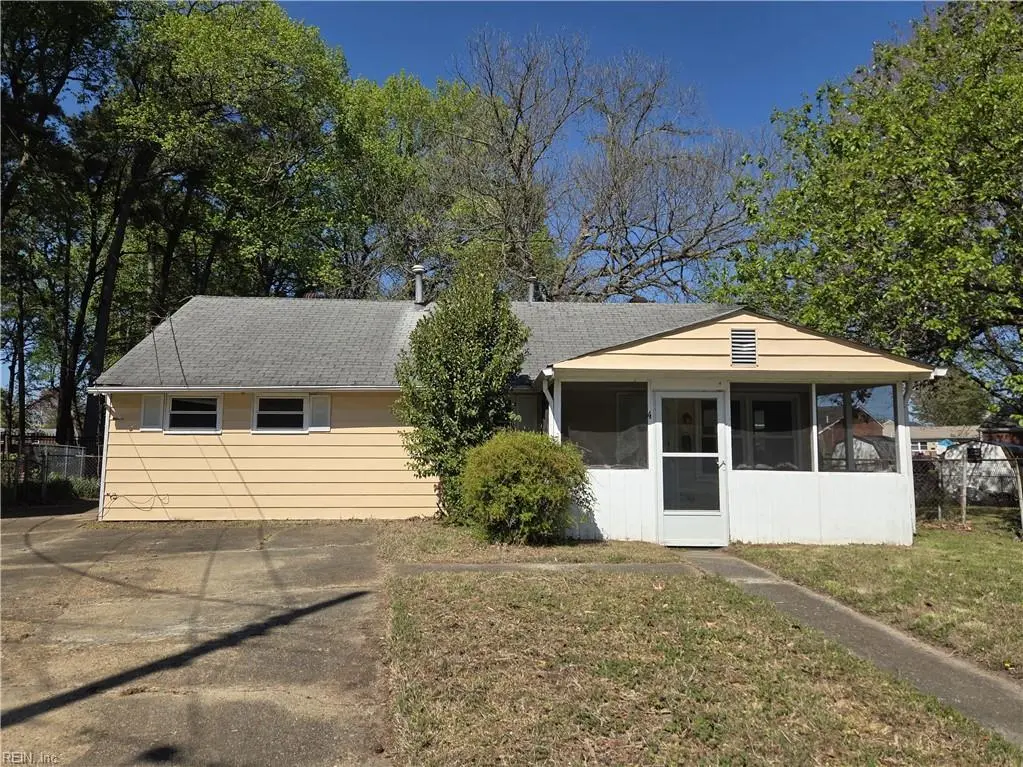
4 Jordan Dr · Hampton, VA
Flood risk 5/10 · Moderate
- FEMA flood zone
- X (unshaded)
- Chance of flooding over 30 yrs
- 0.47%
- Est. flood insurance / yr
- $507 – $1,088
Fire risk 1/10 · Minimal
- Est. fire insurance / yr
- $666 – $1,236
Heat risk 9/10 · Severe
- Hot days now (above 105°F)
- 7 days/yr
- Hot days in 30 yrs
- 16 days/yr
Wind risk 8/10 · Major
- Chance of severe wind over 30 yrs
- 80.0%
Air-quality risk 2/10 · Minimal
- Unhealthy air days now
- 1 days/yr
- Unhealthy air days in 30 yrs
- 1 days/yr
Risk factors via First Street. Map © Google.
Why this score? — see what drove the B grade
The composite is a weighted blend of 9 inputs, each scored 0–100. Each bar is that input's sub-score; the figure is the points it added to the 100-point composite (weight × sub-score).
- Cash flow +26.3/30.0
- ARV discount +15.0/15.0
- DSCR +8.9/10.0
- 1% rule +7.1/10.0
- Schools +5.5/10.0
- Livability +3.8/5.0
- Rent growth +3.5/5.0
- Condition / age +2.5/5.0
- Appreciation +0.0/10.0
$173,000
🖨 Deal sheet 📄 Offer letter ✓ Due diligence
Listing remarks MLS
This 3-bedroom 1.5 bath fixer-upper has tremendous potential for a homeowner or investor willing to put in the work to bring this home to its full glory. Large rooms throughout and a nice sized fenced in back yard with a storage building that can be used as a workshop. Located on a cul-de-sac which is convenient to Langley AFB, Hampton Coliseum and the James River Bridge, Monitor Merrimac and the HRBT. Case# 544-028151 IE (Insured Escrow) Subject to Appraisal. Property is Owned by the US Dept. of HUD. Seller makes no representations or warranties as to the property condition. HUD Homes are Sold "AS IS". Equal Housing Opportunity. Seller may contribute up to 3% for buyers closing costs upon buyer request.
Key facts
- Storage building
- Fenced in back yard
- Cul-de-sac
Tags
Neighborhood map
What this means for you Summary
Snapshot
- This is a 3-bed/1.5-bath single-family listed at $173k.
Deal economics
- At list price, monthly cash flow is $447 ($5k/yr) — positive.
- The deal already cash-flows at list — no discount required.
- Meets the 1% rule at list price ($2k rent vs $173k).
- Recommended offer: $168k (3.0% below list) — sets the bar for market timing.
- Cap rate 9.4% vs local median 4.5% in Hampton — top-decile yield for the area; either an underpriced asset or a hidden risk that comps aren't pricing in. Stress-test before assuming the spread holds.
Location & tenants
- Location reads 75/100 on livability (#133 in VA, #4,302 nationally) — a middle-class / working-renter tenant base. Strengths: housing A+, health & safety A+, cost of living A; Watch: crime C-, amenities D+, commute F.
- Hampton City Public School District (urban): math 60% / reading 70% proficiency, ranked #40 of 131 in VA (top 30%) — acceptable for families but not a draw, mixed tenant base, ~2y average lease.
- Market conditions: Rents rising fast (+4.0%/yr); 231 active listings in the ZIP; 18 comparable units currently listed for rent nearby; rentals at typical pace (median 15d on market — plan ~3-4 weeks tenant-placement turnaround); 68 units permitted in Hampton city in 2024 (0 in 5+ unit buildings).
- This rent runs 35% of the median local income ($73k/yr) — at the standard rent-burdened threshold; future hikes will face affordability resistance.
Forward outlook
- Local home prices are declining (-3.0%/yr); year-one equity from $1k of loan paydown is wiped out by about $5k of value loss. Plan a longer hold.
- Hampton County population projected at -13% by 2050 — secular population decline; favor cash flow + early exit over multi-decade hold.
- At projected returns (-3.0% appreciation + 4.0% rent growth), your $48k cash investment doubles in ~9 years — after that, you're playing with house money.
Negotiation context
- It's been on market 32 days — a 3% lower offer ($168k) is reasonable based on typical stale-listing flexibility.
Risks & watch-outs
- Watch-outs: built in 1954 — expect roof / HVAC / electrical / plumbing capex.
- Climate carrying-cost: moderate flood risk; severe wind risk, 80% chance of damaging wind over 30y; extreme-heat days projected 7→16/yr by 2055 (HVAC capex compounding) — expect insurance premiums to compound above CPI over the hold.
Questions for the listing agent
- It's been on market 32 days. Have you received any prior offers? Is the seller open to a 3% concession, seller financing, or rate buy-down credit?
- Built in 1954 — when were the roof, HVAC, electrical panel, plumbing, and water heater last replaced?
- Is there a deadline driving the sale (1031 exchange, divorce, estate, relocation)? That informs how much negotiation room exists.
- Schools are B-rated — typically a magnet for longer-tenancy family renters. What's the average tenant stay here, and is there a school-zone premium baked into asking?
- What's the average days-on-market for RENTAL listings here right now (not sales)? A rising rental-DOM trend means longer vacancies and softer asking-rent achievability than the comps imply.
- What's the recent tenant-quality profile in this submarket — average credit score on applications, eviction rate, late-payment / NSF rate, and stable-employment percentage? A property-management company in the area should have these aggregated.
- How much new for-sale + rental construction is in the pipeline within 1–3 miles? Heavy new supply typically softens prices + rents 12–24 months out; constrained supply supports both.
Investment metrics
- 1% rule
- 1.21% ✓
- Cap rate
- 9.39%
- Cash-on-cash
- 11.07%
- DSCR
- 1.49
- GRM
- 6.9
CMA / ARV
- ARV (median comp)
- $325,836
- List price
- $173,000
- Delta
- -46.91%
- Verdict
- UNDERPRICED
- Comps
- 20 within 1.0 mi
Show comp detail 12 sales within ~0.75 mi
| Address | Dist | Beds/Ba | Sqft | Sold | Price | $/sf | Match |
|---|---|---|---|---|---|---|---|
| 26 St Johns Dr | 0.10mi | 3/2.0 | 1,584 (+2%) | 6mo | $323,500 | $204 | 84 |
| 1120 Micott Dr | 0.17mi | 3/1.5 | 1,401 (-9%) | 1mo | $260,000 | $186 | 75 |
| 17 Northwood Dr | 0.61mi | 3/1.0 | 1,510 (-2%) | 3mo | $240,000 | $159 | 63 |
| 15 E Walker Rd | 0.60mi | 3/2.0 | 1,456 (-6%) | 2mo | $309,900 | $213 | 59 |
| 1126 Gatling Dr | 0.62mi | 4/2.0 (+1) | 1,539 (-0%) | 6mo | $320,000 | $208 | 59 |
| 1419 Aberdeen Rd | 0.54mi | 3/2.0 | 1,686 (+9%) | 4mo | $304,800 | $181 | 54 |
| 1205 Micott Dr | 0.27mi | 4/2.5 (+1) | 1,762 (+14%) | 4mo | $333,000 | $189 | 52 |
| 1036 Randall Ct | 0.44mi | 4/2.5 (+1) | 1,743 (+13%) | 2mo | $340,000 | $195 | 48 |
| 108 Briar Dr | 0.50mi | 4/2.5 (+1) | 1,688 (+9%) | 5mo | $315,000 | $187 | 48 |
| 106 Dan Leigh Ct | 0.74mi | 3/2.0 | 1,648 (+7%) | 9mo | $333,000 | $202 | 45 |
| 116 Twin Oaks Dr | 0.70mi | 4/2.0 (+1) | 1,392 (-10%) | 8mo | $270,000 | $194 | 37 |
| 205 Gumwood Dr | 0.71mi | 4/2.0 (+1) | 1,752 (+13%) | 5mo | $315,000 | $180 | 34 |
Match score weights: distance 35% · size 25% · config 20% · recency 20%. Top-matched comps best support the ARV.
Projected returns pro-forma
-3.0% appreciation · 4.05% rent growth · sell at horizon
- IRR
- 1.4%
- Equity multiple
- 1.06×
- Total profit
- $2,689
- Equity at exit
- $25,795
- IRR
- 12.1%
- Equity multiple
- 2.00×
- Total profit
- $48,476
- Equity at exit
- $14,958
Cash invested: $48,440 (down + closing). Projections, not guarantees.
Landlord ↔ Tenant lean methodology
- Overall (STATE)
- 55 Moderately Landlord-Leaning
- State Virginia
- 55 Moderately Landlord-Leaning · D+2
- County
- — inherits STATE
- City
- — inherits STATE
ZIP-level market 23666
- Home prices YoY
- -15.7%
- Rents YoY
- 4.0%
- Active inventory
- 231
- Price-to-rent
- 6.9×
Monthly cashflow live
- Estimated rent
- $2,088 high interval (Pro) →
- Mortgage (P&I)
- −$907
- Tax from tax record
- −$223 /mo · $2,681/yr
- Insurance
- −$72
- HOA
- −$0
- Vacancy / Maint / Mgmt
- −$438
- Net cashflow
- $447
Break-even live
UW: 25.0% down · 7.5% · 30yr · 1.5% tax · 5.0% vac · 8.0% maint · 8.0% mgmt
Financing live
Cash to close
- Down payment
- $43,250
- Closing costs
- $5,190
- Reserves months
- —
- Total cash needed
- —
Loan-product check · same deal, 3 products live
Conventional
25% down · 7.5% · 30yr
- Down + closing
- —
- Monthly P&I
- —
- Monthly cashflow
- —
- DSCR
- —
- Eligible?
- —
Personal DTI + credit; lowest rate.
DSCR
20% down · 8.5% · 30yr
- Down + closing
- —
- Monthly P&I
- —
- Monthly cashflow
- —
- DSCR
- —
- Eligible?
- —
No personal income docs; deal must DSCR.
Hard money
10% down · 12.0% · 12mo
- Down + closing
- —
- Monthly P&I
- —
- Monthly cashflow
- —
- DSCR
- —
- Eligible?
- —
Short-term bridge; refi at stabilization.
Rent comps 18 comps
| Address | Beds | Baths | Sqft | Rent | $/sqft | DOM | Units | Dist |
|---|---|---|---|---|---|---|---|---|
| 1102 Celia Ct Hampton, VA | 2.0 | 2.0 | 1370 | $2,100 | $1.53 | 43d | 1 | 0.22mi |
| 208 Fishers Ct Hampton, VA | 2.0 | 3.0 | 1519 | $2,295 | $1.51 | 12d | 1 | 0.26mi |
| 408 Fishers Ct Hampton, VA | 2.0 | 2.0 | 1369 | $1,999 | $1.46 | 43d | 1 | 0.26mi |
| 7 W Lewis Rd Hampton, VA | 3.0 | 2.0 | 1208 | $2,425 | $2.01 | 21d | 1 | 0.53mi |
| 7 Briar Dr Hampton, VA | 3.0 | 1.5 | 1626 | $1,850 | $1.14 | 14d | 1 | 0.70mi |
| 2217 Todds Ln Hampton, VA | 2.0 | 2.5 | 1300 | $1,450 | $1.12 | 43d | 1 | 0.77mi |
| 101 Prince James Dr Hampton, VA | 3.0 | 1.0 | 1766 | $1,645 | $0.93 | 14d | 1 | 0.80mi |
| 1587 Briarfield Rd Hampton, VA | 2.0–3.0 | 1.5–2.0 | 985 | $1,495 | $1.52 | 2d | 9 | 0.83mi |
| 37 Pennwood Dr Hampton, VA | 3.0 | 2.0 | 1156 | $1,795 | $1.55 | 23d | 1 | 1.05mi |
| 3318 Custer Ct Hampton, VA | 4.0 | 2.5 | 1625 | $2,500 | $1.54 | 12d | 1 | 1.13mi |
| 316 Fountain Way Hampton, VA | 3.0 | 2.5 | 1850 | $2,600 | $1.41 | 17d | 1 | 1.15mi |
| 600 Freeman Dr Hampton, VA | 1.0–2.0 | 1.0–2.0 | 892 | $2,008 | $2.25 | 2d | 8 | 1.22mi |
| 321 Big Bethel Rd Hampton, VA | 3.0 | 1.0 | 1400 | $2,300 | $1.64 | 12d | 1 | 1.22mi |
| 700 Benevita Pl Unit 700-403 Hampton, VA | 2.0 | 2.0 | 1359 | $2,100 | $1.55 | 23d | 1 | 1.32mi |
| 100 Monticello Mews Hampton, VA | 1.0–3.0 | 1.0–2.0 | 1175 | $3,089 | $2.63 | 2d | 15 | 1.37mi |
| 2018 Cunningham Dr Hampton, VA | 1.0–3.0 | 1.0–1.5 | 997 | $1,880 | $1.88 | 1d | 25 | 1.47mi |
| 260 Marcella Rd Hampton, VA | 1.0–2.0 | 1.0–2.0 | 825 | $1,838 | $2.23 | 1d | 18 | 1.47mi |
| 10 Rutland Dr Hampton, VA | 3.0 | 2.5 | 1817 | $2,600 | $1.43 | 23d | 1 | 1.49mi |
Listing history 2 events
-
2026-05-08historical Active Under Contract 724-char remark
Show marketing remark (724 chars)
This 3-bedroom 1.5 bath fixer-upper has tremendous potential for a homeowner or investor willing to put in the work to bring this home to its full glory. Large rooms throughout and a nice sized fenced in back yard with a storage building that can be used as a workshop. Located on a cul-de-sac which is convenient to Langley AFB, Hampton Coliseum and the James River Bridge, Monitor Merrimac and the HRBT. Case# 544-028151 IE (Insured Escrow) Subject to Appraisal. Property is Owned by the US Dept. of HUD. Seller makes no representations or warranties as to the property condition. HUD Homes are Sold "AS IS". Equal Housing Opportunity. Seller may contribute up to 3% for buyers closing costs upon buyer request.
-
2026-04-21$173,000 Active 724-char remark
Show marketing remark (724 chars)
This 3-bedroom 1.5 bath fixer-upper has tremendous potential for a homeowner or investor willing to put in the work to bring this home to its full glory. Large rooms throughout and a nice sized fenced in back yard with a storage building that can be used as a workshop. Located on a cul-de-sac which is convenient to Langley AFB, Hampton Coliseum and the James River Bridge, Monitor Merrimac and the HRBT. Case# 544-028151 IE (Insured Escrow) Subject to Appraisal. Property is Owned by the US Dept. of HUD. Seller makes no representations or warranties as to the property condition. HUD Homes are Sold "AS IS". Equal Housing Opportunity. Seller may contribute up to 3% for buyers closing costs upon buyer request.
ⓘ Source: listings_history table (triggers on properties + properties_extension) + one-shot
backfill from property_details.listing_events for pre-trigger history.
Tax reassessment forecast VA · Resets to sale price
- Current annual tax
- $2,681 · $223/mo
- Projected year-2 tax
- $2,681 · $223/mo
- Expected delta
- $0/yr ($0/mo · 0.0%)
ⓘ Screening estimate from a state-policy table — verify with the county assessor before closing.
Climate risk First Street
- Flood 5/10 Major FEMA zone X (unshaded) · 47% chance over 30 yrs
- Wildfire 1/10 Low
- Heat 9/10 Extreme 7 d/yr ≥105°F today · 16 d/yr by 30 yrs out
- Wind 8/10 Severe 80% chance of damaging wind over 30 yrs
- Air quality 2/10 Low 1 unhealthy d/yr today · 1 by 30 yrs out
Nearby sold comps map
Loading sold comps map…
Walkable amenities ~0.75 mi
Loading nearby amenities…
Taxation est. · year 1
- Rental income
- $25,057
- − Mortgage interest
- −$9,691
- − Property taxes
- −$2,681
- − Insurance
- −$865
- − Repairs & maintenance
- −$2,005
- − Management
- −$2,005
- − Depreciation
- −$5,033
- Taxable income
- $2,778
- Est. tax owed @ 24.0%
- −$667
- After-tax cash flow
- $4,695/yr
For passive investors: Depreciation is non-cash, so a rental often shows a tax loss while cash-flowing — sheltering income. Rental losses are passive: they offset passive income freely, and up to $25,000/yr can offset ordinary (W-2) income if you actively participate and your MAGI is under $100k (phasing out to $0 by $150k); unused losses carry forward. On sale, claimed depreciation is recaptured at up to 25%, and gains may owe capital-gains tax (a 1031 exchange can defer both). Figures are a year-1 estimate at your 24.0% rate — not tax advice; consult a CPA.
Schools (NCES district)
- District
- Hampton City Public School District
- NCES district ID
- 5101800
- Math proficiency
- 60% ▼ -21.00%
- Reading proficiency
- 70% ▼ -4.00%
- Median HH income
- $50,089
- Composite
- 55.19/100
- National rank
- #1272
- State rank
- #40 of 131 in VA
Livability — Hampton
- Score
- 75/100
- State rank
- #133
- US rank
- #4302
Category grades
Schools grade is shown separately in the Schools card above.
Census & demographics
- Census place
- Hampton, VA
- County
- Hampton City · 132,421 people
- City population
- 132,421
- Metro
- Virginia Beach-Norfolk-Newport News, VA-NC
- Population (ZIP)
- 54,233
- Household income
- $72,568
- Rent vs Own
- Severe rent burden
- 2951.0
Population outlook (Hampton County) Hauer SSP2
- Today (2025)
- 134,055 people
- By 2030
- 131,753 · -1.7%
- By 2040
- 125,017 · -6.7%
- By 2050
- 116,825 · -12.9%
- By 2075
- 97,033 · -27.6%
- By 2100
- 76,188 · -43.2%
Race, ethnicity, and origin ACS 2023
- Neighborhood character
- Diverse neighborhood (Simpson 0.65)
- Race & ethnicity
- Black 51% White 29% Two or more races 10% Hispanic / Latino 9% Asian 4%
- Hispanic origin (detail)
- Mexican 3% Puerto Rican 3%
- Common ancestry
- Italian 1% Lithuanian 1% Romanian 1%
- Foreign-born
- 7% · Canada, Vietnam
- Languages at home
- 90% English-only · Spanish 5% Vietnamese 1% Arabic 1%
Political lean MEDSL · Hampton
- 2024 margin
- Solid D (+39.9) · D 69.2% · R 29.4% · Other 1.4%
- 2008→2024 swing
- +1.0pp no change · 2008: 38.9pp · 2024: 39.9pp
- All cycles
- 2024: D+39.9 2020: D+42.2 2016: D+37.8 2012: D+45.4 2008: D+38.9
Not yet ingested
- Civics
- —
Market trends
- HPI YoY
- ▼ -49.01%
- Current HPI
- 262.821
- Rent YoY
- ▲ 4.05%
- Metro
- Virginia Beach-Norfolk-Newport News, VA-NC
- State GDP YoY
- ▲ 2.40%
- F500 in state
- 50
Industry mix (Fortune 500 HQ in VA)
| Industry | F500 HQs | Revenue |
|---|---|---|
| Aerospace / Defense | 4 | $236B |
|
||
| Technology / Defense | 3 | $32B |
|
||
| Financial Services | 2 | $176B |
|
||
| Utilities | 2 | $27B |
|
||
| Insurance | 2 | $25B |
|
||
| Technology | 2 | $15B |
|
||
Price history
2 events — show timeline
- 2026-05-08 Contingent — REINMLS
- 2026-04-21 Listed $173,000 REINMLS
Property tax history
+9.9%/yrLatest (2025): $2,681 · +3.9% YoY. Source: county tax records.
Cash-flow waterfall
monthlySold comps — $/sqft
last 12 mo · ≤1 miLoading sold comps…