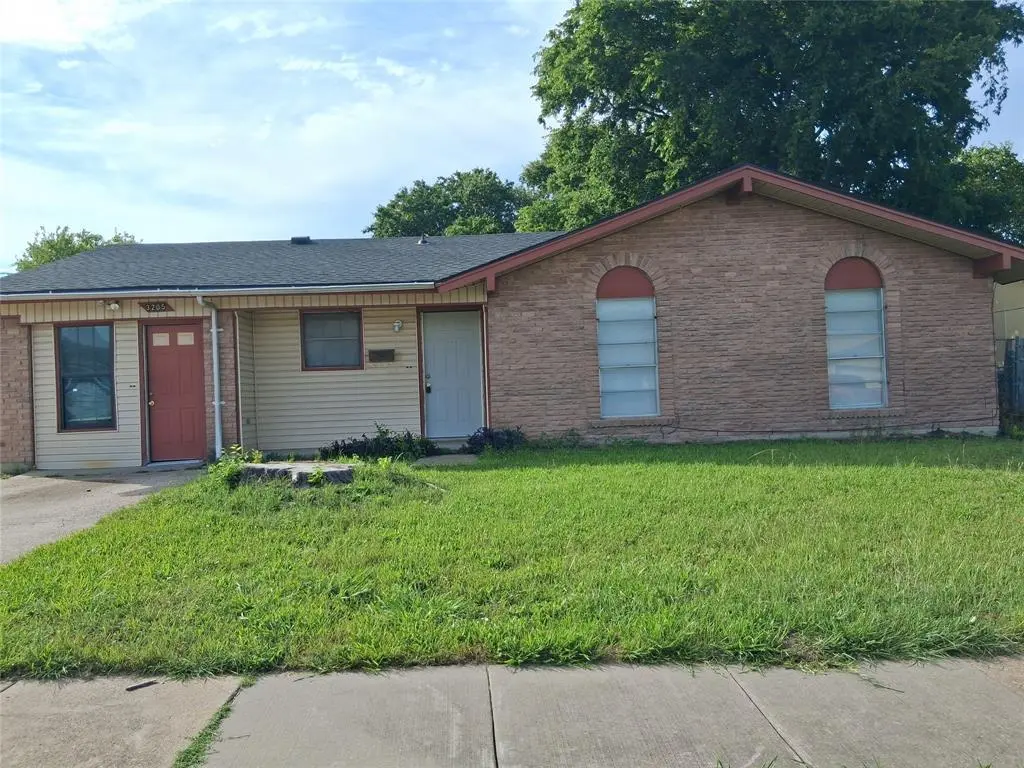
3205 Pacesetter Dr · Dallas, TX
Flood risk 1/10 · Minimal
- FEMA flood zone
- X (unshaded)
- Chance of flooding over 30 yrs
- 0.0%
- Est. flood insurance / yr
- $507 – $1,088
Fire risk 3/10 · Minor
- Est. fire insurance / yr
- $1,222 – $2,270
Heat risk 7/10 · Major
- Hot days now (above 110°F)
- 7 days/yr
- Hot days in 30 yrs
- 24 days/yr
Wind risk 6/10 · Moderate
- Chance of severe wind over 30 yrs
- 27.0%
Air-quality risk 2/10 · Minimal
- Unhealthy air days now
- 1 days/yr
- Unhealthy air days in 30 yrs
- 2 days/yr
Risk factors via First Street. Map © Google.
Why this score? — see what drove the D+ grade
The composite is a weighted blend of 9 inputs, each scored 0–100. Each bar is that input's sub-score; the figure is the points it added to the 100-point composite (weight × sub-score).
- Cash flow +16.4/30.0
- ARV discount +10.5/15.0
- DSCR +5.1/10.0
- 1% rule +4.9/10.0
- Livability +4.0/5.0
- Schools +2.8/10.0
- Condition / age +2.5/5.0
- Rent growth +1.8/5.0
- Appreciation +0.0/10.0
$200,000
🖨 Deal sheet (PDF) 📄 Offer letter ✓ Due diligence
Listing remarks MLS
NEEDS WORK!!!!!INVESTORS WELCOMED
Key facts
- 8,189 sq ft lot
- Built 1972
- Listed 20 days
Property features AI
Finance
- Financial info: Listing terms include Cash, Conventional, FHA, and VA loan; Loan type treated as clear; No second mortgage indicated
- HOA & community: No homeowners association
Exterior
- Parking: No garage or covered parking (parking listed as Other)
- Utilities: City water; City sewer; Electric service available; Municipal utility district: No
- Home design: Single-family residence; Residential property; One story; Property not attached
- Construction: Built in 1972; Brick, frame, siding, and wood construction; Composition roof; Slab foundation
- Exterior features: Curbs and sidewalks; Concrete surfaces; City water and city sewer; Lot less than 0.5 acre; Subdivision: Highland Hills West; Directions: From I-45 S take exit 277 for Simpson Stuart Rd; turn right onto Simpson Stuart Rd, left onto Highland Hills Dr, left onto Bonnie View Rd, then right onto Pacesetter Dr
Interior
- Kitchen: Dishwasher; Microwave; Kitchen plumbed for gas
- Bedrooms: Three bedrooms (all on the main level)
- Flooring: Luxury vinyl plank flooring
- Bathrooms: One full bathroom
- Heating & cooling: Central heating (natural gas); Central air conditioning (electric)
- Interior features: Granite counters; Five rooms total; One living area; One dining area; One-level layout
- Laundry & utility: Utility room; Electric dryer hookup
Neighborhood map
What this means for you Summary
Snapshot
- This is a 3-bed/1.5-bath single-family listed at $200k.
Deal economics
- At list price, monthly cash flow is $113 ($1k/yr) — positive.
- The deal already cash-flows at list — no discount required.
- To meet the 1% rule (rent ≥ 1% of price), the offer needs to be $198k (1.1% below list).
- Recommended offer: $197k (1.5% below list) — sets the bar for market timing.
- Cap rate 7.0% vs local median 2.3% in Dallas — top-decile yield for the area; either an underpriced asset or a hidden risk that comps aren't pricing in. Stress-test before assuming the spread holds.
Location & tenants
- Location reads 81/100 on livability (#24 in TX, #1,380 nationally) — a professional / high-income tenant draw. Strengths: amenities A+, commute A+, housing A+; Watch: crime F.
- Dallas ISD (urban): math 31% / reading 36% proficiency, ranked #559 of 826 in TX (top 68%) — families likely to look elsewhere, expect single-tenant / working-renter base with shorter leases; 83% free/reduced lunch — lower-income household profile, screen leases tightly.
- Zoned schools: J N Ervin El (math 17% / reading 20%, grade F, #3,759 of 4,322 statewide, top 88%, 646 students, 98% FRL); Kennedy-Curry Middle (math 29% / reading 20%, grade F, #1,279 of 1,662 statewide, top 78%, 626 students, 100% FRL); Wilmer-Hutchins H S (math 14% / reading 29%, grade F, #1,377 of 1,632 statewide, top 85%, 1,020 students, 73% FRL).
- Zoned-school proficiency averages 22% at this address vs 34% district-wide (-12 pts) — the specific schools serving this property underperform the Dallas ISD average; the district grade overstates school quality for this exact location.
- Market conditions: Rents soft (-2.8%/yr); 218 active listings in the ZIP; 34 comparable units currently listed for rent nearby; rentals leasing fast (median 10d on market — plan ~1-2 weeks tenant-placement turnaround); 12,577 units permitted in Dallas County in 2024 (6,829 in 5+ unit buildings).
- This rent runs 44% of the median local income ($54k/yr) — at the standard rent-burdened threshold; future hikes will face affordability resistance.
Forward outlook
- Local home prices are declining (-3.0%/yr); year-one equity from $1k of loan paydown is wiped out by about $6k of value loss. Plan a longer hold.
- Dallas County population projected at +35% by 2050 — long-run rental-demand tailwind backs the buy-and-hold thesis.
Negotiation context
- It's been on market 20 days — a 2% lower offer ($197k) is reasonable based on typical stale-listing flexibility.
- 2 sale attempts since 18y ago with the ask held roughly flat each time — persistent listings suggest the price (not the market) is what's stuck; bring a comps-based counter.
Risks & watch-outs
- Climate carrying-cost: major wind risk, 27% chance of damaging wind over 30y; extreme-heat days projected 7→24/yr by 2055 (HVAC capex compounding) — expect insurance premiums to compound above CPI over the hold.
Questions for the listing agent
- Built in 1972 — when were the roof, HVAC, electrical panel, plumbing, and water heater last replaced?
- Is there a deadline driving the sale (1031 exchange, divorce, estate, relocation)? That informs how much negotiation room exists.
- Crime grade is F in this area — have there been break-ins, vandalism, or insurance claims at this property in the last 3 years? What carrier currently insures it and at what premium?
- The area grade is low — what's the realistic commute time and amenity access for the typical tenant pool here? Any planned neighborhood developments (good or bad) we should know about?
- What's the average days-on-market for RENTAL listings here right now (not sales)? A rising rental-DOM trend means longer vacancies and softer asking-rent achievability than the comps imply.
- What's the recent tenant-quality profile in this submarket — average credit score on applications, eviction rate, late-payment / NSF rate, and stable-employment percentage? A property-management company in the area should have these aggregated.
- How much new for-sale + rental construction is in the pipeline within 1–3 miles? Heavy new supply typically softens prices + rents 12–24 months out; constrained supply supports both.
Investment metrics
- 1% rule
- 0.99% ✗
- Cap rate
- 6.97%
- Cash-on-cash
- 2.41%
- DSCR
- 1.11
- GRM
- 8.4
CMA / ARV
- ARV (on-the-fly)
- $214,200
- Comps found
- 12
Show comp detail 12 sales within ~0.75 mi
| Address | Dist | Beds/Ba | Sqft | Sold | Price | $/sf | Match |
|---|---|---|---|---|---|---|---|
| 6415 Cinnamon Oaks Dr | 0.23mi | 4/2.0 (+1) | 1,296 (+3%) | 0mo | $220,000 | $170 | 77 |
| 6547 Tioga Pl | 0.55mi | 3/1.0 | 1,203 (-4%) | 2mo | $144,900 | $120 | 63 |
| 3464 Pinebrook Dr | 0.44mi | 3/1.5 | 1,149 (-9%) | 2mo | $200,000 | $174 | 63 |
| 2914 Midway Plaza Blvd | 0.53mi | 3/1.5 | 1,347 (+7%) | 2mo | $200,000 | $148 | 62 |
| 3474 Pacesetter Dr | 0.49mi | 3/1.5 | 1,164 (-8%) | 3mo | $189,500 | $163 | 62 |
| 3110 Palo Alto Dr | 0.47mi | 2/1.0 (-1) | 1,198 (-5%) | 2mo | $150,000 | $125 | 61 |
| 6544 Cinnamon Oaks Dr | 0.38mi | 3/1.5 | 1,073 (-15%) | 2mo | $205,000 | $191 | 55 |
| 3528 Silverhill Dr | 0.61mi | 4/2.0 (+1) | 1,203 (-4%) | 3mo | $190,000 | $158 | 55 |
| 6437 Leana Ave | 0.65mi | 3/1.0 | 1,164 (-8%) | 1mo | $209,900 | $180 | 54 |
| 6227 Teague Dr | 0.62mi | 3/2.0 | 1,142 (-9%) | 0mo | $220,000 | $193 | 53 |
| 2447 Naoma St | 0.51mi | 3/2.0 | 1,448 (+15%) | 4mo | $350,000 | $242 | 46 |
| 2934 Morgan Dr | 0.65mi | 3/1.0 | 1,080 (-14%) | 1mo | $175,000 | $162 | 43 |
Match score weights: distance 35% · size 25% · config 20% · recency 20%. Top-matched comps best support the ARV.
Projected returns pro-forma
-3.0% appreciation · 0.0% rent growth · sell at horizon
- IRR
- -16.0%
- Equity multiple
- 0.45×
- Total profit
- $-30,958
- Equity at exit
- $29,821
- IRR
- -14.5%
- Equity multiple
- 0.29×
- Total profit
- $-39,834
- Equity at exit
- $17,292
Cash invested: $56,000 (down + closing). Projections, not guarantees.
Landlord ↔ Tenant lean methodology
- Overall (STATE)
- 87 Strongly Landlord-Friendly
- State Texas
- 87 Strongly Landlord-Friendly · R+5
- County
- — inherits STATE
- City
- — inherits STATE
ZIP-level market 75241
- Home prices YoY
- -16.9%
- Rents YoY
- -2.8%
- Active inventory
- 218
- Price-to-rent
- 8.4×
Monthly cashflow live
- Estimated rent
- $1,979 high interval (Pro) →
- Mortgage (P&I)
- −$1,049
- Tax from tax record
- −$318 /mo · $3,818/yr
- Insurance
- −$83
- HOA
- −$0
- Vacancy / Maint / Mgmt
- −$415
- Net cashflow
- $113
Break-even live
Sensitivity live
| Price | -10% $226 | -5% $169 | +0% $113 | +5% $56 | +10% $-1 |
|---|---|---|---|---|---|
| Rent | -10% $-44 | -5% $35 | +0% $113 | +5% $191 | +10% $269 |
| Rate | -1.0pp $213 | -0.5pp $164 | base $113 | +0.5pp $61 | +1.0pp $8 |
UW: 25.0% down · 7.5% · 30yr · 1.5% tax · 5.0% vac · 8.0% maint · 8.0% mgmt
Financing live
Cash to close
- Down payment
- $50,000
- Closing costs
- $6,000
- Reserves months
- —
- Total cash needed
- —
Loan-product check · same deal, 3 products live
Conventional
25% down · 7.5% · 30yr
- Down + closing
- —
- Monthly P&I
- —
- Monthly cashflow
- —
- DSCR
- —
- Eligible?
- —
Personal DTI + credit; lowest rate.
DSCR
20% down · 8.5% · 30yr
- Down + closing
- —
- Monthly P&I
- —
- Monthly cashflow
- —
- DSCR
- —
- Eligible?
- —
No personal income docs; deal must DSCR.
Hard money
10% down · 12.0% · 12mo
- Down + closing
- —
- Monthly P&I
- —
- Monthly cashflow
- —
- DSCR
- —
- Eligible?
- —
Short-term bridge; refi at stabilization.
Rent comps 34 comps
| Address | Beds | Baths | Sqft | Rent | $/sqft | DOM | Units | Dist |
|---|---|---|---|---|---|---|---|---|
| 3210 Little River Dr Dallas, TX | 3.0 | 2.0 | 1202 | $1,950 | $1.62 | 5d | 1 | 0.10mi |
| 3015 Flask Dr Dallas, TX | 3.0 | 2.0 | 1267 | $1,875 | $1.48 | 45d | 1 | 0.24mi |
| 6327 Hidden Trail Dr Dallas, TX | 3.0 | 2.0 | 1187 | $1,795 | $1.51 | 45d | 1 | 0.29mi |
| 6152 Balcony Ln Dallas, TX | 4.0 | 2.5 | 1670 | $1,800 | $1.08 | 19d | 1 | 0.37mi |
| 6520 Warm Moon Ln Dallas, TX | 4.0 | 2.0 | 1237 | $1,995 | $1.61 | 5d | 1 | 0.39mi |
| 6436 Moonhill Dr Dallas, TX | 4.0 | 2.0 | 1200 | $1,961 | $1.63 | 3d | 1 | 0.42mi |
| 2919 N El Centro Way Dallas, TX | 4.0 | 2.0 | 1294 | $1,800 | $1.39 | 9d | 1 | 0.46mi |
| 7312 Sierra Way Dallas, TX | 3.0 | 2.0 | 1439 | $1,900 | $1.32 | 3d | 1 | 0.46mi |
| 2525 Lyola St Dallas, TX | 3.0 | 2.0 | 1080 | $1,895 | $1.75 | 45d | 1 | 0.61mi |
| 3522 Tioga St Dallas, TX | 4.0 | 3.0 | 1438 | $2,095 | $1.46 | 1d | 1 | 0.63mi |
| 3522 Tioga St Dallas, TX | 4.0 | 3.0 | 1438 | $2,095 | $1.46 | 5d | 1 | 0.63mi |
| 3131 Simpson Stuart Rd Dallas, TX | 1.0–3.0 | 1.0–2.0 | 1024 | $1,694 | $1.65 | 1d | 31 | 0.64mi |
| 2918 Morgan Dr Dallas, TX | 4.0 | 2.0 | 1610 | $2,500 | $1.55 | 26d | 1 | 0.68mi |
| 3623 Softcloud Dr Dallas, TX | 3.0 | 2.0 | 1477 | $1,910 | $1.29 | 45d | 1 | 0.70mi |
| 6654 Cool Morn Dr Dallas, TX | 3.0 | 2.0 | 1446 | $2,300 | $1.59 | 45d | 1 | 0.73mi |
| 3440 Simpson Stuart Rd Dallas, TX | 1.0–3.0 | 1.0–2.0 | 942 | $2,103 | $2.23 | 3d | 9 | 0.76mi |
| 2809 Gooch St Dallas, TX | 4.0 | 2.0 | 1816 | $2,650 | $1.46 | 9d | 1 | 0.81mi |
| 2842 Pall Mall Ave Dallas, TX | 4.0 | 2.0 | 1584 | $2,095 | $1.32 | 26d | 1 | 0.85mi |
| 5761 Highland Hills Dr Dallas, TX | 1.0–3.0 | 1.0–2.0 | 1040 | $1,749 | $1.68 | 5d | 7 | 0.89mi |
| 5850 Highland Hills Dr Dallas, TX | 2.0–4.0 | 1.0–2.0 | 910 | $1,097 | $1.21 | 0d | 8 | 0.92mi |
| 2520 Fatima Ave Dallas, TX | 3.0 | 2.0 | 1176 | $1,950 | $1.66 | 9d | 1 | 0.96mi |
| 2703 Kool Ave Dallas, TX | 3.0 | 2.0 | 1248 | $1,700 | $1.36 | 26d | 1 | 0.97mi |
| 2111 Crouch Rd Dallas, TX | 1.0–2.0 | 1.0–2.0 | 866 | $1,277 | $1.47 | 8d | 1 | 0.97mi |
| 2602 Ripple Rd Dallas, TX | 3.0 | 2.0 | 1232 | $1,700 | $1.38 | 45d | 1 | 1.03mi |
| 5821 Bonnie View Rd Dallas, TX | 1.0–3.0 | 1.0–2.0 | 820 | $1,101 | $1.34 | 9d | 7 | 1.12mi |
| 6445 Baraboo Dr Dallas, TX | 4.0 | 1.5 | 1218 | $1,650 | $1.35 | 45d | 1 | 1.19mi |
| 6115 Flagstaff Dr Dallas, TX | 3.0 | 1.5 | 1522 | $1,696 | $1.11 | 9d | 1 | 1.24mi |
| 3806 Castle Hills Dr Dallas, TX | 4.0 | 2.0 | 1422 | $1,900 | $1.34 | 18d | 1 | 1.32mi |
| 5724 Lazy River Cir Dallas, TX | 4.0 | 2.0 | 1863 | $4,000 | $2.15 | 0d | 1 | 1.40mi |
| 3835 Basswood Dr Dallas, TX | 3.0 | 2.0 | 1000 | $1,625 | $1.62 | 26d | 1 | 1.43mi |
| 6347 Racer Summit Dr Dallas, TX | 3.0 | 2.0 | 1175 | $1,965 | $1.67 | 26d | 1 | 1.43mi |
| 6319 Crosswood Ln Dallas, TX | 3.0 | 2.0 | 1316 | $2,060 | $1.57 | 22d | 1 | 1.47mi |
| 3528 Keyridge Dr Dallas, TX | 3.0 | 2.0 | 1362 | $1,795 | $1.32 | 22d | 1 | 1.48mi |
| 1754 E Red Bird Ln Dallas, TX | 3.0 | 1.5 | 1115 | $1,675 | $1.50 | 9d | 1 | 1.48mi |
Listing history 13 events
-
2026-06-21days on market $200,000 Active 20 DOM
-
2026-06-18days on market $200,000 Active 17 DOM
-
2026-06-17days on market $200,000 Active 16 DOM
-
2026-06-16days on market $200,000 Active 15 DOM
-
2026-06-15days on market $200,000 Active 14 DOM
-
2026-06-13days on market $200,000 Active 12 DOM
-
2026-06-09days on market $200,000 Active 8 DOM
-
2026-06-08days on market $200,000 Active 7 DOM
-
2026-06-07days on market $200,000 Active 6 DOM
-
2026-06-04days on market $200,000 Active 3 DOM
-
2026-06-03days on market $200,000 Active 2 DOM
-
2026-06-02remarks 409-char remark
-
2026-06-02$200,000 Active 1 DOM
ⓘ Source: listings_history table (triggers on properties + properties_extension) + one-shot
backfill from property_details.listing_events for pre-trigger history.
Tax reassessment forecast TX · Resets to sale price
- Current annual tax
- $3,818 · $318/mo
- Projected year-2 tax
- $3,818 · $318/mo
- Expected delta
- $0/yr ($0/mo · -0.0%)
ⓘ Screening estimate from a state-policy table — verify with the county assessor before closing.
Climate risk First Street
- Flood 1/10 Low FEMA zone X (unshaded) · 0% chance over 30 yrs
- Wildfire 3/10 Moderate
- Heat 7/10 Severe 7 d/yr ≥110°F today · 24 d/yr by 30 yrs out
- Wind 6/10 Major 27% chance of damaging wind over 30 yrs
- Air quality 2/10 Low 1 unhealthy d/yr today · 2 by 30 yrs out
Nearby sold comps map
Loading sold comps map…
Walkable amenities ~0.75 mi
Loading nearby amenities…
Taxation est. · year 1
- Rental income
- $23,742
- − Mortgage interest
- −$11,203
- − Property taxes
- −$3,818
- − Insurance
- −$1,000
- − Repairs & maintenance
- −$1,899
- − Management
- −$1,899
- − Depreciation
- −$5,818
- Taxable loss
- −$1,896
- Est. tax savings @ 24.0%
- +$455
- After-tax cash flow
- $1,807/yr
For passive investors: Depreciation is non-cash, so a rental often shows a tax loss while cash-flowing — sheltering income. Rental losses are passive: they offset passive income freely, and up to $25,000/yr can offset ordinary (W-2) income if you actively participate and your MAGI is under $100k (phasing out to $0 by $150k); unused losses carry forward. On sale, claimed depreciation is recaptured at up to 25%, and gains may owe capital-gains tax (a 1031 exchange can defer both). Figures are a year-1 estimate at your 24.0% rate — not tax advice; consult a CPA.
Schools (NCES district)
- District
- Dallas ISD
- NCES district ID
- 4816230
- Math proficiency
- 31% ▼ -16.00%
- Reading proficiency
- 36% ▼ -4.00%
- Median HH income
- $42,881
- Composite
- 28.41/100
- National rank
- #6763
- State rank
- #559 of 826 in TX
Livability — Dallas
- Score
- 81/100
- State rank
- #24
- US rank
- #1380
Category grades
Schools grade is shown separately in the Schools card above.
Census & demographics
- Census place
- Dallas, TX
- County
- Dallas County · 2,612,404 people
- City population
- 1,168,437
- Metro
- Dallas-Fort Worth-Arlington, TX
- Population (ZIP)
- 33,840
- Household income
- $53,998
- Rent vs Own
- Severe rent burden
- 1076.0
Population outlook (Dallas County) Hauer SSP2
- Today (2025)
- 2,979,839 people
- By 2030
- 3,191,823 · +7.1%
- By 2040
- 3,619,611 · +21.5%
- By 2050
- 4,026,915 · +35.1%
- By 2075
- 4,957,073 · +66.4%
- By 2100
- 5,508,725 · +84.9%
Race, ethnicity, and origin ACS 2023
- Neighborhood character
- Majority Black (62%)
- Race & ethnicity
- Black 62% Hispanic / Latino 30% Two or more races 8% White 5% Native American 2%
- Hispanic origin (detail)
- Mexican 24%
- Foreign-born
- 13% · Canada
- Languages at home
- 73% English-only · Spanish 25%
Political lean MEDSL · Dallas
- 2024 margin
- Strong D (+22.2) · D 60.2% · R 38.0% · Other 1.8%
- 2008→2024 swing
- +6.9pp toward D · 2008: 15.3pp · 2024: 22.2pp
- All cycles
- 2024: D+22.2 2020: D+31.6 2016: D+26.2 2012: D+15.4 2008: D+15.3
Not yet ingested
- Civics
- —
Market trends
- HPI YoY
- ▼ -72.36%
- Current HPI
- 356.2348
- Rent YoY
- ▼ -2.75%
- Metro
- Dallas-Fort Worth-Arlington, TX
- State GDP YoY
- ▲ 3.95%
- F500 in state
- 110
Industry mix (Fortune 500 HQ in TX)
| Industry | F500 HQs | Revenue |
|---|---|---|
| Energy | 16 | $1,198B |
|
||
| Technology | 5 | $198B |
|
||
| Engineering / Construction | 4 | $72B |
|
||
| Energy Services | 3 | $60B |
|
||
| Utilities | 3 | $41B |
|
||
| Healthcare | 2 | $330B |
|
||
Price history
+710.8% since first listed8 events — show timeline
- 2026-06-01 Listed $200,000 NTREIS
- 2022-05-22 Price Changed $1,500 RENT.
- 2009-03-09 Sold (Public Records) — Public Records
- 2008-10-13 Sold (MLS) — NTREIS
- 2008-09-19 Listing Removed — NTREIS
- 2008-07-07 Listed $24,668 NTREIS
- 2008-06-11 Sold (Public Records) — Public Records
- 2007-01-09 Sold (Public Records) — Public Records
Property tax history
+9.8%/yrLatest (2025): $3,818 · +25.5% YoY. Source: county tax records.
Cash-flow waterfall
monthlySold comps — $/sqft
last 12 mo · ≤1 miLoading sold comps…