2281 Aspen Dr · Dallas, TX
Flood risk 1/10 · Minimal
- FEMA flood zone
- X (unshaded)
- Chance of flooding over 30 yrs
- 0.0%
- Est. flood insurance / yr
- $507 – $1,088
Fire risk 1/10 · Minimal
- Est. fire insurance / yr
- $1,222 – $2,270
Heat risk 7/10 · Major
- Hot days now (above 110°F)
- 7 days/yr
- Hot days in 30 yrs
- 25 days/yr
Wind risk 6/10 · Moderate
- Chance of severe wind over 30 yrs
- 27.0%
Air-quality risk 2/10 · Minimal
- Unhealthy air days now
- 2 days/yr
- Unhealthy air days in 30 yrs
- 2 days/yr
Risk factors via First Street. Map © Google.
Why this score? — see what drove the C- grade
The composite is a weighted blend of 9 inputs, each scored 0–100. Each bar is that input's sub-score; the figure is the points it added to the 100-point composite (weight × sub-score).
- Cash flow +21.0/30.0
- 1% rule +8.3/10.0
- DSCR +6.7/10.0
- ARV discount +5.6/15.0
- Livability +4.0/5.0
- Schools +2.8/10.0
- Condition / age +2.5/5.0
- Rent growth +2.4/5.0
- Appreciation +0.0/10.0
$107,500
🖨 Deal sheet 📄 Offer letter ✓ Due diligence
Listing remarks MLS
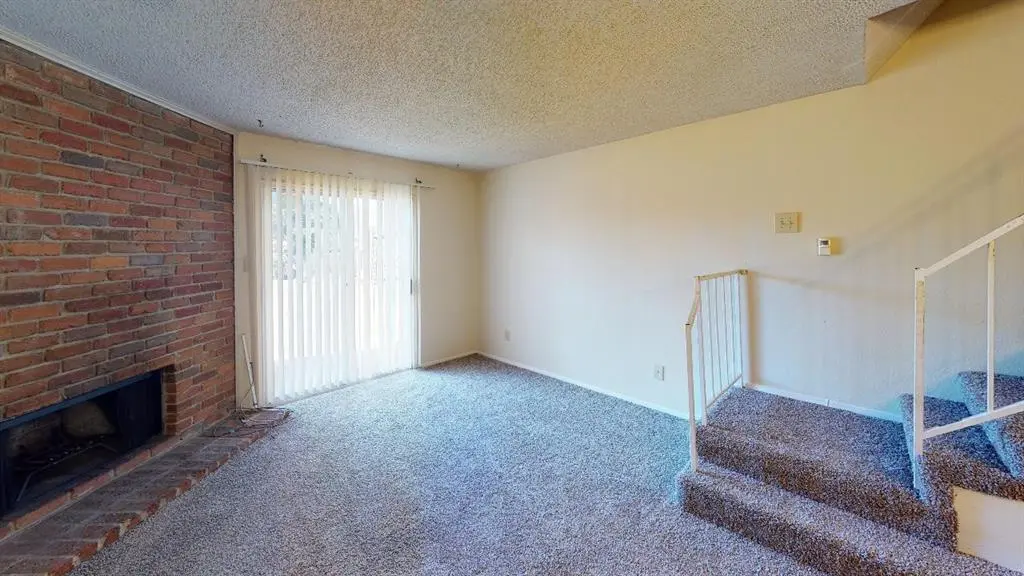
See Virtual tour! Bright and open 2-story townhome with a lovely brick fireplace, spacious bedrooms, and lots of closet space. Both bedrooms are upstairs. Small backyard for pets or kids. Tenant occupied till May 31st, 2026 at a rent rate of $1,155.
Key facts
- Brick fireplace
- Small backyard
- Spacious bedrooms
Tags
Neighborhood map
What this means for you Summary
Snapshot
- This is a 2-bed/2.5-bath townhouse listed at $108k.
Deal economics
- At list price, monthly cash flow is $152 ($2k/yr) — positive.
- The deal already cash-flows at list — no discount required.
- Meets the 1% rule at list price ($1k rent vs $108k).
- Recommended offer: $95k (12.0% below list) — sets the bar for market timing.
- Cap rate 8.0% vs local median 2.3% in Dallas — top-decile yield for the area; either an underpriced asset or a hidden risk that comps aren't pricing in. Stress-test before assuming the spread holds.
Location & tenants
- Location reads 81/100 on livability (#24 in TX, #1,380 nationally) — a professional / high-income tenant draw. Strengths: amenities A+, commute A+, housing A+; Watch: schools C-, crime F.
- Dallas ISD (urban): math 31% / reading 36% proficiency, ranked #559 of 826 in TX (top 68%) — families likely to look elsewhere, expect single-tenant / working-renter base with shorter leases; 83% free/reduced lunch — lower-income household profile, screen leases tightly.
- Market conditions: Rents soft (-0.4%/yr); 179 active listings in the ZIP; 40 comparable units currently listed for rent nearby; rentals at typical pace (median 24d on market — plan ~3-4 weeks tenant-placement turnaround); 45% of comp listings sitting > 30 days — soft ceiling on asking rent; 12,577 units permitted in Dallas County in 2024 (6,829 in 5+ unit buildings).
Forward outlook
- Local home prices are declining (-3.0%/yr); year-one equity from $743 of loan paydown is wiped out by about $3k of value loss. Plan a longer hold.
- Dallas County population projected at +35% by 2050 — long-run rental-demand tailwind backs the buy-and-hold thesis.
Negotiation context
- It's been on market 693 days — a 12% lower offer ($95k) is reasonable based on typical stale-listing flexibility.
- 5 sale attempts since 15y ago; this cycle's ask is 9673% above the opening price — seller raised mid-cycle; expect resistance to lowballs.
Risks & watch-outs
- Climate carrying-cost: major wind risk, 27% chance of damaging wind over 30y; extreme-heat days projected 7→25/yr by 2055 (HVAC capex compounding) — expect insurance premiums to compound above CPI over the hold.
Questions for the listing agent
- It's been on market 693 days. Have you received any prior offers? Is the seller open to a 12% concession, seller financing, or rate buy-down credit?
- What does the HOA fee cover, when was the last increase, and are there any pending special assessments or reserve-fund shortfalls?
- Why hasn't it sold? Are there any deal-killer items the seller is aware of (foundation, flood, title, zoning, code violations)?
- Is there a deadline driving the sale (1031 exchange, divorce, estate, relocation)? That informs how much negotiation room exists.
- Crime grade is F in this area — have there been break-ins, vandalism, or insurance claims at this property in the last 3 years? What carrier currently insures it and at what premium?
- What's the average days-on-market for RENTAL listings here right now (not sales)? A rising rental-DOM trend means longer vacancies and softer asking-rent achievability than the comps imply.
- What's the recent tenant-quality profile in this submarket — average credit score on applications, eviction rate, late-payment / NSF rate, and stable-employment percentage? A property-management company in the area should have these aggregated.
- How much new for-sale + rental construction is in the pipeline within 1–3 miles? Heavy new supply typically softens prices + rents 12–24 months out; constrained supply supports both.
Investment metrics
- 1% rule
- 1.33% ✓
- Cap rate
- 7.99%
- Cash-on-cash
- 6.07%
- DSCR
- 1.27
- GRM
- 6.3
CMA / ARV
- ARV (median comp)
- $103,109
- List price
- $107,500
- Delta
- 4.26%
- Verdict
- FAIR
- Comps
- 20 within 1.0 mi
Show comp detail 12 sales within ~0.75 mi
| Address | Dist | Beds/Ba | Sqft | Sold | Price | $/sf | Match |
|---|---|---|---|---|---|---|---|
| 9434 Olde Village Ct | 0.09mi | 2/1.5 | 1,110 (-3%) | 1mo | $126,900 | $114 | 86 |
| 9510 Olde Towne Row | 0.12mi | 2/1.5 | 1,110 (-3%) | 0mo | $115,000 | $104 | 86 |
| 9438 Olde Towne Row | 0.07mi | 2/2.5 | 1,140 (0%) | 15mo | $98,900 | $87 | 85 |
| 9483 Olde Towne Row | 0.10mi | 2/2.5 | 1,140 (0%) | 16mo | $130,000 | $114 | 83 |
| 9435 Olde Towne Row | 0.05mi | 2/2.5 | 1,140 (0%) | 19mo | $135,000 | $118 | 82 |
| 2261 Aspen Dr | 0.02mi | 2/2.5 | 1,140 (0%) | 23mo | $145,000 | $127 | 80 |
| 2165 Aspen Dr | 0.14mi | 2/1.5 | 1,110 (-3%) | 8mo | $109,900 | $99 | 79 |
| 9499 Olde Village Ct | 0.10mi | 2/1.5 | 1,110 (-3%) | 10mo | $100,000 | $90 | 78 |
| 2240 Aspen Dr | 0.06mi | 2/1.5 | 1,110 (-3%) | 12mo | $125,000 | $113 | 78 |
| 2131 Aspen Dr | 0.17mi | 2/1.5 | 1,110 (-3%) | 8mo | $138,000 | $124 | 77 |
| 2193 Aspen St | 0.11mi | 2/1.5 | 1,140 (0%) | 20mo | $115,000 | $101 | 74 |
| 2144 Aspen Dr | 0.17mi | 2/1.5 | 1,110 (-3%) | 17mo | $115,000 | $104 | 70 |
Match score weights: distance 35% · size 25% · config 20% · recency 20%. Top-matched comps best support the ARV.
Projected returns pro-forma
-3.0% appreciation · 0.0% rent growth · sell at horizon
- IRR
- -11.2%
- Equity multiple
- 0.61×
- Total profit
- $-11,755
- Equity at exit
- $16,029
- IRR
- -8.5%
- Equity multiple
- 0.56×
- Total profit
- $-13,300
- Equity at exit
- $9,295
Cash invested: $30,100 (down + closing). Projections, not guarantees.
Landlord ↔ Tenant lean methodology
- Overall (STATE)
- 87 Strongly Landlord-Friendly
- State Texas
- 87 Strongly Landlord-Friendly · R+5
- County
- — inherits STATE
- City
- — inherits STATE
ZIP-level market 75227
- Home prices YoY
- -30.9%
- Rents YoY
- -0.4%
- Active inventory
- 179
- Price-to-rent
- 6.3×
Monthly cashflow live
- Estimated rent
- $1,433 high interval (Pro) →
- Mortgage (P&I)
- −$564
- Tax from tax record
- −$216 /mo · $2,597/yr
- Insurance
- −$45
- HOA
- −$155
- Vacancy / Maint / Mgmt
- −$301
- Net cashflow
- $152
Break-even live
UW: 25.0% down · 7.5% · 30yr · 1.5% tax · 5.0% vac · 8.0% maint · 8.0% mgmt
Financing live
Cash to close
- Down payment
- $26,875
- Closing costs
- $3,225
- Reserves months
- —
- Total cash needed
- —
Loan-product check · same deal, 3 products live
Conventional
25% down · 7.5% · 30yr
- Down + closing
- —
- Monthly P&I
- —
- Monthly cashflow
- —
- DSCR
- —
- Eligible?
- —
Personal DTI + credit; lowest rate.
DSCR
20% down · 8.5% · 30yr
- Down + closing
- —
- Monthly P&I
- —
- Monthly cashflow
- —
- DSCR
- —
- Eligible?
- —
No personal income docs; deal must DSCR.
Hard money
10% down · 12.0% · 12mo
- Down + closing
- —
- Monthly P&I
- —
- Monthly cashflow
- —
- DSCR
- —
- Eligible?
- —
Short-term bridge; refi at stabilization.
Rent comps 40 comps
| Address | Beds | Baths | Sqft | Rent | $/sqft | DOM | Units | Dist |
|---|---|---|---|---|---|---|---|---|
| 9467 Olde Towne Row Dallas, TX | 2.0 | 1.5 | 1110 | $975 | $0.88 | 43d | 1 | 0.06mi |
| 9503 Olde Towne Row Dallas, TX | 2.0 | 2.5 | 1140 | $1,350 | $1.18 | 43d | 1 | 0.09mi |
| 2198 Aspen Dr Dallas, TX | 2.0 | 1.5 | 1110 | $1,300 | $1.17 | 4d | 1 | 0.12mi |
| 2194 Aspen Dr Dallas, TX | 2.0 | 1.5 | 1110 | $1,200 | $1.08 | 7d | 1 | 0.12mi |
| 9415 Bruton Rd Dallas, TX | 1.0–3.0 | 1.0–2.0 | 885 | $924 | $1.04 | 43d | 1 | 0.20mi |
| 1937 Red Cloud Dr Dallas, TX | 3.0 | 2.0 | 1196 | $1,695 | $1.42 | 43d | 1 | 0.55mi |
| 9645 Limestone Dr Dallas, TX | 3.0 | 2.0 | 1178 | $2,000 | $1.70 | 43d | 1 | 0.55mi |
| 9921 Cedar Mountain Cir Dallas, TX | 3.0 | 2.0 | 1202 | $1,895 | $1.58 | 43d | 1 | 0.61mi |
| 1939 Naira Dr Dallas, TX | 3.0 | 2.0 | 1415 | $1,850 | $1.31 | 43d | 1 | 0.68mi |
| 9666 Scyene Rd Dallas, TX | 1.0–2.0 | 1.0–2.0 | 753 | $1,286 | $1.71 | 2d | 21 | 0.70mi |
| 10216 Blackjack Oaks Dr Dallas, TX | 3.0 | 2.0 | 1453 | $1,865 | $1.28 | 24d | 1 | 0.77mi |
| 8840 Milverton Dr Dallas, TX | 3.0 | 1.5 | 1016 | $1,599 | $1.57 | 43d | 1 | 0.78mi |
| 10212 Hillhouse Ln Dallas, TX | 2.0 | 1.0 | 1183 | $1,499 | $1.27 | 7d | 1 | 0.79mi |
| 2255 Nantucket Village Dr Dallas, TX | 3.0 | 2.0 | 1037 | $1,625 | $1.57 | 43d | 1 | 0.79mi |
| 2041 New Haven Dr Dallas, TX | 3.0 | 1.5 | 1362 | $1,720 | $1.26 | 16d | 1 | 0.81mi |
| 10236 Hillhouse Ln Dallas, TX | 3.0 | 2.0 | 1323 | $1,600 | $1.21 | 43d | 1 | 0.83mi |
| 10320 Nantucket Village Ct Dallas, TX | 3.0 | 2.0 | 1037 | $1,645 | $1.59 | 43d | 1 | 0.88mi |
| 10315 Limestone Dr Dallas, TX | 2.0 | 2.0 | 1068 | $1,450 | $1.36 | 43d | 1 | 0.89mi |
| 9456 Culberson St Dallas, TX | 3.0 | 2.0 | 1170 | $1,800 | $1.54 | 43d | 1 | 0.90mi |
| 10328 Chelmsford Dr Dallas, TX | 3.0 | 1.0 | 1061 | $1,300 | $1.23 | 43d | 1 | 0.92mi |
| 10206 Shayna Dr Dallas, TX | 3.0 | 2.0 | 1253 | $1,850 | $1.48 | 14d | 1 | 0.93mi |
| 2315 Summit Ln Dallas, TX | 3.0 | 2.0 | 1200 | $1,800 | $1.50 | 7d | 1 | 0.95mi |
| 10348 Wood Heights Dr Dallas, TX | 3.0 | 2.5 | 1358 | $2,000 | $1.47 | 43d | 1 | 1.00mi |
| 8323 Lapanto Ln Unit B Dallas, TX | 3.0 | 1.5 | 968 | $1,375 | $1.42 | 43d | 1 | 1.00mi |
| 2708 Briarbank Cir Dallas, TX | 3.0 | 2.0 | 1349 | $1,840 | $1.36 | 3d | 1 | 1.00mi |
| 1705 Allentown Dr Dallas, TX | 3.0 | 2.0 | 1195 | $1,725 | $1.44 | 24d | 1 | 1.05mi |
| 9740 Stonewood Dr Dallas, TX | 3.0 | 2.0 | 1250 | $1,961 | $1.57 | 6d | 1 | 1.05mi |
| 8534 Bearden Ln Dallas, TX | 3.0 | 2.0 | 1332 | $1,600 | $1.20 | 24d | 1 | 1.05mi |
| 9575 Gonzales Dr Dallas, TX | 2.0 | 2.0 | 1259 | $1,450 | $1.15 | 14d | 1 | 1.05mi |
| 9911 Crystal Valley Way Dallas, TX | 3.0 | 2.0 | 1192 | $1,750 | $1.47 | 24d | 1 | 1.06mi |
| 2540 Winter Oak St Dallas, TX | 3.0 | 2.0 | 994 | $1,750 | $1.76 | 20d | 1 | 1.09mi |
| 10503 Leroy Ct Dallas, TX | 3.0 | 2.0 | 1253 | $1,941 | $1.55 | 7d | 1 | 1.09mi |
| 2603 Winter Oak St Dallas, TX | 3.0 | 2.0 | 1004 | $1,921 | $1.91 | 43d | 1 | 1.10mi |
| 10611 Woodleaf Dr Dallas, TX | 2.0 | 2.0 | 959 | $1,650 | $1.72 | 7d | 1 | 1.12mi |
| 10611 Woodleaf Dr Dallas, TX | 2.0 | 2.0 | 959 | $1,695 | $1.77 | 16d | 1 | 1.12mi |
| 10121 Muskogee Dr Dallas, TX | 3.0 | 2.0 | 1381 | $1,900 | $1.38 | 24d | 1 | 1.12mi |
| 2423 Lolita Dr Dallas, TX | 3.0 | 2.0 | 1040 | $1,650 | $1.59 | 3d | 1 | 1.19mi |
| 1415 Amity Ln Dallas, TX | 3.0 | 2.0 | 1364 | $1,780 | $1.30 | 43d | 1 | 1.35mi |
| 10410 Cymbal Dr Dallas, TX | 2.0 | 1.5 | 1128 | $1,400 | $1.24 | 15d | 1 | 1.35mi |
| 101 Crystalwood Dr Mesquite, TX | 3.0 | 2.0 | 1500 | $2,090 | $1.39 | 19d | 1 | 1.43mi |
HOA detail
- Monthly dues
- $155 · $1,860/yr
Listing history 26 events
-
2026-06-18days on market $107,500 Active 693 DOM
-
2026-06-17days on market $107,500 Active 692 DOM
-
2026-06-16days on market $107,500 Active 691 DOM
-
2026-06-15days on market $107,500 Active 690 DOM
-
2026-06-13days on market $107,500 Active 688 DOM
-
2026-06-09days on market $107,500 Active 684 DOM
-
2026-06-08days on market $107,500 Active 683 DOM
-
2026-06-07days on market $107,500 Active 682 DOM
-
2026-06-04days on market $107,500 Active 679 DOM
-
2026-06-03days on market $107,500 Active 678 DOM
-
2026-06-02days on market $107,500 Active 677 DOM
-
2026-06-02days on market $107,500 Active 676 DOM
-
2026-05-31days on market $107,500 Active 675 DOM
-
2026-05-06$1,100
-
2026-02-26price $107,500 249-char remark
Show marketing remark (249 chars)
See Virtual tour! Bright and open 2-story townhome with a lovely brick fireplace, spacious bedrooms, and lots of closet space. Both bedrooms are upstairs. Small backyard for pets or kids. Tenant occupied till May 31st, 2026 at a rent rate of $1,155.
-
2025-05-13historical $1,050
-
2025-05-02price $1,050
-
2025-04-22$1,150
-
2025-02-23status Active 249-char remark
Show marketing remark (249 chars)
See Virtual tour! Bright and open 2-story townhome with a lovely brick fireplace, spacious bedrooms, and lots of closet space. Both bedrooms are upstairs. Small backyard for pets or kids. Tenant occupied till May 31st, 2026 at a rent rate of $1,155.
-
2025-02-14historical Active Option Contract 249-char remark
Show marketing remark (249 chars)
See Virtual tour! Bright and open 2-story townhome with a lovely brick fireplace, spacious bedrooms, and lots of closet space. Both bedrooms are upstairs. Small backyard for pets or kids. Tenant occupied till May 31st, 2026 at a rent rate of $1,155.
-
2024-07-25$115,000 Active 249-char remark
Show marketing remark (249 chars)
See Virtual tour! Bright and open 2-story townhome with a lovely brick fireplace, spacious bedrooms, and lots of closet space. Both bedrooms are upstairs. Small backyard for pets or kids. Tenant occupied till May 31st, 2026 at a rent rate of $1,155.
-
2019-09-24soldstatus
-
2011-04-04soldstatus Closed 223-char remark
Show marketing remark (223 chars)
Great chance to buy good cash flow properties. We have 11 of these for sale. Average lease in the complex is 675 a month. We want to sell all 11 as a package deal. Check them out and bring us an offer. 2 are already leased.
-
2011-03-23status Pending 223-char remark
Show marketing remark (223 chars)
Great chance to buy good cash flow properties. We have 11 of these for sale. Average lease in the complex is 675 a month. We want to sell all 11 as a package deal. Check them out and bring us an offer. 2 are already leased.
-
2011-03-01$23,050 Active 223-char remark
Show marketing remark (223 chars)
Great chance to buy good cash flow properties. We have 11 of these for sale. Average lease in the complex is 675 a month. We want to sell all 11 as a package deal. Check them out and bring us an offer. 2 are already leased.
-
2011-02-10soldstatus $100,000
ⓘ Source: listings_history table (triggers on properties + properties_extension) + one-shot
backfill from property_details.listing_events for pre-trigger history.
Tax reassessment forecast TX · Resets to sale price
- Current annual tax
- $2,597 · $216/mo
- Projected year-2 tax
- $2,597 · $216/mo
- Expected delta
- $0/yr ($0/mo · 0.0%)
ⓘ Screening estimate from a state-policy table — verify with the county assessor before closing.
Climate risk First Street
- Flood 1/10 Low FEMA zone X (unshaded) · 0% chance over 30 yrs
- Wildfire 1/10 Low
- Heat 7/10 Severe 7 d/yr ≥110°F today · 25 d/yr by 30 yrs out
- Wind 6/10 Major 27% chance of damaging wind over 30 yrs
- Air quality 2/10 Low 2 unhealthy d/yr today · 2 by 30 yrs out
Nearby sold comps map
Loading sold comps map…
Walkable amenities ~0.75 mi
Loading nearby amenities…
Taxation est. · year 1
- Rental income
- $17,199
- − Mortgage interest
- −$6,022
- − Property taxes
- −$2,597
- − Insurance
- −$538
- − Repairs & maintenance
- −$1,376
- − Management
- −$1,376
- − HOA
- −$1,860
- − Depreciation
- −$3,127
- Taxable income
- $303
- Est. tax owed @ 24.0%
- −$73
- After-tax cash flow
- $1,754/yr
For passive investors: Depreciation is non-cash, so a rental often shows a tax loss while cash-flowing — sheltering income. Rental losses are passive: they offset passive income freely, and up to $25,000/yr can offset ordinary (W-2) income if you actively participate and your MAGI is under $100k (phasing out to $0 by $150k); unused losses carry forward. On sale, claimed depreciation is recaptured at up to 25%, and gains may owe capital-gains tax (a 1031 exchange can defer both). Figures are a year-1 estimate at your 24.0% rate — not tax advice; consult a CPA.
Schools (NCES district)
- District
- Dallas ISD
- NCES district ID
- 4816230
- Math proficiency
- 31% ▼ -16.00%
- Reading proficiency
- 36% ▼ -4.00%
- Median HH income
- $42,881
- Composite
- 28.41/100
- National rank
- #6763
- State rank
- #559 of 826 in TX
Livability — Dallas
- Score
- 81/100
- State rank
- #24
- US rank
- #1380
Category grades
Schools grade is shown separately in the Schools card above.
Census & demographics
- Census place
- Dallas, TX
- County
- Dallas County · 2,612,404 people
- City population
- 1,168,437
- Metro
- Dallas-Fort Worth-Arlington, TX
- Population (ZIP)
- 58,319
- Household income
- $64,008
- Rent vs Own
- Severe rent burden
- 1679.0
Population outlook (Dallas County) Hauer SSP2
- Today (2025)
- 2,979,839 people
- By 2030
- 3,191,823 · +7.1%
- By 2040
- 3,619,611 · +21.5%
- By 2050
- 4,026,915 · +35.1%
- By 2075
- 4,957,073 · +66.4%
- By 2100
- 5,508,725 · +84.9%
Race, ethnicity, and origin ACS 2023
- Neighborhood character
- Majority Hispanic (62%)
- Race & ethnicity
- Hispanic / Latino 62% Two or more races 35% Black 28% White 8%
- Hispanic origin (detail)
- Mexican 56%
- Foreign-born
- 27% · Canada, Vietnam
- Languages at home
- 44% English-only · Spanish 55%
Political lean MEDSL · Dallas
- 2024 margin
- Strong D (+22.2) · D 60.2% · R 38.0% · Other 1.8%
- 2008→2024 swing
- +6.9pp toward D · 2008: 15.3pp · 2024: 22.2pp
- All cycles
- 2024: D+22.2 2020: D+31.6 2016: D+26.2 2012: D+15.4 2008: D+15.3
Not yet ingested
- Civics
- —
Market trends
- HPI YoY
- ▼ -148.56%
- Current HPI
- 332.3303
- Rent YoY
- ▼ -0.36%
- Metro
- Dallas-Fort Worth-Arlington, TX
- State GDP YoY
- ▲ 3.95%
- F500 in state
- 110
Industry mix (Fortune 500 HQ in TX)
| Industry | F500 HQs | Revenue |
|---|---|---|
| Energy | 16 | $1,198B |
|
||
| Technology | 5 | $198B |
|
||
| Engineering / Construction | 4 | $72B |
|
||
| Energy Services | 3 | $60B |
|
||
| Utilities | 3 | $41B |
|
||
| Healthcare | 2 | $330B |
|
||
Price history
-98.9% since first listed13 events — show timeline
- 2026-05-06 Listed for Rent $1,100 NTREIS
- 2026-02-26 Price Changed $107,500 NTREIS
- 2025-05-13 Rental Removed $1,050 NTREIS
- 2025-05-02 Price Changed $1,050 NTREIS
- 2025-04-22 Listed for Rent $1,150 NTREIS
- 2025-02-23 Relisted — NTREIS
- 2025-02-14 Contingent — NTREIS
- 2024-07-25 Listed $115,000 NTREIS
- 2019-09-24 Sold (Public Records) — Public Records
- 2011-04-04 Sold (MLS) — NTREIS
- 2011-03-23 Pending — NTREIS
- 2011-03-01 Listed $23,050 NTREIS
- 2011-02-10 Sold (Public Records) $100,000 Public Records
Property tax history
+9.7%/yrLatest (2025): $2,597 · +12.9% YoY. Source: county tax records.
Cash-flow waterfall
monthlySold comps — $/sqft
last 12 mo · ≤1 miLoading sold comps…