640 Bradley Rd · Gardendale, AL
Flood risk 1/10 · Minimal
- FEMA flood zone
- X (unshaded)
- Chance of flooding over 30 yrs
- 0.0%
- Est. flood insurance / yr
- $507 – $1,088
Fire risk 4/10 · Minor
- Est. fire insurance / yr
- $916 – $1,700
Heat risk 6/10 · Moderate
- Hot days now (above 106°F)
- 7 days/yr
- Hot days in 30 yrs
- 19 days/yr
Wind risk 6/10 · Moderate
- Chance of severe wind over 30 yrs
- 27.0%
Air-quality risk 4/10 · Minor
- Unhealthy air days now
- 3 days/yr
- Unhealthy air days in 30 yrs
- 8 days/yr
Risk factors via First Street. Map © Google.
Why this score? — see what drove the B grade
The composite is a weighted blend of 9 inputs, each scored 0–100. Each bar is that input's sub-score; the figure is the points it added to the 100-point composite (weight × sub-score).
- Cash flow +30.0/30.0
- ARV discount +13.2/15.0
- DSCR +10.0/10.0
- 1% rule +9.6/10.0
- Livability +3.3/5.0
- Rent growth +2.5/5.0
- Condition / age +2.5/5.0
- Schools +1.8/10.0
- Appreciation +0.0/10.0
$154,000
🖨 Deal sheet 📄 Offer letter ✓ Due diligence
Listing remarks
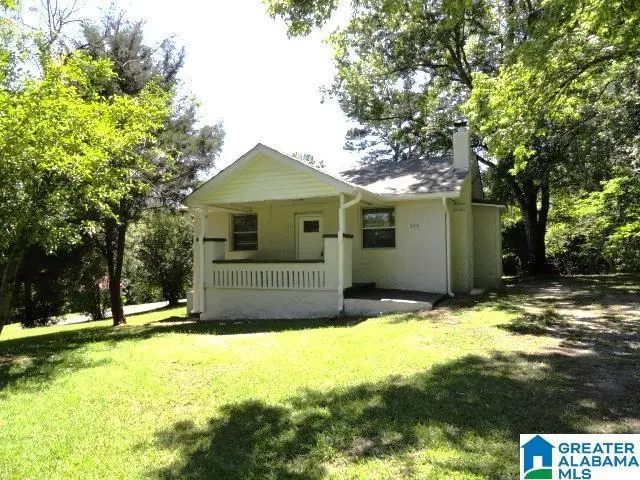
This adorable starter home has been completely remodeled. Sitting on a beautiful lot in the middle of Gardendale New paint, new hardwoods, new fixtures, new roof. You walk up to a covered front porch that opens into a liivingroom-diningroom, that opens into a kitchen with stove, dishwasher and refrigerator. There is two bedrooms and a bath and a half. Down the hall is a laundryroom and a office or large pantry. This home boast of laminated hardwoods through-out and tile bathrooms. And a storage building for your lawn mower and lawn equipment. Close to shopping, restaurants, and schools. Hurry, this one won't last!
Key facts
- Covered front porch
- Laminated hardwoods
- Completely remodeled
Tags
Property features AI
Finance
- HOA & community: Garbage fee billed quarterly
Exterior
- Parking: Detached parking; Driveway parking
- Utilities: Public water; Septic sewer; Internet available (AT&T & Spectrum)
- Home design: Existing single-family property; Crawl space foundation; Stucco exterior
- Construction: Stucco construction
- Exterior features: Open patio; Porch; No pool; No deck; No garden/patio view
Interior
- Kitchen: Laminate countertops; Dishwasher (built-in); Electric oven; Refrigerator
- Bedrooms: Two bedrooms (both on main level)
- Flooring: Hardwood laminate flooring; Tile flooring
- Bathrooms: One full bathroom (main level) with tub/shower combo; One half bathroom (main level)
- Heating & cooling: Central heating (gas); Central air (electric)
- Interior features: Smooth ceilings; Storage building; Attic with pull-down access; Has laundry on the main level; Rooms: living room, dining room, kitchen, laundry, office/study
- Laundry & utility: Main-level laundry room; Washer hookup; Electric dryer hookup; Electric water heater
Neighborhood map
What this means for you Summary
Snapshot
- This is a 2-bed/1.0-bath single-family listed at $154k.
Deal economics
- At list price, monthly cash flow is $790 ($9k/yr) — positive.
- The deal already cash-flows at list — no discount required.
- Meets the 1% rule at list price ($2k rent vs $154k).
- Cap rate 12.4% vs local median 5.5% in Gardendale — top-decile yield for the area; either an underpriced asset or a hidden risk that comps aren't pricing in. Stress-test before assuming the spread holds.
Location & tenants
- Location reads 66/100 on livability (#113 in AL) — a middle-class / working-renter tenant base. Strengths: cost of living A+, housing A+, employment A-; Watch: amenities F, commute F, health & safety F.
- Jefferson County (suburban): math 9% / reading 32% proficiency, ranked #104 of 129 in AL (top 81%) — low school quality limits family demand, transient renter base, plan for 1-2y turnover.
- Zoned schools: Gardendale High School (math 21% / reading 28%, grade F, #118 of 305 statewide, top 45%, 1,047 students, 48% FRL) — zoned schools at 48% FRL track the district average.
- Market conditions: 97 active listings in the ZIP; 3 comparable units currently listed for rent nearby; rentals at typical pace (median 24d on market — plan ~3-4 weeks tenant-placement turnaround); solid renter incomes; 2,114 units permitted in Jefferson County in 2024 (556 in 5+ unit buildings).
- This rent runs 33% of the median local income ($82k/yr) — at the standard rent-burdened threshold; future hikes will face affordability resistance.
Forward outlook
- Local home prices are declining (-3.0%/yr); year-one equity from $1k of loan paydown is wiped out by about $5k of value loss. Plan a longer hold.
- Jefferson County population projected to shrink 4% by 2050 — rents likely to lag national; underwrite the cash flow, not the appreciation.
- At projected returns (-3.0% appreciation + 3.0% rent growth), your $43k cash investment doubles in ~6 years — after that, you're playing with house money.
Negotiation context
- Only 14 days on market — expect competitive offers; lowballing is unlikely to land.
- Current owner paid $97k; list at $154k implies a 58% gain — meaningful room to come down on a strong offer.
Risks & watch-outs
- Watch-outs: built in 1940 — expect roof / HVAC / electrical / plumbing capex.
- Climate carrying-cost: major wind risk, 27% chance of damaging wind over 30y; extreme-heat days projected 7→19/yr by 2055 (HVAC capex compounding) — expect insurance premiums to compound above CPI over the hold.
Questions for the listing agent
- Built in 1940 — when were the roof, HVAC, electrical panel, plumbing, and water heater last replaced?
- Is there a deadline driving the sale (1031 exchange, divorce, estate, relocation)? That informs how much negotiation room exists.
- What's the average days-on-market for RENTAL listings here right now (not sales)? A rising rental-DOM trend means longer vacancies and softer asking-rent achievability than the comps imply.
- What's the recent tenant-quality profile in this submarket — average credit score on applications, eviction rate, late-payment / NSF rate, and stable-employment percentage? A property-management company in the area should have these aggregated.
- How much new for-sale + rental construction is in the pipeline within 1–3 miles? Heavy new supply typically softens prices + rents 12–24 months out; constrained supply supports both.
Investment metrics
- 1% rule
- 1.46% ✓
- Cap rate
- 12.45%
- Cash-on-cash
- 21.99%
- DSCR
- 1.98
- GRM
- 5.7
CMA / ARV
- ARV (median comp)
- $176,166
- List price
- $154,000
- Delta
- -12.58%
- Verdict
- UNDERPRICED
- Comps
- 14 within 1.0 mi
Show comp detail 1 sale within ~0.75 mi
| Address | Dist | Beds/Ba | Sqft | Sold | Price | $/sf | Match |
|---|---|---|---|---|---|---|---|
| 912 Sharit Ave | 0.67mi | 2/1.0 | 780 (-13%) | 14mo | $96,000 | $123 | 36 |
Match score weights: distance 35% · size 25% · config 20% · recency 20%. Top-matched comps best support the ARV.
Projected returns pro-forma
-3.0% appreciation · 3.0% rent growth · sell at horizon
- IRR
- 14.7%
- Equity multiple
- 1.59×
- Total profit
- $25,358
- Equity at exit
- $22,962
- IRR
- 23.4%
- Equity multiple
- 3.01×
- Total profit
- $86,835
- Equity at exit
- $13,315
Cash invested: $43,120 (down + closing). Projections, not guarantees.
Landlord ↔ Tenant lean methodology
- Overall (STATE)
- 90 Strongly Landlord-Friendly
- State Alabama
- 90 Strongly Landlord-Friendly · R+15
- County
- — inherits STATE
- City
- — inherits STATE
ZIP-level market 35071
- Home prices YoY
- -21.1%
- Active inventory
- 97
- Price-to-rent
- 5.7×
Monthly cashflow live
- Estimated rent
- $2,254 medium interval (Pro) →
- Mortgage (P&I)
- −$808
- Tax from tax record
- −$119 /mo · $1,428/yr
- Insurance
- −$64
- HOA
- −$0
- Vacancy / Maint / Mgmt
- −$473
- Net cashflow
- $790
Break-even live
UW: 25.0% down · 7.5% · 30yr · 1.5% tax · 5.0% vac · 8.0% maint · 8.0% mgmt
Financing live
Cash to close
- Down payment
- $38,500
- Closing costs
- $4,620
- Reserves months
- —
- Total cash needed
- —
Loan-product check · same deal, 3 products live
Conventional
25% down · 7.5% · 30yr
- Down + closing
- —
- Monthly P&I
- —
- Monthly cashflow
- —
- DSCR
- —
- Eligible?
- —
Personal DTI + credit; lowest rate.
DSCR
20% down · 8.5% · 30yr
- Down + closing
- —
- Monthly P&I
- —
- Monthly cashflow
- —
- DSCR
- —
- Eligible?
- —
No personal income docs; deal must DSCR.
Hard money
10% down · 12.0% · 12mo
- Down + closing
- —
- Monthly P&I
- —
- Monthly cashflow
- —
- DSCR
- —
- Eligible?
- —
Short-term bridge; refi at stabilization.
Rent comps 3 comps
| Address | Beds | Baths | Sqft | Rent | $/sqft | DOM | Units | Dist |
|---|---|---|---|---|---|---|---|---|
| 4000 Skyline Ridge Rd Unit 4325 Gardendale, AL | 1.0 | 1.0 | 736 | $2,695 | $3.66 | 43d | 1 | 0.67mi |
| 4000 Skyline Ridge Rd Unit 4712 Gardendale, AL | 1.0 | 1.0 | 736 | $2,995 | $4.07 | 3d | 1 | 0.67mi |
| 757 Main St Unit 757-D Gardendale, AL | 2.0 | 1.0 | 900 | $1,130 | $1.26 | 23d | 1 | 1.11mi |
Listing history 4 events
-
2026-05-10$154,000 Active 621-char remark
-
2026-03-03soldstatus $97,360
-
1995-06-01soldstatus $40,000
-
1989-01-05soldstatus $30,000
ⓘ Source: listings_history table (triggers on properties + properties_extension) + one-shot
backfill from property_details.listing_events for pre-trigger history.
Tax reassessment forecast AL · Resets to sale price
- Current annual tax
- $1,428 · $119/mo
- Projected year-2 tax
- $1,428 · $119/mo
- Expected delta
- $0/yr ($0/mo · 0.0%)
ⓘ Screening estimate from a state-policy table — verify with the county assessor before closing.
Climate risk First Street
- Flood 1/10 Low FEMA zone X (unshaded) · 0% chance over 30 yrs
- Wildfire 4/10 Moderate
- Heat 6/10 Major 7 d/yr ≥106°F today · 19 d/yr by 30 yrs out
- Wind 6/10 Major 27% chance of damaging wind over 30 yrs
- Air quality 4/10 Moderate 3 unhealthy d/yr today · 8 by 30 yrs out
Nearby sold comps map
Loading sold comps map…
Walkable amenities ~0.75 mi
Loading nearby amenities…
Taxation est. · year 1
- Rental income
- $27,051
- − Mortgage interest
- −$8,626
- − Property taxes
- −$1,428
- − Insurance
- −$770
- − Repairs & maintenance
- −$2,164
- − Management
- −$2,164
- − Depreciation
- −$4,480
- Taxable income
- $7,419
- Est. tax owed @ 24.0%
- −$1,781
- After-tax cash flow
- $7,701/yr
For passive investors: Depreciation is non-cash, so a rental often shows a tax loss while cash-flowing — sheltering income. Rental losses are passive: they offset passive income freely, and up to $25,000/yr can offset ordinary (W-2) income if you actively participate and your MAGI is under $100k (phasing out to $0 by $150k); unused losses carry forward. On sale, claimed depreciation is recaptured at up to 25%, and gains may owe capital-gains tax (a 1031 exchange can defer both). Figures are a year-1 estimate at your 24.0% rate — not tax advice; consult a CPA.
Schools (NCES district)
- District
- Jefferson County
- NCES district ID
- 0101920
- Math proficiency
- 9% ▼ -24.00%
- Reading proficiency
- 32% ▼ -5.00%
- Median HH income
- $51,712
- Composite
- 18.4/100
- National rank
- #8937
- State rank
- #104 of 129 in AL
Livability — Gardendale
- Score
- 66/100
- State rank
- #113
- US rank
- #12225
Category grades
Schools grade is shown separately in the Schools card above.
Census & demographics
- Census place
- Gardendale, AL
- County
- Jefferson County · 527,445 people
- City population
- 17,288
- Metro
- Birmingham-Hoover, AL
- Population (ZIP)
- 17,288
- Household income
- $82,074
- Rent vs Own
- Severe rent burden
- 151.0
Population outlook (Jefferson County) Hauer SSP2
- Today (2025)
- 669,185 people
- By 2030
- 669,694 · +0.1%
- By 2040
- 661,388 · -1.2%
- By 2050
- 643,086 · -3.9%
- By 2075
- 577,267 · -13.7%
- By 2100
- 474,758 · -29.1%
Race, ethnicity, and origin ACS 2023
- Neighborhood character
- Predominantly White (69%)
- Race & ethnicity
- White 69% Black 21% Two or more races 4% Hispanic / Latino 2% Asian 1%
- Common ancestry
- Slovak 3% Serbian 2% Italian 2%
- Foreign-born
- 1% · Canada
- Languages at home
- 98% English-only · Spanish 1%
Political lean MEDSL · Jefferson
- 2024 margin
- D (+10.4) · D 54.6% · R 44.2% · Other 1.2%
- 2008→2024 swing
- +5.4pp toward D · 2008: 5.1pp · 2024: 10.4pp
- All cycles
- 2024: D+10.4 2020: D+13.2 2016: D+7.2 2012: D+6.0 2008: D+5.1
Not yet ingested
- Civics
- —
Market trends
- HPI YoY
- ▼ -55.29%
- Current HPI
- 206.7447
- Rent YoY
- —
- Metro
- Birmingham-Hoover, AL
- State GDP YoY
- ▲ 2.94%
- F500 in state
- 4
Industry mix (Fortune 500 HQ in AL)
| Industry | F500 HQs | Revenue |
|---|---|---|
| Financial Services | 1 | $8B |
|
||
| Healthcare | 1 | $5B |
|
||
Price history
+413.3% since first listed5 events — show timeline
- 2026-05-24 Pending — Greater Alabama MLS
- 2026-05-10 Listed $154,000 Greater Alabama MLS
- 2026-03-03 Sold (Public Records) $97,360 Public Records
- 1995-06-01 Sold (Public Records) $40,000 Public Records
- 1989-01-05 Sold (Public Records) $30,000 Public Records
Property tax history
+6.4%/yrLatest (2025): $1,428 · +0.0% YoY. Source: county tax records.
Cash-flow waterfall
monthlySold comps — $/sqft
last 12 mo · ≤1 miLoading sold comps…