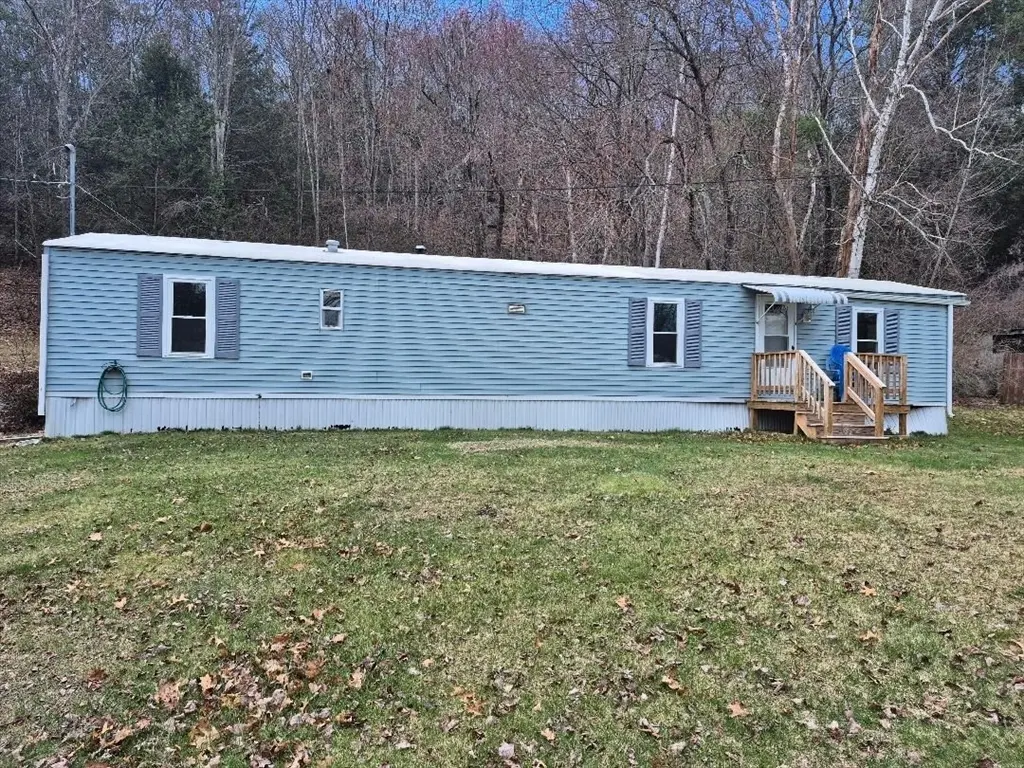
50 Stimson St · Palmer Town, MA
Flood risk 4/10 · Minor
- FEMA flood zone
- X (unshaded)
- Chance of flooding over 30 yrs
- 0.22%
- Est. flood insurance / yr
- $507 – $1,088
Fire risk 3/10 · Minor
- Est. fire insurance / yr
- $915 – $1,699
Heat risk 3/10 · Minor
- Hot days now (above 94°F)
- 7 days/yr
- Hot days in 30 yrs
- 16 days/yr
Wind risk 6/10 · Moderate
- Chance of severe wind over 30 yrs
- 27.0%
Air-quality risk 3/10 · Minor
- Unhealthy air days now
- 2 days/yr
- Unhealthy air days in 30 yrs
- 4 days/yr
Risk factors via First Street. Map © Google.
Why this score? — see what drove the C grade
The composite is a weighted blend of 9 inputs, each scored 0–100. Each bar is that input's sub-score; the figure is the points it added to the 100-point composite (weight × sub-score).
- Cash flow +24.0/30.0
- DSCR +7.7/10.0
- ARV discount +7.5/15.0
- 1% rule +5.7/10.0
- Livability +3.2/5.0
- Schools +2.6/10.0
- Rent growth +2.5/5.0
- Condition / age +2.5/5.0
- Appreciation +0.0/10.0
$165,000
🖨 Deal sheet 📄 Offer letter ✓ Due diligence
Listing remarks MLS
AFFORDABLE MOBILE HOME ON IT'S OWN HALF-ACRE LOT. NICE COVERED DECK IN BACK, GREAT LOCATION, MINUTES TO MASS PIKE FOR EASY COMMUTING. PRICED TO SELL. CALL TODAY.
Key facts
- Updated windows
- Half acre lot
- 3 sheds
Tags
Property features AI
Finance
- HOA & community: Nearby shopping, parks, walking/jogging trails, medical facility, laundromat, conservation area, highway access, house of worship, and public school; Not a senior community
Exterior
- Parking: Off-street parking; 4 parking spaces (open)
- Utilities: Private sewer; Individual well; Electric with circuit breakers
- Home design: Mobile home; Single-story (first floor living spaces)
- Construction: Modular construction; Slab foundation; Shingle roof; Year built reported by owner
- Exterior features: Deck; Wooded lot; Paved, public road frontage with public maintenance
Interior
- Kitchen: Range; Refrigerator
- Bedrooms: Master bedroom on the first floor with wall-to-wall carpet; Second bedroom on the first floor with wall-to-wall carpet and ceiling fan
- Flooring: Vinyl; Carpet
- Bathrooms: One full bathroom on the first floor
- Heating & cooling: Forced air heating; Oil heating; Heating present
- Interior features: Insulated windows; Cathedral ceiling in living room; Ceiling fans in living room and second bedroom; Total of 4 rooms
- Laundry & utility: Washer; Dryer; Laundry located on the first floor
Neighborhood map
What this means for you Summary
Snapshot
- This is a 2-bed/1.0-bath manufactured listed at $165k.
Deal economics
- At list price, monthly cash flow is $322 ($4k/yr) — positive.
- The deal already cash-flows at list — no discount required.
- Meets the 1% rule at list price ($2k rent vs $165k).
- Recommended offer: $160k (3.0% below list) — sets the bar for market timing.
- Cap rate 8.6% vs local median 3.7% in Palmer Town — top-decile yield for the area; either an underpriced asset or a hidden risk that comps aren't pricing in. Stress-test before assuming the spread holds.
Location & tenants
- Location reads 64/100 on livability (#194 in MA) — a middle-class / working-renter tenant base. Strengths: housing A+, health & safety A+; Watch: schools D, amenities F, commute F.
- Palmer (suburban): math 23% / reading 35% proficiency, ranked #256 of 302 in MA (top 85%) — low school quality limits family demand, transient renter base, plan for 1-2y turnover.
- Market conditions: 27 active listings in the ZIP; solid renter incomes; 453 units permitted in Hampden County in 2024 (116 in 5+ unit buildings).
Forward outlook
- Local home prices are declining (-3.0%/yr); year-one equity from $1k of loan paydown is wiped out by about $5k of value loss. Plan a longer hold.
- Hampden County population projected at +5% by 2050 — modest demand growth; plan on rents tracking national, not racing it.
Negotiation context
- It's been on market 40 days — a 3% lower offer ($160k) is reasonable based on typical stale-listing flexibility.
- 2 sale attempts since 23y ago with the ask held roughly flat each time — persistent listings suggest the price (not the market) is what's stuck; bring a comps-based counter.
- Current owner paid $80k; list at $165k implies a 106% gain — meaningful room to come down on a strong offer.
Risks & watch-outs
- Climate carrying-cost: major wind risk, 27% chance of damaging wind over 30y — expect insurance premiums to compound above CPI over the hold.
Questions for the listing agent
- It's been on market 40 days. Have you received any prior offers? Is the seller open to a 3% concession, seller financing, or rate buy-down credit?
- Is there a deadline driving the sale (1031 exchange, divorce, estate, relocation)? That informs how much negotiation room exists.
- Schools are D-rated, which usually means shorter tenancies and higher turnover. Who's the typical renter profile here, and what's been the actual vacancy rate?
- What's the average days-on-market for RENTAL listings here right now (not sales)? A rising rental-DOM trend means longer vacancies and softer asking-rent achievability than the comps imply.
- What's the recent tenant-quality profile in this submarket — average credit score on applications, eviction rate, late-payment / NSF rate, and stable-employment percentage? A property-management company in the area should have these aggregated.
- How much new for-sale + rental construction is in the pipeline within 1–3 miles? Heavy new supply typically softens prices + rents 12–24 months out; constrained supply supports both.
Investment metrics
- 1% rule
- 1.07% ✓
- Cap rate
- 8.63%
- Cash-on-cash
- 8.36%
- DSCR
- 1.37
- GRM
- 7.8
CMA / ARV
No comps found within radius.
Projected returns pro-forma
-3.0% appreciation · 3.0% rent growth · sell at horizon
- IRR
- -3.6%
- Equity multiple
- 0.86×
- Total profit
- $-6,248
- Equity at exit
- $24,602
- IRR
- 6.1%
- Equity multiple
- 1.45×
- Total profit
- $20,891
- Equity at exit
- $14,266
Cash invested: $46,200 (down + closing). Projections, not guarantees.
Landlord ↔ Tenant lean methodology
- Overall (STATE)
- 20 Strongly Tenant-Friendly
- State Massachusetts
- 20 Strongly Tenant-Friendly · D+15
- County
- — inherits STATE
- City
- — inherits STATE
ZIP-level market 01069
- Active inventory
- 27
- Price-to-rent
- 7.8×
Monthly cashflow live
- Estimated rent
- $1,759 medium interval (Pro) →
- Mortgage (P&I)
- −$865
- Tax from tax record
- −$133 /mo · $1,600/yr
- Insurance
- −$69
- HOA
- −$0
- Vacancy / Maint / Mgmt
- −$369
- Net cashflow
- $322
Break-even live
UW: 25.0% down · 7.5% · 30yr · 1.5% tax · 5.0% vac · 8.0% maint · 8.0% mgmt
Financing live
Cash to close
- Down payment
- $41,250
- Closing costs
- $4,950
- Reserves months
- —
- Total cash needed
- —
Loan-product check · same deal, 3 products live
Conventional
25% down · 7.5% · 30yr
- Down + closing
- —
- Monthly P&I
- —
- Monthly cashflow
- —
- DSCR
- —
- Eligible?
- —
Personal DTI + credit; lowest rate.
DSCR
20% down · 8.5% · 30yr
- Down + closing
- —
- Monthly P&I
- —
- Monthly cashflow
- —
- DSCR
- —
- Eligible?
- —
No personal income docs; deal must DSCR.
Hard money
10% down · 12.0% · 12mo
- Down + closing
- —
- Monthly P&I
- —
- Monthly cashflow
- —
- DSCR
- —
- Eligible?
- —
Short-term bridge; refi at stabilization.
Listing history 23 events
-
2026-06-18days on market $165,000 Active 40 DOM
-
2026-06-17days on market $165,000 Active 39 DOM
-
2026-06-16days on market $165,000 Active 38 DOM
-
2026-06-15days on market $165,000 Active 37 DOM
-
2026-06-14days on market $165,000 Active 35 DOM
-
2026-06-13days on market $165,000 Active 34 DOM
-
2026-06-10days on market $165,000 Active 32 DOM
-
2026-06-09days on market $165,000 Active 31 DOM
-
2026-06-08days on market $165,000 Active 30 DOM
-
2026-06-07days on market $165,000 Active 29 DOM
-
2026-06-03days on market $165,000 Active 25 DOM
-
2026-06-02days on market $165,000 Active 24 DOM
-
2026-06-01days on market $165,000 Active 23 DOM
-
2026-05-31days on market $165,000 Active 22 DOM
-
2026-05-30days on market $165,000 Active 21 DOM
-
2026-04-30status Under Agreement
-
2026-04-19historical Contingent
-
2026-04-14$165,000 New
-
2005-02-18soldstatus $80,000
-
2003-11-07soldstatus $70,000 161-char remark
Show marketing remark (161 chars)
AFFORDABLE MOBILE HOME ON IT'S OWN HALF-ACRE LOT. NICE COVERED DECK IN BACK, GREAT LOCATION, MINUTES TO MASS PIKE FOR EASY COMMUTING. PRICED TO SELL. CALL TODAY.
-
2003-11-07soldstatus $70,000
Show marketing remark (161 chars)
AFFORDABLE MOBILE HOME ON IT'S OWN HALF-ACRE LOT. NICE COVERED DECK IN BACK, GREAT LOCATION, MINUTES TO MASS PIKE FOR EASY COMMUTING. PRICED TO SELL. CALL TODAY.
-
2003-05-09$79,900 161-char remark
Show marketing remark (161 chars)
AFFORDABLE MOBILE HOME ON IT'S OWN HALF-ACRE LOT. NICE COVERED DECK IN BACK, GREAT LOCATION, MINUTES TO MASS PIKE FOR EASY COMMUTING. PRICED TO SELL. CALL TODAY.
-
1990-10-02soldstatus $70,000
ⓘ Source: listings_history table (triggers on properties + properties_extension) + one-shot
backfill from property_details.listing_events for pre-trigger history.
Tax reassessment forecast MA · Partial reset (capped growth)
- Current annual tax
- $1,600 · $133/mo
- Projected year-2 tax
- $1,815 · $151/mo
- Expected delta
- +$215/yr (+$18/mo · 13.4%)
ⓘ Screening estimate from a state-policy table — verify with the county assessor before closing.
Climate risk First Street
- Flood 4/10 Moderate FEMA zone X (unshaded) · 22% chance over 30 yrs
- Wildfire 3/10 Moderate
- Heat 3/10 Moderate 7 d/yr ≥94°F today · 16 d/yr by 30 yrs out
- Wind 6/10 Major 27% chance of damaging wind over 30 yrs
- Air quality 3/10 Moderate 2 unhealthy d/yr today · 4 by 30 yrs out
Nearby sold comps map
Loading sold comps map…
Walkable amenities ~0.75 mi
Loading nearby amenities…
Taxation est. · year 1
- Rental income
- $21,104
- − Mortgage interest
- −$9,243
- − Property taxes
- −$1,600
- − Insurance
- −$825
- − Repairs & maintenance
- −$1,688
- − Management
- −$1,688
- − Depreciation
- −$4,800
- Taxable income
- $1,260
- Est. tax owed @ 24.0%
- −$302
- After-tax cash flow
- $3,561/yr
For passive investors: Depreciation is non-cash, so a rental often shows a tax loss while cash-flowing — sheltering income. Rental losses are passive: they offset passive income freely, and up to $25,000/yr can offset ordinary (W-2) income if you actively participate and your MAGI is under $100k (phasing out to $0 by $150k); unused losses carry forward. On sale, claimed depreciation is recaptured at up to 25%, and gains may owe capital-gains tax (a 1031 exchange can defer both). Figures are a year-1 estimate at your 24.0% rate — not tax advice; consult a CPA.
Schools (NCES district)
- District
- Palmer
- NCES district ID
- 2509300
- Math proficiency
- 23% ▼ -7.00%
- Reading proficiency
- 35% ▼ -4.00%
- Median HH income
- $52,654
- Composite
- 25.59/100
- National rank
- #7421
- State rank
- #256 of 302 in MA
Livability — Palmer Town
- Score
- 64/100
- State rank
- #194
- US rank
- #14511
Category grades
Schools grade is shown separately in the Schools card above.
Census & demographics
- Census place
- Palmer Town, MA
- County
- Hampden County · 230,965 people
- City population
- 12,457
- Metro
- Springfield, MA
- Population (ZIP)
- 8,821
- Household income
- $80,190
- Rent vs Own
- Severe rent burden
- 212.0
Population outlook (Hampden County) Hauer SSP2
- Today (2025)
- 485,646 people
- By 2030
- 491,517 · +1.2%
- By 2040
- 500,539 · +3.1%
- By 2050
- 508,827 · +4.8%
- By 2075
- 539,167 · +11.0%
- By 2100
- 545,698 · +12.4%
Race, ethnicity, and origin ACS 2023
- Neighborhood character
- Predominantly White (83%)
- Race & ethnicity
- White 83% Two or more races 10% Hispanic / Latino 5% Black 3%
- Hispanic origin (detail)
- Mexican 4%
- Common ancestry
- Romanian 16% Lithuanian 14% Russian 2%
- Foreign-born
- 2% · Canada
- Languages at home
- 94% English-only · French/Haitian/Cajun 2% Other Indo-European 1% Russian/Polish/Slavic 1%
Political lean MEDSL · Hampden
- 2024 margin
- Lean D (+8.9) · D 53.4% · R 44.5% · Other 2.1%
- 2008→2024 swing
- -16.4pp toward R · 2008: 25.3pp · 2024: 8.9pp
- All cycles
- 2024: D+8.9 2020: D+17.7 2016: D+16.0 2012: D+25.4 2008: D+25.3
Not yet ingested
- Civics
- —
Market trends
- HPI YoY
- ▼ -112.60%
- Current HPI
- 185.7406
- Rent YoY
- —
- Metro
- Springfield, MA
- State GDP YoY
- ▲ 2.28%
- F500 in state
- 38
Industry mix (Fortune 500 HQ in MA)
| Industry | F500 HQs | Revenue |
|---|---|---|
| Technology | 3 | $17B |
|
||
| Insurance | 2 | $84B |
|
||
| Retail | 2 | $76B |
|
||
| Life Sciences | 1 | $43B |
|
||
| Energy Technology | 1 | $31B |
|
||
| Aerospace / Defense | 1 | $18B |
|
||
Price history
+135.7% since first listed8 events — show timeline
- 2026-04-30 Pending — MLS PIN
- 2026-04-19 Contingent — MLS PIN
- 2026-04-14 Listed $165,000 MLS PIN
- 2005-02-18 Sold (Public Records) $80,000 Public Records
- 2003-11-07 Sold (Public Records) $70,000 Public Records
- 2003-11-07 Sold (MLS) $70,000 MLS PIN
- 2003-05-09 Listed $79,900 MLS PIN
- 1990-10-02 Sold (Public Records) $70,000 Public Records
Property tax history
+1.4%/yrLatest (2023): $1,600 · -3.7% YoY. Source: county tax records.
Cash-flow waterfall
monthlySold comps — $/sqft
last 12 mo · ≤1 miLoading sold comps…