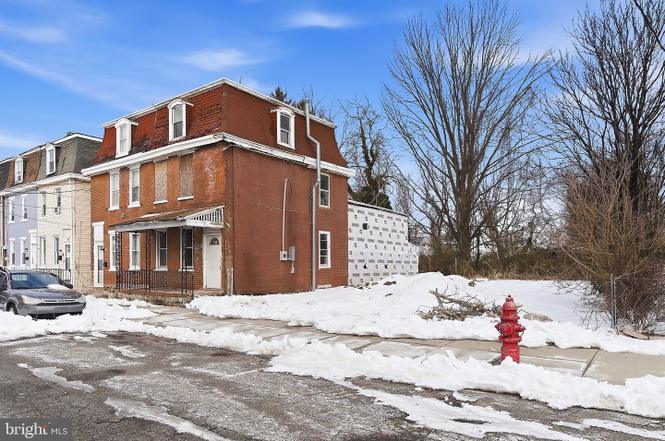
315 Jones Ave · Burlington, NJ
Flood risk 7/10 · Major
- FEMA flood zone
- AE
- Chance of flooding over 30 yrs
- 0.76%
- Est. flood insurance / yr
- $1,737 – $8,500
Fire risk 1/10 · Minimal
- Est. fire insurance / yr
- $526 – $976
Heat risk 7/10 · Major
- Hot days now (above 104°F)
- 7 days/yr
- Hot days in 30 yrs
- 15 days/yr
Wind risk 6/10 · Moderate
- Chance of severe wind over 30 yrs
- 27.0%
Air-quality risk 5/10 · Moderate
- Unhealthy air days now
- 6 days/yr
- Unhealthy air days in 30 yrs
- 8 days/yr
Risk factors via First Street. Map © Google.
Why this score? — see what drove the B- grade
The composite is a weighted blend of 9 inputs, each scored 0–100. Each bar is that input's sub-score; the figure is the points it added to the 100-point composite (weight × sub-score).
- Cash flow +30.0/30.0
- DSCR +10.0/10.0
- 1% rule +9.7/10.0
- ARV discount +7.5/15.0
- Livability +3.9/5.0
- Rent growth +2.5/5.0
- Condition / age +2.5/5.0
- Schools +1.6/10.0
- Appreciation +0.0/10.0
$167,000
🖨 Deal sheet 📄 Offer letter ✓ Due diligence
Listing remarks MLS
Attention handymen, builders, and investors: Vacant property presents a fantastic opportunity at an excellent price point. Situated on a single lot, offered below assessed value. With plenty of potential, this property is being sold as is, where is. Buyers are responsible for all inspections, CO, and certifications. While the information provided in this listing, including utilities is deemed reliable but not guaranteed, it's strongly recommended that interested parties verify independently before making any transaction. The seller/current owner does not guarantee the completeness of the property information provided in this MLS listing. This Property is being sold " AS is, where is".
Key facts
- Built 1898
- Listed 118 days
Property features AI
Finance
- Other: Finished above-grade area approximately 2,464 (estimated); Lease not considered
Exterior
- Parking: On-street parking
- Utilities: Public water; Public sewer; Electric available; Natural gas available; Water available; Sewer available; Underground utilities; Municipal trash service
- Home design: Semi-detached property; Major rehab needed; Fee simple ownership; Estimated year built
- Construction: Crawl space foundation; Above-grade and below-grade structures
- Exterior features: Additional lot(s); Lot dimensions approximately 55 x 118
Interior
- Bedrooms: Four bedrooms on the main level
- Bathrooms: One full bathroom on the main level; One full bathroom total
- Heating & cooling: Natural gas heating; Natural gas hot water
- Interior features: Estimated living area; Basement (combination)
Neighborhood map
What this means for you Summary
Snapshot
- This is a 4-bed/1.0-bath townhouse listed at $167k.
Deal economics
- At list price, monthly cash flow is $243 ($3k/yr) — positive.
- The deal already cash-flows at list — no discount required.
- Meets the 1% rule at list price ($2k rent vs $167k).
- Recommended offer: $152k (9.0% below list) — sets the bar for market timing.
- Cap rate 11.1% vs local median 4.6% in Burlington — top-decile yield for the area; either an underpriced asset or a hidden risk that comps aren't pricing in. Stress-test before assuming the spread holds.
Location & tenants
- Location reads 78/100 on livability (#89 in NJ, #2,359 nationally) — a middle-class / working-renter tenant base. Strengths: housing A+, health & safety A+, cost of living A-; Watch: schools C-, amenities F.
- Burlington City Public School District (suburban): math 7% / reading 29% proficiency, ranked #439 of 472 in NJ (top 93%) — low school quality limits family demand, transient renter base, plan for 1-2y turnover.
- Market conditions: 179 active listings in the ZIP; 8 comparable units currently listed for rent nearby; rentals leasing fast (median 5d on market — plan ~1-2 weeks tenant-placement turnaround); solid renter incomes; 2,161 units permitted in Burlington County in 2024 (988 in 5+ unit buildings).
- This rent runs 30% of the median local income ($98k/yr) — at the standard rent-burdened threshold; future hikes will face affordability resistance.
Forward outlook
- Local home prices are declining (-3.0%/yr); year-one equity from $1k of loan paydown is wiped out by about $5k of value loss. Plan a longer hold.
- Burlington County population projected to shrink 5% by 2050 — rents likely to lag national; underwrite the cash flow, not the appreciation.
Negotiation context
- It's been on market 119 days — a 9% lower offer ($152k) is reasonable based on typical stale-listing flexibility.
- 9 sale attempts since 28y ago with the ask held roughly flat each time — persistent listings suggest the price (not the market) is what's stuck; bring a comps-based counter.
- Current owner paid $80k; list at $167k implies a 109% gain — meaningful room to come down on a strong offer.
Risks & watch-outs
- Watch-outs: flood insurance adds $427/mo; built in 1898 — expect roof / HVAC / electrical / plumbing capex.
- Climate carrying-cost: in FEMA flood zone AE (mandatory federal flood insurance); major wind risk, 27% chance of damaging wind over 30y; extreme-heat days projected 7→15/yr by 2055 (HVAC capex compounding) — expect insurance premiums to compound above CPI over the hold.
Questions for the listing agent
- It's been on market 119 days. Have you received any prior offers? Is the seller open to a 9% concession, seller financing, or rate buy-down credit?
- Built in 1898 — when were the roof, HVAC, electrical panel, plumbing, and water heater last replaced?
- What's the actual annual flood-insurance premium (NFIP or private), and is the property in a SFHA with mandatory coverage?
- Why hasn't it sold? Are there any deal-killer items the seller is aware of (foundation, flood, title, zoning, code violations)?
- Is there a deadline driving the sale (1031 exchange, divorce, estate, relocation)? That informs how much negotiation room exists.
- What's the average days-on-market for RENTAL listings here right now (not sales)? A rising rental-DOM trend means longer vacancies and softer asking-rent achievability than the comps imply.
- What's the recent tenant-quality profile in this submarket — average credit score on applications, eviction rate, late-payment / NSF rate, and stable-employment percentage? A property-management company in the area should have these aggregated.
- How much new for-sale + rental construction is in the pipeline within 1–3 miles? Heavy new supply typically softens prices + rents 12–24 months out; constrained supply supports both.
Investment metrics
- 1% rule
- 1.47% ✓
- Cap rate
- 11.10%
- Cash-on-cash
- 17.18%
- DSCR
- 1.76
- GRM
- 5.7
CMA / ARV
- ARV (on-the-fly)
- $337,568
- Comps found
- 7
Show comp detail 7 sales within ~0.75 mi
| Address | Dist | Beds/Ba | Sqft | Sold | Price | $/sf | Match |
|---|---|---|---|---|---|---|---|
| 217 Penn St | 0.34mi | 4/2.5 | 2,397 (-3%) | 14mo | $250,000 | $104 | 62 |
| 319 E Union St | 0.27mi | 5/2.0 (+1) | 2,360 (-4%) | 22mo | $160,000 | $68 | 53 |
| 504 York St | 0.10mi | 5/3.0 (+1) | 2,117 (-14%) | 8mo | $355,000 | $168 | 52 |
| 233 Ellis St | 0.70mi | 5/3.0 (+1) | 2,504 (+2%) | 0mo | $350,000 | $140 | 51 |
| 202 W Union St | 0.59mi | 4/2.5 | 2,232 (-9%) | 7mo | $299,900 | $134 | 45 |
| 244 Conover St | 0.64mi | 5/2.0 (+1) | 2,140 (-13%) | 0mo | $355,000 | $166 | 39 |
| 237 Conover St | 0.63mi | 5/2.0 (+1) | 2,112 (-14%) | 19mo | $290,000 | $137 | 21 |
Match score weights: distance 35% · size 25% · config 20% · recency 20%. Top-matched comps best support the ARV.
Projected returns pro-forma
-3.0% appreciation · 3.0% rent growth · sell at horizon
- IRR
- -6.5%
- Equity multiple
- 0.76×
- Total profit
- $-11,210
- Equity at exit
- $24,900
- IRR
- 3.4%
- Equity multiple
- 1.25×
- Total profit
- $11,688
- Equity at exit
- $14,439
Cash invested: $46,760 (down + closing). Projections, not guarantees.
Landlord ↔ Tenant lean methodology
- Overall (STATE)
- 21 Tenant-Leaning
- State New Jersey
- 21 Tenant-Leaning · D+6
- County
- — inherits STATE
- City
- — inherits STATE
ZIP-level market 08016
- Home prices YoY
- -21.8%
- Active inventory
- 179
- Price-to-rent
- 5.7×
Monthly cashflow live
- Estimated rent
- $2,462 high interval (Pro) →
- Mortgage (P&I)
- −$876
- Tax from tax record
- −$330 /mo · $3,961/yr
- Insurance
- −$70
- Flood insurance flood zone
- −$427 /mo · $5,118/yr
- HOA
- −$0
- Vacancy / Maint / Mgmt
- −$517
- Net cashflow
- $243
Break-even live
UW: 25.0% down · 7.5% · 30yr · 1.5% tax · 5.0% vac · 8.0% maint · 8.0% mgmt
Financing live
Cash to close
- Down payment
- $41,750
- Closing costs
- $5,010
- Reserves months
- —
- Total cash needed
- —
Loan-product check · same deal, 3 products live
Conventional
25% down · 7.5% · 30yr
- Down + closing
- —
- Monthly P&I
- —
- Monthly cashflow
- —
- DSCR
- —
- Eligible?
- —
Personal DTI + credit; lowest rate.
DSCR
20% down · 8.5% · 30yr
- Down + closing
- —
- Monthly P&I
- —
- Monthly cashflow
- —
- DSCR
- —
- Eligible?
- —
No personal income docs; deal must DSCR.
Hard money
10% down · 12.0% · 12mo
- Down + closing
- —
- Monthly P&I
- —
- Monthly cashflow
- —
- DSCR
- —
- Eligible?
- —
Short-term bridge; refi at stabilization.
Rent comps 8 comps
| Address | Beds | Baths | Sqft | Rent | $/sqft | DOM | Units | Dist |
|---|---|---|---|---|---|---|---|---|
| 405 Lawrence St Burlington, NJ | 4.0 | 1.0 | 1859 | $2,000 | $1.08 | 5d | 1 | 0.18mi |
| 336 Barclay St Unit B Burlington, NJ | 3.0 | 1.0 | 1944 | $1,800 | $0.93 | 24d | 1 | 0.22mi |
| 516 Columbus Rd Burlington, NJ | 4.0 | 1.0 | 1600 | $2,750 | $1.72 | 15d | 1 | 0.31mi |
| 219 Wood St Burlington, NJ | 3.0 | 1.0 | 3058 | $2,125 | $0.69 | 4d | 1 | 0.50mi |
| 105 W Union St Burlington, NJ | 4.0 | 1.5 | 1645 | $2,000 | $1.22 | 2d | 1 | 0.50mi |
| 1 Dresser Ave Unit 1 Burlington, NJ | 3.0 | 1.0 | 3088 | $2,150 | $0.70 | 1d | 1 | 1.23mi |
| 256 Radcliffe St Bristol, PA | 4.0 | 2.0 | 1900 | $3,250 | $1.71 | 1d | 1 | 1.35mi |
| 115 Cedar St Unit 2 Bristol, PA | 3.0 | 1.0 | 1700 | $2,600 | $1.53 | 1d | 1 | 1.36mi |
Listing history 39 events
-
2026-06-18days on market $167,000 Active 119 DOM
-
2026-06-17days on market $167,000 Active 118 DOM
-
2026-06-16days on market $167,000 Active 117 DOM
-
2026-06-15days on market $167,000 Active 116 DOM
-
2026-06-13days on market $167,000 Active 114 DOM
-
2026-06-13days on market $167,000 Active 113 DOM
-
2026-06-09days on market $167,000 Active 110 DOM
-
2026-06-08days on market $167,000 Active 109 DOM
-
2026-06-07days on market $167,000 Active 108 DOM
-
2026-06-04days on market $167,000 Active 105 DOM
-
2026-06-03days on market $167,000 Active 104 DOM
-
2026-06-02days on market $167,000 Active 103 DOM
-
2026-06-01days on market $167,000 Active 102 DOM
-
2026-05-31days on market $167,000 Active 101 DOM
-
2026-02-20$167,000 Active
-
2025-08-06historical
-
2024-08-29$199,000 Active
-
2024-07-30soldstatus $80,000
-
2024-07-22soldstatus $80,000 Closed 705-char remark
Show marketing remark (705 chars)
Attention handymen, builders, and investors: Vacant property presents a fantastic opportunity at an excellent price point. Situated on a single lot, offered below assessed value. With plenty of potential, this property is being sold as is, where is. Buyers are responsible for all inspections, CO, and certifications. While the information provided in this listing, including utilities is deemed reliable but not guaranteed, it's strongly recommended that interested parties verify independently before making any transaction. The seller/current owner does not guarantee the completeness of the property information provided in this MLS listing. This Property is being sold " AS is, where is".
-
2024-06-05status Pending 705-char remark
Show marketing remark (705 chars)
Attention handymen, builders, and investors: Vacant property presents a fantastic opportunity at an excellent price point. Situated on a single lot, offered below assessed value. With plenty of potential, this property is being sold as is, where is. Buyers are responsible for all inspections, CO, and certifications. While the information provided in this listing, including utilities is deemed reliable but not guaranteed, it's strongly recommended that interested parties verify independently before making any transaction. The seller/current owner does not guarantee the completeness of the property information provided in this MLS listing. This Property is being sold " AS is, where is".
-
2024-05-30status Active 705-char remark
Show marketing remark (705 chars)
Attention handymen, builders, and investors: Vacant property presents a fantastic opportunity at an excellent price point. Situated on a single lot, offered below assessed value. With plenty of potential, this property is being sold as is, where is. Buyers are responsible for all inspections, CO, and certifications. While the information provided in this listing, including utilities is deemed reliable but not guaranteed, it's strongly recommended that interested parties verify independently before making any transaction. The seller/current owner does not guarantee the completeness of the property information provided in this MLS listing. This Property is being sold " AS is, where is".
-
2024-05-15historical Active Under Contract 705-char remark
Show marketing remark (705 chars)
Attention handymen, builders, and investors: Vacant property presents a fantastic opportunity at an excellent price point. Situated on a single lot, offered below assessed value. With plenty of potential, this property is being sold as is, where is. Buyers are responsible for all inspections, CO, and certifications. While the information provided in this listing, including utilities is deemed reliable but not guaranteed, it's strongly recommended that interested parties verify independently before making any transaction. The seller/current owner does not guarantee the completeness of the property information provided in this MLS listing. This Property is being sold " AS is, where is".
-
2024-05-04$69,900 Active 705-char remark
Show marketing remark (705 chars)
Attention handymen, builders, and investors: Vacant property presents a fantastic opportunity at an excellent price point. Situated on a single lot, offered below assessed value. With plenty of potential, this property is being sold as is, where is. Buyers are responsible for all inspections, CO, and certifications. While the information provided in this listing, including utilities is deemed reliable but not guaranteed, it's strongly recommended that interested parties verify independently before making any transaction. The seller/current owner does not guarantee the completeness of the property information provided in this MLS listing. This Property is being sold " AS is, where is".
-
2009-04-03historical
-
2008-04-03$110,000
-
2007-07-26soldstatus $190,000
-
2006-04-19soldstatus $173,000
-
2006-01-31soldstatus $137,000
-
2005-05-12soldstatus $89,900
-
2005-03-16historical
-
2005-03-11$89,900
-
2001-10-02historical
-
2001-07-13historical
-
2001-07-02$29,500
-
2001-03-02$29,500
-
1999-06-25soldstatus $36,000
-
1999-05-26soldstatus $36,000
-
1999-04-22historical
-
1998-10-20$36,000
ⓘ Source: listings_history table (triggers on properties + properties_extension) + one-shot
backfill from property_details.listing_events for pre-trigger history.
Tax reassessment forecast NJ · Partial reset (capped growth)
- Current annual tax
- $3,961 · $330/mo
- Projected year-2 tax
- $4,060 · $338/mo
- Expected delta
- +$98/yr (+$8/mo · 2.5%)
ⓘ Screening estimate from a state-policy table — verify with the county assessor before closing.
Climate risk First Street
- Flood 7/10 Severe FEMA zone AE · 76% chance over 30 yrs
- Wildfire 1/10 Low
- Heat 7/10 Severe 7 d/yr ≥104°F today · 15 d/yr by 30 yrs out
- Wind 6/10 Major 27% chance of damaging wind over 30 yrs
- Air quality 5/10 Major 6 unhealthy d/yr today · 8 by 30 yrs out
Nearby sold comps map
Loading sold comps map…
Walkable amenities ~0.75 mi
Loading nearby amenities…
Taxation est. · year 1
- Rental income
- $29,545
- − Mortgage interest
- −$9,355
- − Property taxes
- −$3,961
- − Insurance
- −$5,954
- − Repairs & maintenance
- −$2,364
- − Management
- −$2,364
- − Depreciation
- −$4,858
- Taxable income
- $690
- Est. tax owed @ 24.0%
- −$166
- After-tax cash flow
- $2,751/yr
For passive investors: Depreciation is non-cash, so a rental often shows a tax loss while cash-flowing — sheltering income. Rental losses are passive: they offset passive income freely, and up to $25,000/yr can offset ordinary (W-2) income if you actively participate and your MAGI is under $100k (phasing out to $0 by $150k); unused losses carry forward. On sale, claimed depreciation is recaptured at up to 25%, and gains may owe capital-gains tax (a 1031 exchange can defer both). Figures are a year-1 estimate at your 24.0% rate — not tax advice; consult a CPA.
Schools (NCES district)
- District
- Burlington City Public School District
- NCES district ID
- 3402430
- Math proficiency
- 7% ▼ -16.00%
- Reading proficiency
- 29% ▼ -8.00%
- Median HH income
- $51,122
- Composite
- 16.27/100
- National rank
- #9218
- State rank
- #439 of 472 in NJ
Livability — Burlington
- Score
- 78/100
- State rank
- #89
- US rank
- #2359
Category grades
Schools grade is shown separately in the Schools card above.
Census & demographics
- Census place
- Burlington, NJ
- County
- Burlington County · 323,710 people
- Metro
- Philadelphia-Camden-Wilmington, PA-NJ-DE-MD
- Population (ZIP)
- 34,920
- Household income
- $98,463
- Rent vs Own
- Severe rent burden
- 1045.0
Population outlook (Burlington County) Hauer SSP2
- Today (2025)
- 453,425 people
- By 2030
- 452,359 · -0.2%
- By 2040
- 445,033 · -1.9%
- By 2050
- 431,760 · -4.8%
- By 2075
- 406,277 · -10.4%
- By 2100
- 364,732 · -19.6%
Race, ethnicity, and origin ACS 2023
- Neighborhood character
- Diverse neighborhood (Simpson 0.68)
- Race & ethnicity
- White 44% Black 33% Two or more races 10% Hispanic / Latino 9% Asian 7%
- Hispanic origin (detail)
- Puerto Rican 4% Dominican 1%
- Common ancestry
- Romanian 4% Hispanic 2% Lithuanian 1%
- Foreign-born
- 15% · Canada
- Languages at home
- 84% English-only · Spanish 4% Other Indo-European 4% French/Haitian/Cajun 2%
Political lean MEDSL · Burlington
- 2024 margin
- D (+16.6) · D 57.6% · R 41.0% · Other 1.3%
- 2008→2024 swing
- -2.0pp toward R · 2008: 18.6pp · 2024: 16.6pp
- All cycles
- 2024: D+16.6 2020: D+19.5 2016: D+14.8 2012: D+18.7 2008: D+18.6
Not yet ingested
- Civics
- —
Market trends
- HPI YoY
- ▼ -83.42%
- Current HPI
- 298.7935
- Rent YoY
- —
- Metro
- Philadelphia-Camden-Wilmington, PA-NJ-DE-MD
- State GDP YoY
- ▲ 2.05%
- F500 in state
- 34
Industry mix (Fortune 500 HQ in NJ)
| Industry | F500 HQs | Revenue |
|---|---|---|
| Consumer Goods | 3 | $31B |
|
||
| Pharmaceuticals | 2 | $153B |
|
||
| Technology | 2 | $21B |
|
||
| Insurance | 2 | $20B |
|
||
| Healthcare | 2 | $19B |
|
||
| Financial Services | 1 | $70B |
|
||
Price history
+363.9% since first listed25 events — show timeline
- 2026-02-20 Listed $167,000 BRIGHT MLS
- 2025-08-06 Listing Removed — BRIGHT MLS
- 2024-08-29 Listed $199,000 BRIGHT MLS
- 2024-07-30 Sold (Public Records) $80,000 Public Records
- 2024-07-22 Sold (MLS) $80,000 BRIGHT MLS
- 2024-06-05 Pending — BRIGHT MLS
- 2024-05-30 Relisted — BRIGHT MLS
- 2024-05-15 Contingent — BRIGHT MLS
- 2024-05-04 Listed $69,900 BRIGHT MLS
- 2009-04-03 Listing Removed — BRIGHT MLS
- 2008-04-03 Listed $110,000 BRIGHT MLS
- 2007-07-26 Sold (Public Records) $190,000 Public Records
- 2006-04-19 Sold (Public Records) $173,000 Public Records
- 2006-01-31 Sold (Public Records) $137,000 Public Records
- 2005-05-12 Sold (MLS) $89,900 BRIGHT MLS
- 2005-03-16 Listing Removed — BRIGHT MLS
- 2005-03-11 Listed $89,900 BRIGHT MLS
- 2001-10-02 Listing Removed — BRIGHT MLS
- 2001-07-13 Listing Removed — BRIGHT MLS
- 2001-07-02 Listed $29,500 BRIGHT MLS
- 2001-03-02 Listed $29,500 BRIGHT MLS
- 1999-06-25 Sold (Public Records) $36,000 Public Records
- 1999-05-26 Sold (MLS) $36,000 BRIGHT MLS
- 1999-04-22 Listing Removed — BRIGHT MLS
- 1998-10-20 Listed $36,000 BRIGHT MLS
Property tax history
+1.8%/yrLatest (2025): $3,961 · +2.6% YoY. Source: county tax records.
Cash-flow waterfall
monthlySold comps — $/sqft
last 12 mo · ≤1 miLoading sold comps…