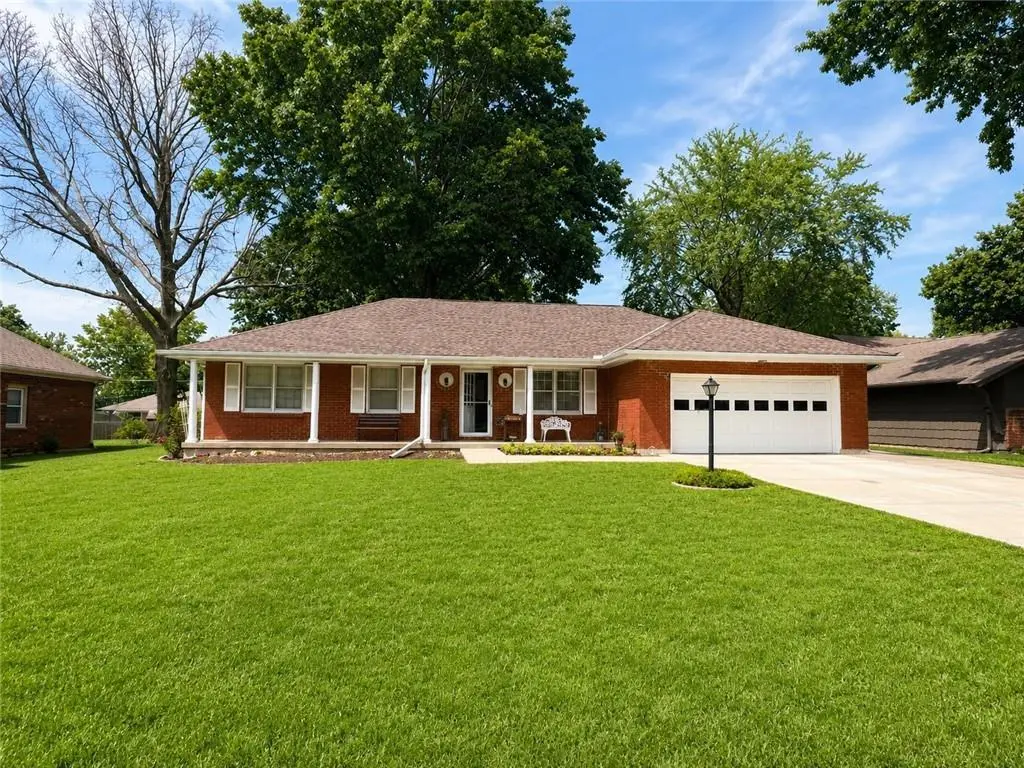
1101 SW Azure Ave · Blue Springs, MO
Flood risk 1/10 · Minimal
- FEMA flood zone
- X (unshaded)
- Chance of flooding over 30 yrs
- 0.0%
- Est. flood insurance / yr
- $473 – $860
Fire risk 1/10 · Minimal
- Est. fire insurance / yr
- $1,054 – $1,958
Heat risk 4/10 · Minor
- Hot days now (above 107°F)
- 7 days/yr
- Hot days in 30 yrs
- 16 days/yr
Wind risk 2/10 · Minimal
- Chance of severe wind over 30 yrs
- —
Air-quality risk 4/10 · Minor
- Unhealthy air days now
- 5 days/yr
- Unhealthy air days in 30 yrs
- 5 days/yr
Risk factors via First Street. Map © Google.
Why this score? — see what drove the C- grade
The composite is a weighted blend of 9 inputs, each scored 0–100. Each bar is that input's sub-score; the figure is the points it added to the 100-point composite (weight × sub-score).
- ARV discount +15.0/15.0
- Cash flow +13.1/30.0
- Schools +5.1/10.0
- Livability +4.1/5.0
- DSCR +3.9/10.0
- 1% rule +3.7/10.0
- Rent growth +2.8/5.0
- Condition / age +2.5/5.0
- Appreciation +0.0/10.0
$215,000
🖨 Deal sheet (PDF) 📄 Offer letter ✓ Due diligence
Listing remarks MLS
Spacious all brick ranch w/ lovely big treed yard on quiet st. on S. side of Blue Springs. Plenty of gathering areas & big deck for great family events! Needs some updating, great potential here & very easy to show! Pegged flr under carpet in Fam. Rm. & Hdwd flr. under carpet in bdrm's. Huge rec. rm. downw/ 2nd fp.
Key facts
- All brick ranch
- Unfinished basement
- Hvac system
Tags
Property features AI
Finance
- Other: Property built approximately 51–75 years ago
Exterior
- Parking: Attached garage facing front; 2-car garage
- Utilities: Public water; Public sewer
- Home design: Single-family residence; Ranch floor plan; Residential property
- Construction: Brick construction; Composition roof
- Exterior features: City lot; Not in a flood plain
Interior
- Bedrooms: 3 bedrooms
- Flooring: Carpet; Other flooring
- Bathrooms: 2 full bathrooms; 1 half bathroom
- Heating & cooling: Natural gas heating; Electric cooling
- Interior features: Formal dining area; Family room on main level; Two fireplaces (one in family room, one in basement) with gas starter and wood-burning capability; Unfinished full basement with concrete floor and inside entrance
- Laundry & utility: Laundry located on main and bedroom levels
Neighborhood map
What this means for you Summary
Snapshot
- This is a 3-bed/2.0-bath single-family listed at $215k.
Deal economics
- At list price, monthly cash flow is $-9 ($-104/yr) — negative.
- To cash-flow at today's rent, offer at most $213k (0.7% below list).
- To meet the 1% rule (rent ≥ 1% of price), the offer needs to be $188k (12.6% below list).
- Recommended offer: $188k (12.6% below list) — sets the bar for 1% rule.
- Cap rate 6.2% vs local median 3.2% in Blue Springs — top-decile yield for the area; either an underpriced asset or a hidden risk that comps aren't pricing in. Stress-test before assuming the spread holds.
Location & tenants
- Location reads 82/100 on livability (#11 in MO, #1,297 nationally) — a professional / high-income tenant draw. Strengths: cost of living A+, housing A+, health & safety A+; Watch: commute F.
- Blue Springs R-IV (suburban): math 55% / reading 60% proficiency, ranked #17 of 324 in MO (top 5%) — acceptable for families but not a draw, mixed tenant base, ~2y average lease.
- Zoned schools: Franklin Smith Elem. (math 59% / reading 55%, grade C+, #159 of 1,115 statewide, top 16%, 411 students, 43% FRL); Moreland Ridge Middle (math 51% / reading 55%, grade C+, #51 of 391 statewide, top 13%, 1,071 students, 31% FRL); Blue Springs South High (math 43% / reading 72%, grade C, #49 of 521 statewide, top 9%, 2,261 students, 22% FRL).
- Market conditions: Rents rising (+1.0%/yr); 142 active listings in the ZIP; 16 comparable units currently listed for rent nearby; rentals leasing fast (median 13d on market — plan ~1-2 weeks tenant-placement turnaround); solid renter incomes; 4,002 units permitted in Jackson County in 2024 (2,271 in 5+ unit buildings).
Forward outlook
- Local home prices are declining (-3.0%/yr); year-one equity from $1k of loan paydown is wiped out by about $6k of value loss. Plan a longer hold.
- Jackson County population projected at +4% by 2050 — modest demand growth; plan on rents tracking national, not racing it.
Negotiation context
- Only 2 days on market — expect competitive offers; lowballing is unlikely to land.
- 2 sale attempts since 23y ago with the ask held roughly flat each time — persistent listings suggest the price (not the market) is what's stuck; bring a comps-based counter.
Questions for the listing agent
- What do current leases actually rent for vs. the listed asking? Can we see a recent rent roll and the last 12 months of T-12 income?
- Built in 1965 — when were the roof, HVAC, electrical panel, plumbing, and water heater last replaced?
- Is there a deadline driving the sale (1031 exchange, divorce, estate, relocation)? That informs how much negotiation room exists.
- Schools are A-rated — typically a magnet for longer-tenancy family renters. What's the average tenant stay here, and is there a school-zone premium baked into asking?
- What's the average days-on-market for RENTAL listings here right now (not sales)? A rising rental-DOM trend means longer vacancies and softer asking-rent achievability than the comps imply.
- What's the recent tenant-quality profile in this submarket — average credit score on applications, eviction rate, late-payment / NSF rate, and stable-employment percentage? A property-management company in the area should have these aggregated.
- How much new for-sale + rental construction is in the pipeline within 1–3 miles? Heavy new supply typically softens prices + rents 12–24 months out; constrained supply supports both.
Investment metrics
- 1% rule
- 0.87% ✗
- Cap rate
- 6.24%
- Cash-on-cash
- -0.17%
- DSCR
- 0.99
- GRM
- 9.5
CMA / ARV
- ARV (on-the-fly)
- $264,272
- Comps found
- 12
Show comp detail 12 sales within ~0.75 mi
| Address | Dist | Beds/Ba | Sqft | Sold | Price | $/sf | Match |
|---|---|---|---|---|---|---|---|
| 920 SW 14th Street Ter | 0.15mi | 3/2.0 | 1,615 (+1%) | 2mo | $275,000 | $170 | 89 |
| 1109 SW 14th St. Ter | 0.21mi | 3/2.0 | 1,550 (-3%) | 11mo | $230,000 | $148 | 77 |
| 1205 SW South Ave | 0.46mi | 3/2.0 | 1,610 (+1%) | 1mo | $250,000 | $155 | 76 |
| 901 SW Speas Dr | 0.66mi | 3/2.5 | 1,608 (+1%) | 2mo | $280,000 | $174 | 64 |
| 1308 SW 20th St | 0.54mi | 3/2.0 | 1,660 (+4%) | 10mo | $275,000 | $166 | 60 |
| 1301 SW Sunrise Dr | 0.24mi | 3/3.0 | 1,823 (+14%) | 8mo | $265,000 | $145 | 54 |
| 404 SW 9th St | 0.59mi | 4/1.5 (+1) | 1,712 (+8%) | 8mo | $255,000 | $149 | 46 |
| 1105 SW 22nd St | 0.68mi | 3/2.0 | 1,785 (+12%) | 4mo | $312,000 | $175 | 44 |
| 105 SW Windsor Ct | 0.68mi | 3/2.0 | 1,803 (+13%) | 7mo | $275,000 | $153 | 40 |
| 1305 S Ward Pkwy | 0.72mi | 3/1.0 | 1,384 (-13%) | 2mo | $230,000 | $166 | 39 |
| 404 SW 21st St | 0.75mi | 3/2.0 | 1,360 (-15%) | 4mo | $255,000 | $188 | 38 |
| 1719 SW 5th St | 0.62mi | 3/2.5 | 1,826 (+15%) | 10mo | $279,000 | $153 | 36 |
Match score weights: distance 35% · size 25% · config 20% · recency 20%. Top-matched comps best support the ARV.
Projected returns pro-forma
-3.0% appreciation · 1.01% rent growth · sell at horizon
- IRR
- -18.8%
- Equity multiple
- 0.35×
- Total profit
- $-39,047
- Equity at exit
- $32,057
- IRR
- -16.0%
- Equity multiple
- 0.18×
- Total profit
- $-49,124
- Equity at exit
- $18,589
Cash invested: $60,200 (down + closing). Projections, not guarantees.
Landlord ↔ Tenant lean methodology
- Overall (STATE)
- 81 Strongly Landlord-Friendly
- State Missouri
- 81 Strongly Landlord-Friendly · R+10
- County
- — inherits STATE
- City
- — inherits STATE
ZIP-level market 64015
- Rents YoY
- 1.0%
- Active inventory
- 142
- Price-to-rent
- 9.5×
Monthly cashflow live
- Estimated rent
- $1,879 high interval (Pro) →
- Mortgage (P&I)
- −$1,127
- Tax from tax record
- −$276 /mo · $3,313/yr
- Insurance
- −$90
- HOA
- −$0
- Vacancy / Maint / Mgmt
- −$395
- Net cashflow
- $-9
Break-even live
Sensitivity live
| Price | -10% $113 | -5% $52 | +0% $-9 | +5% $-70 | +10% $-130 |
|---|---|---|---|---|---|
| Rent | -10% $-157 | -5% $-83 | +0% $-9 | +5% $66 | +10% $140 |
| Rate | -1.0pp $100 | -0.5pp $46 | base $-9 | +0.5pp $-64 | +1.0pp $-121 |
UW: 25.0% down · 7.5% · 30yr · 1.5% tax · 5.0% vac · 8.0% maint · 8.0% mgmt
Financing live
Cash to close
- Down payment
- $53,750
- Closing costs
- $6,450
- Reserves months
- —
- Total cash needed
- —
Loan-product check · same deal, 3 products live
Conventional
25% down · 7.5% · 30yr
- Down + closing
- —
- Monthly P&I
- —
- Monthly cashflow
- —
- DSCR
- —
- Eligible?
- —
Personal DTI + credit; lowest rate.
DSCR
20% down · 8.5% · 30yr
- Down + closing
- —
- Monthly P&I
- —
- Monthly cashflow
- —
- DSCR
- —
- Eligible?
- —
No personal income docs; deal must DSCR.
Hard money
10% down · 12.0% · 12mo
- Down + closing
- —
- Monthly P&I
- —
- Monthly cashflow
- —
- DSCR
- —
- Eligible?
- —
Short-term bridge; refi at stabilization.
Rent comps 16 comps
| Address | Beds | Baths | Sqft | Rent | $/sqft | DOM | Units | Dist |
|---|---|---|---|---|---|---|---|---|
| 403 SW 15th St Blue Springs, MO | 3.0 | 2.0 | 1500 | $1,845 | $1.23 | 12d | 1 | 0.61mi |
| 7901 South Highway 7 Blue Springs, MO | 3.0 | 2.0 | 1172 | $1,987 | $1.70 | 0d | 10 | 0.67mi |
| 509 SW 5th St Blue Springs, MO | 3.0 | 2.5 | 1370 | $1,475 | $1.08 | 9d | 1 | 0.67mi |
| 2101 SW 8th St Unit d Blue Springs, MO | 2.0 | 1.0 | 1051 | $1,095 | $1.04 | 9d | 1 | 0.69mi |
| 503 SW 4th St Blue Springs, MO | 3.0 | 2.0 | 1400 | $1,395 | $1.00 | 45d | 1 | 0.72mi |
| 132 SW 8th St Unit 132 8th Blue Springs, MO | 3.0 | 2.5 | 1350 | $1,795 | $1.33 | 45d | 1 | 0.77mi |
| 1707 SW Walnut St Blue Springs, MO | 4.0 | 2.0 | 1800 | $2,600 | $1.44 | 19d | 1 | 0.79mi |
| 900 SE Tequesta Ln Blue Springs, MO | 3.0 | 2.5–3.5 | 1647 | $2,144 | $1.30 | 0d | 13 | 0.94mi |
| 401 SE Westminister Rd Blue Springs, MO | 3.0 | 3.0 | 2050 | $2,206 | $1.08 | 9d | 1 | 0.97mi |
| 113 SE Rockwood St Blue Springs, MO | 3.0 | 3.0 | 1500 | $2,155 | $1.44 | 0d | 1 | 0.99mi |
| 128 N 1st St Blue Springs, MO | 3.0 | 2.0 | 1100 | $1,706 | $1.55 | 9d | 1 | 1.11mi |
| 504 SW Shamrock Pl Blue Springs, MO | 3.0 | 2.0 | 1450 | $2,095 | $1.44 | 45d | 1 | 1.15mi |
| 573 NW Valleybrook Rd Blue Springs, MO | 2.0 | 2.5 | 1350 | $1,750 | $1.30 | 23d | 1 | 1.28mi |
| 804 NW Hearnes Ave Blue Springs, MO | 3.0 | 1.5 | 1150 | $1,671 | $1.45 | 45d | 1 | 1.32mi |
| 321 NW 22nd Street Ter Blue Springs, MO | 4.0 | 2.5 | 1440 | $2,500 | $1.74 | 9d | 1 | 1.33mi |
| 212 NW 27th Street Ct Blue Springs, MO | 2.0 | 1.0 | 1080 | $1,325 | $1.23 | 45d | 1 | 1.45mi |
Listing history 3 events
-
2026-06-08status $215,000 Pending 2 DOM
-
2026-06-07remarks 630-char remark
-
2026-06-07$215,000 Active 2 DOM
ⓘ Source: listings_history table (triggers on properties + properties_extension) + one-shot
backfill from property_details.listing_events for pre-trigger history.
Tax reassessment forecast MO · Resets to sale price
- Current annual tax
- $3,313 · $276/mo
- Projected year-2 tax
- $3,313 · $276/mo
- Expected delta
- $0/yr ($0/mo · 0.0%)
ⓘ Screening estimate from a state-policy table — verify with the county assessor before closing.
Climate risk First Street
- Flood 1/10 Low FEMA zone X (unshaded) · 0% chance over 30 yrs
- Wildfire 1/10 Low
- Heat 4/10 Moderate 7 d/yr ≥107°F today · 16 d/yr by 30 yrs out
- Wind 2/10 Low
- Air quality 4/10 Moderate 5 unhealthy d/yr today · 5 by 30 yrs out
Nearby sold comps map
Loading sold comps map…
Walkable amenities ~0.75 mi
Loading nearby amenities…
Taxation est. · year 1
- Rental income
- $22,550
- − Mortgage interest
- −$12,043
- − Property taxes
- −$3,313
- − Insurance
- −$1,075
- − Repairs & maintenance
- −$1,804
- − Management
- −$1,804
- − Depreciation
- −$6,255
- Taxable loss
- −$3,744
- Est. tax savings @ 24.0%
- +$899
- After-tax cash flow
- $795/yr
For passive investors: Depreciation is non-cash, so a rental often shows a tax loss while cash-flowing — sheltering income. Rental losses are passive: they offset passive income freely, and up to $25,000/yr can offset ordinary (W-2) income if you actively participate and your MAGI is under $100k (phasing out to $0 by $150k); unused losses carry forward. On sale, claimed depreciation is recaptured at up to 25%, and gains may owe capital-gains tax (a 1031 exchange can defer both). Figures are a year-1 estimate at your 24.0% rate — not tax advice; consult a CPA.
Schools (NCES district)
- District
- Blue Springs R-IV
- NCES district ID
- 2905310
- Math proficiency
- 55% ▼ -10.00%
- Reading proficiency
- 60% ▼ -6.00%
- Median HH income
- $67,959
- Composite
- 50.71/100
- National rank
- #1819
- State rank
- #17 of 324 in MO
Livability — Blue Springs
- Score
- 82/100
- State rank
- #11
- US rank
- #1297
Category grades
Schools grade is shown separately in the Schools card above.
Census & demographics
- Census place
- Blue Springs, MO
- County
- Jackson County · 687,798 people
- City population
- 61,033
- Metro
- Kansas City, MO-KS
- Population (ZIP)
- 32,245
- Household income
- $84,518
- Rent vs Own
- Severe rent burden
- 555.0
Population outlook (Jackson County) Hauer SSP2
- Today (2025)
- 719,589 people
- By 2030
- 731,456 · +1.6%
- By 2040
- 746,689 · +3.8%
- By 2050
- 749,289 · +4.1%
- By 2075
- 736,227 · +2.3%
- By 2100
- 668,210 · -7.1%
Race, ethnicity, and origin ACS 2023
- Neighborhood character
- Predominantly White (80%)
- Race & ethnicity
- White 80% Black 7% Two or more races 7% Hispanic / Latino 7% Asian 1%
- Hispanic origin (detail)
- Mexican 5%
- Common ancestry
- Italian 11% Slovak 3% Lithuanian 2%
- Foreign-born
- 2% · Canada, Vietnam
- Languages at home
- 96% English-only · Spanish 2%
Political lean MEDSL · Jackson
- 2024 margin
- D (+19.3) · D 58.9% · R 39.5% · Other 1.6%
- 2008→2024 swing
- -6.1pp toward R · 2008: 25.4pp · 2024: 19.3pp
- All cycles
- 2024: D+19.3 2020: D+22.0 2016: D+16.6 2012: D+19.0 2008: D+25.4
Not yet ingested
- Civics
- —
Market trends
- HPI YoY
- ▼ -199.47%
- Current HPI
- 232.221
- Rent YoY
- ▲ 1.01%
- Metro
- Kansas City, MO-KS
- State GDP YoY
- ▲ 1.84%
- F500 in state
- 20
Industry mix (Fortune 500 HQ in MO)
| Industry | F500 HQs | Revenue |
|---|---|---|
| Healthcare | 1 | $163B |
|
||
| Insurance | 1 | $21B |
|
||
| Industrial Technology | 1 | $17B |
|
||
| Retail | 1 | $16B |
|
||
| Industrial Distribution | 1 | $10B |
|
||
| Utilities | 1 | $9B |
|
||
Price history
+79.2% since first listed4 events — show timeline
- 2026-06-05 Listed $215,000 Heartland MLS as Distributed by MLS Grid
- 2003-05-27 Sold (Public Records) — Public Records
- 2003-05-23 Sold (MLS) — Heartland MLS as Distributed by MLS Grid
- 2003-04-08 Listed $119,995 Heartland MLS as Distributed by MLS Grid
Property tax history
+4.8%/yrLatest (2025): $3,313 · +5.5% YoY. Source: county tax records.
Cash-flow waterfall
monthlySold comps — $/sqft
last 12 mo · ≤1 miLoading sold comps…