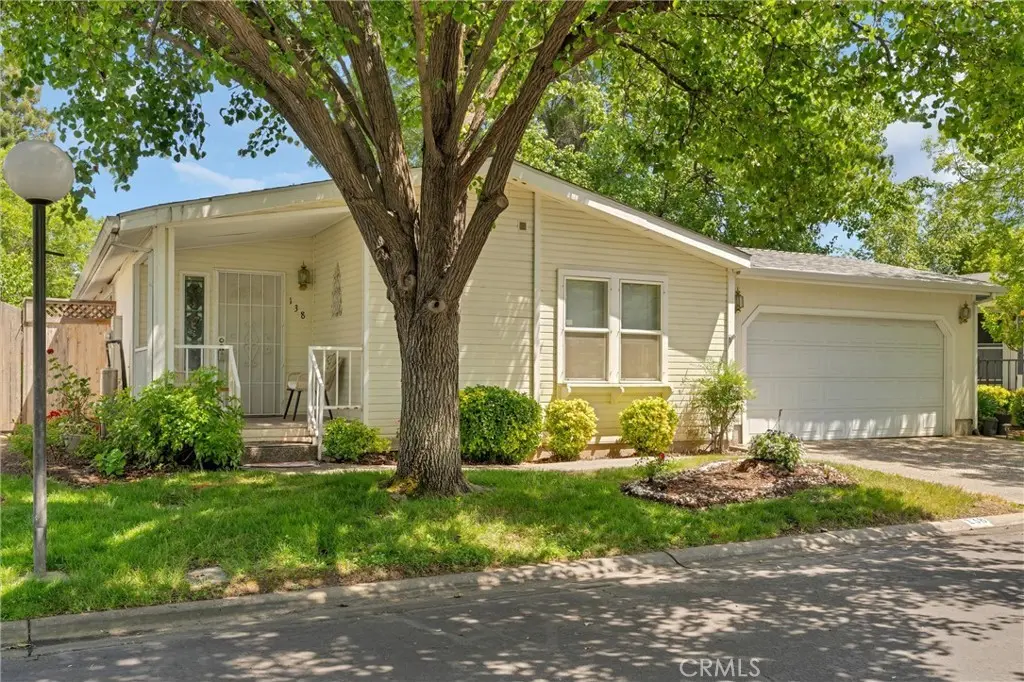
2050 Springfield Dr #138 · Chico, CA
Flood risk 1/10 · Minimal
- FEMA flood zone
- X (unshaded)
- Chance of flooding over 30 yrs
- 0.0%
- Est. flood insurance / yr
- $507 – $1,088
Fire risk 8/10 · Major
- Est. fire insurance / yr
- $659 – $1,223
Heat risk 8/10 · Major
- Hot days now (above 104°F)
- 6 days/yr
- Hot days in 30 yrs
- 15 days/yr
Wind risk 1/10 · Minimal
- Chance of severe wind over 30 yrs
- —
Air-quality risk 10/10 · Severe
- Unhealthy air days now
- 37 days/yr
- Unhealthy air days in 30 yrs
- 41 days/yr
Risk factors via First Street. Map © Google.
Why this score? — see what drove the B grade
The composite is a weighted blend of 9 inputs, each scored 0–100. Each bar is that input's sub-score; the figure is the points it added to the 100-point composite (weight × sub-score).
- Cash flow +30.0/30.0
- ARV discount +12.8/15.0
- DSCR +10.0/10.0
- 1% rule +7.7/10.0
- Schools +4.6/10.0
- Livability +3.6/5.0
- Rent growth +3.4/5.0
- Condition / age +2.5/5.0
- Appreciation +0.0/10.0
$160,000
🖨 Deal sheet 📄 Offer letter ✓ Due diligence
Listing remarks
Some homes simply make life feel easier, and this charming home situated in a quiet gated 55+ community is exactly that. Tucked toward the back of the park with very little through traffic, this lovingly maintained 2-bedroom, 2-bathroom home with a spacious den offers the perfect balance of comfort, independence, and low-maintenance living. From the moment you arrive, the curb appeal immediately draws you in with a welcoming front porch, beautiful shade tree, and a setting that feels peaceful and inviting. Inside, the thoughtfully designed layout offers 1,548 square feet with interconnected living spaces that flow naturally together while still giving each area its own sense of purpose. One
Key facts
- Gated community
- Oversized den
- Clubhouse
Tags
Property features AI
Finance
- Other: Lot size source and living area source: Assessor's data; Road frontage: private road (paved)
- Financial info: Land lease: $968 monthly (park)
- HOA & community: Senior community; Park name: Springfield Manor; Manager approval required; Pets: contact management; Rent may include pool (see remarks)
Exterior
- Parking: Attached garage with direct access; Garage front entry with single door; 2 garage/parking spaces; Driveway (unimproved/unpaved driveway area)
- Security: Carbon monoxide detector(s); Smoke detector(s)
- Utilities: District/public water; Public sewer; Natural gas connected; Electricity connected
- Home design: Single-story (one level); Mobile/manufactured home (Model: Manor House 561; mobile remains); Entry at level 1; Has a view
- Construction: Permanent foundation; Year built source: Assessor
- Exterior features: Shingle roof; Wood fencing; Covered front porch; Concrete patio/slab; Patio; Outdoor lighting; In-ground fenced community pool; Sprinkler system with drip zones and timer; Lawn and landscaped front and back yards; Lot is level/flat and rectangular; Near public transit; Gutters and curbs
Interior
- Kitchen: Gas cooktop; Built-in range; Self-cleaning oven; Electric oven; Dishwasher; Garbage disposal; Recirculated exhaust fan; Formica counters; Water heater unit
- Bedrooms: Primary bedroom; Primary suite; Primary bathroom; Walk-in closet; Den
- Flooring: Vinyl; Carpet
- Bathrooms: 2 full bathrooms; Soaking tub; Jetted tub; Shower in tub; Exhaust fan(s); Linen closet/storage
- Heating & cooling: Central furnace heating; Central cooling; Wall/window cooling units
- Interior features: High ceilings (9 feet+); Ceiling fan; Storage space; Sliding glass door(s); Double pane windows with blinds and screens; Carbon monoxide and smoke detectors
- Laundry & utility: Laundry room inside; Individual laundry room; Washer hookup; Electric dryer hookup (220V in laundry)
Neighborhood map
What this means for you Summary
Snapshot
- This is a 2-bed/2.0-bath manufactured listed at $160k.
Deal economics
- At list price, monthly cash flow is $609 ($7k/yr) — positive.
- The deal already cash-flows at list — no discount required.
- Meets the 1% rule at list price ($2k rent vs $160k).
- Recommended offer: $155k (3.0% below list) — sets the bar for market timing.
- Cap rate 10.9% vs local median 2.6% in Chico — top-decile yield for the area; either an underpriced asset or a hidden risk that comps aren't pricing in. Stress-test before assuming the spread holds.
Location & tenants
- Location reads 72/100 on livability (#195 in CA) — a middle-class / working-renter tenant base. Strengths: amenities A+, commute A+, health & safety A-; Watch: employment C-, crime F, cost of living F.
- Chico Unified (urban): math 40% / reading 70% proficiency, ranked #117 of 517 in CA (top 23%) — acceptable for families but not a draw, mixed tenant base, ~2y average lease.
- Market conditions: Rents rising (+3.4%/yr); 139 active listings in the ZIP; 16 comparable units currently listed for rent nearby; rentals lingering (median 44d on market — plan ~5-8 weeks vacancy on turnover, expect pricing pressure); 50% of comp listings sitting > 30 days — soft ceiling on asking rent; 946 units permitted in Butte County in 2024 (254 in 5+ unit buildings).
- This rent runs 38% of the median local income ($65k/yr) — at the standard rent-burdened threshold; future hikes will face affordability resistance.
Forward outlook
- Local home prices are declining (-3.0%/yr); year-one equity from $1k of loan paydown is wiped out by about $5k of value loss. Plan a longer hold.
- Butte County population projected at +10% by 2050 — modest demand growth; plan on rents tracking national, not racing it.
- At projected returns (-3.0% appreciation + 3.4% rent growth), your $45k cash investment doubles in ~8 years — after that, you're playing with house money.
Negotiation context
- It's been on market 35 days — a 3% lower offer ($155k) is reasonable based on typical stale-listing flexibility.
Risks & watch-outs
- Climate carrying-cost: severe wildfire risk; extreme-heat days projected 6→15/yr by 2055 (HVAC capex compounding) — expect insurance premiums to compound above CPI over the hold.
Questions for the listing agent
- It's been on market 35 days. Have you received any prior offers? Is the seller open to a 3% concession, seller financing, or rate buy-down credit?
- Is there a deadline driving the sale (1031 exchange, divorce, estate, relocation)? That informs how much negotiation room exists.
- Schools are B-rated — typically a magnet for longer-tenancy family renters. What's the average tenant stay here, and is there a school-zone premium baked into asking?
- Crime grade is F in this area — have there been break-ins, vandalism, or insurance claims at this property in the last 3 years? What carrier currently insures it and at what premium?
- What's the average days-on-market for RENTAL listings here right now (not sales)? A rising rental-DOM trend means longer vacancies and softer asking-rent achievability than the comps imply.
- What's the recent tenant-quality profile in this submarket — average credit score on applications, eviction rate, late-payment / NSF rate, and stable-employment percentage? A property-management company in the area should have these aggregated.
- How much new for-sale + rental construction is in the pipeline within 1–3 miles? Heavy new supply typically softens prices + rents 12–24 months out; constrained supply supports both.
Investment metrics
- 1% rule
- 1.27% ✓
- Cap rate
- 10.86%
- Cash-on-cash
- 16.30%
- DSCR
- 1.73
- GRM
- 6.5
CMA / ARV
- ARV (median comp)
- $181,241
- List price
- $160,000
- Delta
- -11.72%
- Verdict
- UNDERPRICED
- Comps
- 8 within 1.0 mi
Show comp detail 12 sales within ~0.75 mi
| Address | Dist | Beds/Ba | Sqft | Sold | Price | $/sf | Match |
|---|---|---|---|---|---|---|---|
| 2050 Springfield Dr #215 | 0.03mi | 2/2.0 | 1,568 (+1%) | 1mo | $180,000 | $115 | 96 |
| 2050 Springfield Dr #312 | 0.08mi | 2/2.0 | 1,512 (-2%) | 2mo | $180,000 | $119 | 91 |
| 2050 Springfield Dr #314 | 0.08mi | 2/2.0 | 1,512 (-2%) | 10mo | $185,000 | $122 | 84 |
| 2050 Springfield Dr #316 | 0.08mi | 2/2.0 | 1,512 (-2%) | 12mo | $189,000 | $125 | 82 |
| 2050 Springfield Dr #210 | 0.07mi | 2/2.0 | 1,512 (-2%) | 14mo | $161,000 | $106 | 81 |
| 2050 Springfield Dr #303 | 0.10mi | 2/2.0 | 1,456 (-6%) | 7mo | $170,000 | $117 | 80 |
| 2050 Springfield Dr #103 | 0.14mi | 2/2.0 | 1,680 (+8%) | 0mo | $160,015 | $95 | 79 |
| 2050 Springfield #213 | 0.04mi | 2/2.0 | 1,404 (-9%) | 5mo | $190,000 | $135 | 79 |
| 2050 Springfield Dr #155 | 0.07mi | 2/2.0 | 1,456 (-6%) | 10mo | $170,000 | $117 | 79 |
| 2050 Springfield Dr #315 | 0.06mi | 2/2.0 | 1,404 (-9%) | 6mo | $187,000 | $133 | 77 |
| 2050 Springfield Dr #204 | 0.10mi | 2/2.0 | 1,404 (-9%) | 10mo | $190,000 | $135 | 72 |
| 2050 Springfield Dr #123 | 0.08mi | 2/2.0 | 1,404 (-9%) | 20mo | $146,000 | $104 | 64 |
Match score weights: distance 35% · size 25% · config 20% · recency 20%. Top-matched comps best support the ARV.
Projected returns pro-forma
-3.0% appreciation · 3.43% rent growth · sell at horizon
- IRR
- 7.8%
- Equity multiple
- 1.31×
- Total profit
- $13,684
- Equity at exit
- $23,857
- IRR
- 17.4%
- Equity multiple
- 2.46×
- Total profit
- $65,347
- Equity at exit
- $13,834
Cash invested: $44,800 (down + closing). Projections, not guarantees.
Landlord ↔ Tenant lean methodology
- Overall (STATE)
- 18 Strongly Tenant-Friendly
- State California
- 18 Strongly Tenant-Friendly · D+13
- County
- — inherits STATE
- City
- — inherits STATE
ZIP-level market 95928
- Rents YoY
- 3.4%
- Active inventory
- 139
- Price-to-rent
- 6.5×
Monthly cashflow live
- Estimated rent
- $2,036 high interval (Pro) →
- Mortgage (P&I)
- −$839
- Tax from tax record
- −$94 /mo · $1,128/yr
- Insurance
- −$67
- HOA
- −$0
- Vacancy / Maint / Mgmt
- −$428
- Net cashflow
- $609
Break-even live
UW: 25.0% down · 7.5% · 30yr · 1.5% tax · 5.0% vac · 8.0% maint · 8.0% mgmt
Financing live
Cash to close
- Down payment
- $40,000
- Closing costs
- $4,800
- Reserves months
- —
- Total cash needed
- —
Loan-product check · same deal, 3 products live
Conventional
25% down · 7.5% · 30yr
- Down + closing
- —
- Monthly P&I
- —
- Monthly cashflow
- —
- DSCR
- —
- Eligible?
- —
Personal DTI + credit; lowest rate.
DSCR
20% down · 8.5% · 30yr
- Down + closing
- —
- Monthly P&I
- —
- Monthly cashflow
- —
- DSCR
- —
- Eligible?
- —
No personal income docs; deal must DSCR.
Hard money
10% down · 12.0% · 12mo
- Down + closing
- —
- Monthly P&I
- —
- Monthly cashflow
- —
- DSCR
- —
- Eligible?
- —
Short-term bridge; refi at stabilization.
Rent comps 16 comps
| Address | Beds | Baths | Sqft | Rent | $/sqft | DOM | Units | Dist |
|---|---|---|---|---|---|---|---|---|
| 1826 Bedford Dr Chico, CA | 3.0 | 2.0 | 1842 | $2,750 | $1.49 | 44d | 1 | 0.14mi |
| 1886 Notre Dame Blvd Unit 3 Chico, CA | 2.0 | 2.0 | 1067 | $1,915 | $1.79 | 21d | 1 | 0.27mi |
| 1890 Notre Dame Blvd Unit 3 Chico, CA | 2.0 | 2.0 | 1067 | $1,915 | $1.79 | 21d | 1 | 0.27mi |
| 1450 Springfield Dr Chico, CA | 2.0–3.0 | 2.0 | 1066 | $1,560 | $1.46 | 44d | 1 | 0.30mi |
| 1550 Springfield Dr Chico, CA | 1.0–2.0 | 1.0–2.0 | 961 | $1,518 | $1.58 | 13d | 5 | 0.42mi |
| 2038 Huntington Dr Chico, CA | 3.0 | 2.0 | 1500 | $2,300 | $1.53 | 44d | 1 | 0.45mi |
| 7 Heartwood Ct Chico, CA | 3.0 | 2.0 | 1316 | $2,350 | $1.79 | 44d | 1 | 0.51mi |
| 23 Morning Rose Way Unit 1 Chico, CA | 2.0 | 2.0 | 1145 | $1,925 | $1.68 | 44d | 1 | 0.58mi |
| 1880 Humboldt Rd Apt 19 Chico, CA | 3.0 | 2.0 | 1230 | $1,800 | $1.46 | 44d | 1 | 0.60mi |
| 860 Inyo St Chico, CA | 3.0 | 1.0 | 1053 | $2,150 | $2.04 | 21d | 1 | 0.79mi |
| 100 Sterling Oaks Dr Chico, CA | 1.0–2.0 | 1.0–2.0 | 938 | $1,935 | $2.06 | 13d | 6 | 0.88mi |
| 2361 England St Chico, CA | 3.0 | 2.5 | 1739 | $2,350 | $1.35 | 21d | 1 | 0.90mi |
| 2 Lakeshore Ter Unit l Chico, CA | 1.0 | 2.0 | 1300 | $2,000 | $1.54 | 44d | 1 | 1.08mi |
| 2768 Native Oak Dr Chico, CA | 1.0–3.0 | 1.0–2.0 | 822 | $1,056 | $1.28 | 44d | 5 | 1.11mi |
| One Illahee LN Cohasset, CA | 2.0 | 1.5 | 1080 | $1,750 | $1.62 | 13d | 1 | 1.14mi |
| 1528 Boucher St Chico, CA | 2.0 | 2.0 | 1496 | $2,000 | $1.34 | 21d | 1 | 1.30mi |
Listing history 16 events
-
2026-06-19days on market $160,000 Active 35 DOM
-
2026-06-18days on market $160,000 Active 34 DOM
-
2026-06-17days on market $160,000 Active 33 DOM
-
2026-06-16days on market $160,000 Active 32 DOM
-
2026-06-15days on market $160,000 Active 31 DOM
-
2026-06-14days on market $160,000 Active 29 DOM
-
2026-06-13pricedays on market $160,000 Active 28 DOM
-
2026-06-10days on market $185,000 Active 26 DOM
-
2026-06-08days on market $185,000 Active 24 DOM
-
2026-06-07days on market $185,000 Active 23 DOM
-
2026-06-05days on market $185,000 Active 20 DOM
-
2026-06-02days on market $185,000 Active 18 DOM
-
2026-06-01days on market $185,000 Active 17 DOM
-
2026-05-31days on market $185,000 Active 16 DOM
-
2026-05-30days on market $185,000 Active 15 DOM
-
2026-05-15$185,000 Active 1927-char remark
ⓘ Source: listings_history table (triggers on properties + properties_extension) + one-shot
backfill from property_details.listing_events for pre-trigger history.
Tax reassessment forecast CA · Resets to sale price
- Current annual tax
- $1,128 · $94/mo
- Projected year-2 tax
- $1,216 · $101/mo
- Expected delta
- +$88/yr (+$7/mo · 7.8%)
ⓘ Screening estimate from a state-policy table — verify with the county assessor before closing.
Climate risk First Street
- Flood 1/10 Low FEMA zone X (unshaded) · 0% chance over 30 yrs
- Wildfire 8/10 Severe
- Heat 8/10 Severe 6 d/yr ≥104°F today · 15 d/yr by 30 yrs out
- Wind 1/10 Low
- Air quality 10/10 Extreme 37 unhealthy d/yr today · 41 by 30 yrs out
Nearby sold comps map
Loading sold comps map…
Walkable amenities ~0.75 mi
Loading nearby amenities…
Taxation est. · year 1
- Rental income
- $24,429
- − Mortgage interest
- −$8,962
- − Property taxes
- −$1,128
- − Insurance
- −$800
- − Repairs & maintenance
- −$1,954
- − Management
- −$1,954
- − Depreciation
- −$4,655
- Taxable income
- $4,976
- Est. tax owed @ 24.0%
- −$1,194
- After-tax cash flow
- $6,109/yr
For passive investors: Depreciation is non-cash, so a rental often shows a tax loss while cash-flowing — sheltering income. Rental losses are passive: they offset passive income freely, and up to $25,000/yr can offset ordinary (W-2) income if you actively participate and your MAGI is under $100k (phasing out to $0 by $150k); unused losses carry forward. On sale, claimed depreciation is recaptured at up to 25%, and gains may owe capital-gains tax (a 1031 exchange can defer both). Figures are a year-1 estimate at your 24.0% rate — not tax advice; consult a CPA.
Schools (NCES district)
- District
- Chico Unified
- NCES district ID
- 0608370
- Math proficiency
- 40% ▼ -2.00%
- Reading proficiency
- 70% ▲ 14.00%
- Median HH income
- $46,223
- Composite
- 46.45/100
- National rank
- #2443
- State rank
- #117 of 517 in CA
Livability — Chico
- Score
- 72/100
- State rank
- #195
- US rank
- #6332
Category grades
Schools grade is shown separately in the Schools card above.
Census & demographics
- Census place
- Chico, CA
- County
- Butte County · 175,030 people
- City population
- 117,007
- Metro
- Chico, CA
- Population (ZIP)
- 37,409
- Household income
- $64,949
- Rent vs Own
- Severe rent burden
- 3612.0
Population outlook (Butte County) Hauer SSP2
- Today (2025)
- 237,527 people
- By 2030
- 243,804 · +2.6%
- By 2040
- 253,899 · +6.9%
- By 2050
- 262,561 · +10.5%
- By 2075
- 283,709 · +19.4%
- By 2100
- 282,689 · +19.0%
Race, ethnicity, and origin ACS 2023
- Neighborhood character
- Predominantly White (68%)
- Race & ethnicity
- White 68% Hispanic / Latino 20% Two or more races 12% Asian 3% Black 2%
- Hispanic origin (detail)
- Mexican 18%
- Common ancestry
- Slovak 3% Lithuanian 3% Italian 3%
- Foreign-born
- 8% · Canada, China
- Languages at home
- 83% English-only · Spanish 12% Other Indo-European 2% Other Asian/Pacific 1%
Political lean MEDSL · Butte
- 2024 margin
- Toss-up / Even · D 46.8% · R 49.9% · Other 3.3%
- 2008→2024 swing
- -5.5pp toward R · 2008: 2.4pp · 2024: -3.1pp
- All cycles
- 2024: R+3.1 2020: D+1.7 2016: R+4.0 2012: R+3.9 2008: D+2.4
Not yet ingested
- Civics
- —
Market trends
- HPI YoY
- ▼ -313.43%
- Current HPI
- 251.1819
- Rent YoY
- ▲ 3.43%
- Metro
- Chico, CA
- State GDP YoY
- ▲ 3.21%
- F500 in state
- 116
Industry mix (Fortune 500 HQ in CA)
| Industry | F500 HQs | Revenue |
|---|---|---|
| Technology | 27 | $1,492B |
|
||
| Financial Services | 3 | $174B |
|
||
| Retail | 3 | $44B |
|
||
| Insurance | 3 | $26B |
|
||
| Media / Entertainment | 2 | $115B |
|
||
| Pharmaceuticals / Biotech | 2 | $62B |
|
||
Price history
-13.5% since first listed2 events — show timeline
- 2026-06-11 Price Changed $160,000 CRMLS
- 2026-05-15 Listed $185,000 CRMLS
Property tax history
+4.6%/yrLatest (2025): $1,128 · +6.5% YoY. Source: county tax records.
Cash-flow waterfall
monthlySold comps — $/sqft
last 12 mo · ≤1 miLoading sold comps…