133 Tango Dr · Clinton, SC
Flood risk No data
- FEMA flood zone
- —
- Chance of flooding over 30 yrs
- —
- Est. flood insurance / yr
- —
Fire risk No data
- Est. fire insurance / yr
- —
Heat risk No data
- Hot days now (above threshold)
- —
- Hot days in 30 yrs
- —
Wind risk No data
- Chance of severe wind over 30 yrs
- —
Air-quality risk No data
- Unhealthy air days now
- —
- Unhealthy air days in 30 yrs
- —
Risk factors via First Street. Map © Google.
Why this score? — see what drove the C grade
The composite is a weighted blend of 9 inputs, each scored 0–100. Each bar is that input's sub-score; the figure is the points it added to the 100-point composite (weight × sub-score).
- Cash flow +23.8/30.0
- ARV discount +8.4/15.0
- DSCR +7.7/10.0
- 1% rule +6.2/10.0
- Schools +3.1/10.0
- Livability +2.8/5.0
- Rent growth +2.5/5.0
- Condition / age +2.2/5.0
- Appreciation +0.0/10.0
$169,999
🖨 Deal sheet 📄 Offer letter ✓ Due diligence
Listing remarks
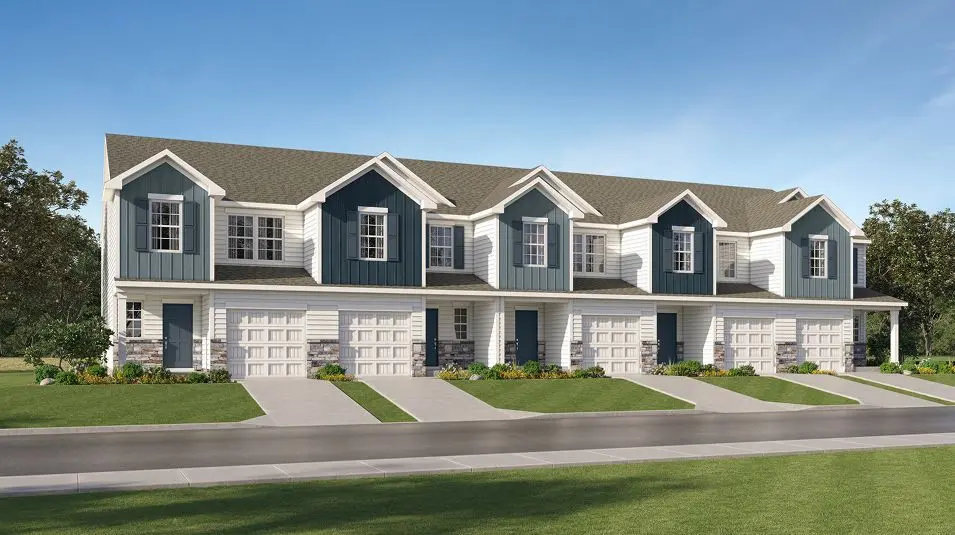
The first level of this two-story townhome is host to a spacious open floorplan shared between the kitchen, Great Room and breakfast nook. Access to a patio makes indoor-outdoor living and entertaining simple. All three bedrooms are found upstairs, including the luxe owner's suite which features an en-suite bathroom and walk-in closet.
Key facts
- Luxe owner's suite
- Walk-in closet
- Open floorplan
Tags
Property features AI
Finance
- Financial info: List price $167,999
Exterior
- Parking: 1 garage space (1 total parking space)
- Home design: Single-family spec home (Chestnut plan)
- Exterior features: Address: 133 Tango Dr, Clinton, SC 29325
Interior
- Bedrooms: 3 bedrooms
- Bathrooms: 2 full bathrooms and 1 half bathroom (2.5 total)
- Interior features: Spec home (Chestnut plan); Living area of 1,423
Neighborhood map
What this means for you Summary
Snapshot
- This is a 3-bed/2.5-bath townhouse listed at $170k. Condition is rated fair.
Deal economics
- At list price, monthly cash flow is $326 ($4k/yr) — positive.
- The deal already cash-flows at list — no discount required.
- Meets the 1% rule at list price ($2k rent vs $170k).
- Recommended offer: $167k (1.5% below list) — sets the bar for market timing.
- Cap rate 8.6% vs local median 5.1% in Clinton — top-decile yield for the area; either an underpriced asset or a hidden risk that comps aren't pricing in. Stress-test before assuming the spread holds.
Location & tenants
- Location reads 56/100 on livability (#296 in SC) — a working-class tenant base; expect higher turnover. Strengths: cost of living A+, housing A+; Watch: schools D, crime F, amenities F.
- Laurens 56 (rural): math 35% / reading 40% proficiency, ranked #38 of 80 in SC (top 48%) — families likely to look elsewhere, expect single-tenant / working-renter base with shorter leases; 73% free/reduced lunch — lower-income household profile, screen leases tightly.
- Market conditions: 128 active listings in the ZIP; 1 comparable units currently listed for rent nearby; 621 units permitted in Laurens County in 2024 (0 in 5+ unit buildings).
Forward outlook
- Local home prices are declining (-3.0%/yr); year-one equity from $1k of loan paydown is wiped out by about $5k of value loss. Plan a longer hold.
- Laurens County population projected to shrink 7% by 2050 — rents likely to lag national; underwrite the cash flow, not the appreciation.
Negotiation context
- It's been on market 17 days — a 2% lower offer ($167k) is reasonable based on typical stale-listing flexibility.
Questions for the listing agent
- Have any recent inspections been done? Can we get a copy of the seller's disclosures and any deferred-maintenance estimates?
- Is there a deadline driving the sale (1031 exchange, divorce, estate, relocation)? That informs how much negotiation room exists.
- Schools are D-rated, which usually means shorter tenancies and higher turnover. Who's the typical renter profile here, and what's been the actual vacancy rate?
- Crime grade is F in this area — have there been break-ins, vandalism, or insurance claims at this property in the last 3 years? What carrier currently insures it and at what premium?
- What's the average days-on-market for RENTAL listings here right now (not sales)? A rising rental-DOM trend means longer vacancies and softer asking-rent achievability than the comps imply.
- What's the recent tenant-quality profile in this submarket — average credit score on applications, eviction rate, late-payment / NSF rate, and stable-employment percentage? A property-management company in the area should have these aggregated.
- How much new for-sale + rental construction is in the pipeline within 1–3 miles? Heavy new supply typically softens prices + rents 12–24 months out; constrained supply supports both.
Investment metrics
- 1% rule
- 1.12% ✓
- Cap rate
- 8.60%
- Cash-on-cash
- 8.22%
- DSCR
- 1.37
- GRM
- 7.5
CMA / ARV
- ARV (on-the-fly)
- $173,606
- Comps found
- 12
Show comp detail 12 sales within ~0.75 mi
| Address | Dist | Beds/Ba | Sqft | Sold | Price | $/sf | Match |
|---|---|---|---|---|---|---|---|
| 125 Tango Dr Unit SDT 13 Chestnut B | 0.02mi | 3/2.5 | 1,423 (0%) | 2mo | $167,000 | $117 | 98 |
| 125 Tango Dr Unit ST 13 Chestnut B | 0.02mi | 3/2.5 | 1,423 (0%) | 2mo | $167,000 | $117 | 98 |
| 123 Tango Dr Unit ST 12 Chestnut A | 0.02mi | 3/2.5 | 1,423 (0%) | 3mo | $175,099 | $123 | 96 |
| 123 Tango Dr Unit ST 12 Chestnut A | 0.03mi | 3/2.5 | 1,423 (0%) | 3mo | $175,099 | $123 | 96 |
| 111 Tango Dr Unit ST 6 Chestnut BEL | 0.05mi | 3/2.5 | 1,423 (0%) | 4mo | $186,999 | $131 | 94 |
| 119 Tango Dr Unit ST 10 Magnolia BER | 0.04mi | 3/2.5 | 1,403 (-1%) | 3mo | $177,499 | $127 | 94 |
| 101 Tango Dr Unit ST 1 Chestnut BEL | 0.08mi | 3/2.5 | 1,423 (0%) | 4mo | $174,000 | $122 | 92 |
| 104 Tango Dr Unit ST 133 Chestnut B | 0.09mi | 3/2.5 | 1,423 (0%) | 5mo | $172,999 | $122 | 92 |
| 104 Tango Dr Unit ST 133 Chestnut B | 0.09mi | 3/2.5 | 1,423 (0%) | 5mo | $172,999 | $122 | 92 |
| 106 Tango Dr Unit ST 132 Chestnut A | 0.08mi | 3/2.5 | 1,423 (0%) | 6mo | $169,149 | $119 | 91 |
| 106 Tango Dr | 0.09mi | 3/2.5 | 1,423 (0%) | 6mo | $169,149 | $119 | 91 |
| 102 Tango Dr Unit ST 134 Magnolia A | 0.10mi | 3/2.5 | 1,403 (-1%) | 4mo | $171,059 | $122 | 90 |
Match score weights: distance 35% · size 25% · config 20% · recency 20%. Top-matched comps best support the ARV.
Projected returns pro-forma
-3.0% appreciation · 3.0% rent growth · sell at horizon
- IRR
- -3.8%
- Equity multiple
- 0.86×
- Total profit
- $-6,744
- Equity at exit
- $25,347
- IRR
- 5.9%
- Equity multiple
- 1.44×
- Total profit
- $20,994
- Equity at exit
- $14,698
Cash invested: $47,600 (down + closing). Projections, not guarantees.
Landlord ↔ Tenant lean methodology
- Overall (STATE)
- 90 Strongly Landlord-Friendly
- State South Carolina
- 90 Strongly Landlord-Friendly · R+6
- County
- — inherits STATE
- City
- — inherits STATE
ZIP-level market 29325
- Active inventory
- 128
- Price-to-rent
- 7.5×
Monthly cashflow live
- Estimated rent
- $1,900 medium interval (Pro) →
- Mortgage (P&I)
- −$891
- Tax est. 1.5%
- −$212 /mo · $2,550/yr
- Insurance
- −$71
- HOA
- −$0
- Vacancy / Maint / Mgmt
- −$399
- Net cashflow
- $326
Break-even live
UW: 25.0% down · 7.5% · 30yr · 1.5% tax · 5.0% vac · 8.0% maint · 8.0% mgmt
Financing live
Cash to close
- Down payment
- $42,500
- Closing costs
- $5,100
- Reserves months
- —
- Total cash needed
- —
Loan-product check · same deal, 3 products live
Conventional
25% down · 7.5% · 30yr
- Down + closing
- —
- Monthly P&I
- —
- Monthly cashflow
- —
- DSCR
- —
- Eligible?
- —
Personal DTI + credit; lowest rate.
DSCR
20% down · 8.5% · 30yr
- Down + closing
- —
- Monthly P&I
- —
- Monthly cashflow
- —
- DSCR
- —
- Eligible?
- —
No personal income docs; deal must DSCR.
Hard money
10% down · 12.0% · 12mo
- Down + closing
- —
- Monthly P&I
- —
- Monthly cashflow
- —
- DSCR
- —
- Eligible?
- —
Short-term bridge; refi at stabilization.
Rent comps 1 comps
| Address | Beds | Baths | Sqft | Rent | $/sqft | DOM | Units | Dist |
|---|---|---|---|---|---|---|---|---|
| 203 E Florida St Clinton, SC | 3.0 | 3.5 | 1500 | $1,900 | $1.27 | 3d | 1 | 1.41mi |
Listing history 14 events
-
2026-06-19days on market $169,999 Active 17 DOM
-
2026-06-18days on market $169,999 Active 16 DOM
-
2026-06-17days on market $169,999 Active 15 DOM
-
2026-06-17price $169,999 Active 14 DOM
-
2026-06-16days on market $168,999 Active 14 DOM
-
2026-06-15days on market $168,999 Active 13 DOM
-
2026-06-14days on market $168,999 Active 11 DOM
-
2026-06-12days on market $168,999 Active 10 DOM
-
2026-06-09days on market $168,999 Active 7 DOM
-
2026-06-08days on market $168,999 Active 6 DOM
-
2026-06-07days on market $168,999 Active 5 DOM
-
2026-06-07pricedays on market $168,999 Active 4 DOM
-
2026-06-03remarks 337-char remark
-
2026-06-03$167,999 Active 1 DOM
ⓘ Source: listings_history table (triggers on properties + properties_extension) + one-shot
backfill from property_details.listing_events for pre-trigger history.
Nearby sold comps map
Loading sold comps map…
Walkable amenities ~0.75 mi
Loading nearby amenities…
Taxation est. · year 1
- Rental income
- $22,800
- − Mortgage interest
- −$9,523
- − Property taxes
- −$2,550
- − Insurance
- −$850
- − Repairs & maintenance
- −$1,824
- − Management
- −$1,824
- − Depreciation
- −$4,945
- Taxable income
- $1,284
- Est. tax owed @ 24.0%
- −$308
- After-tax cash flow
- $3,606/yr
For passive investors: Depreciation is non-cash, so a rental often shows a tax loss while cash-flowing — sheltering income. Rental losses are passive: they offset passive income freely, and up to $25,000/yr can offset ordinary (W-2) income if you actively participate and your MAGI is under $100k (phasing out to $0 by $150k); unused losses carry forward. On sale, claimed depreciation is recaptured at up to 25%, and gains may owe capital-gains tax (a 1031 exchange can defer both). Figures are a year-1 estimate at your 24.0% rate — not tax advice; consult a CPA.
Condition & rehab AI · 2 photos
This two-story townhome is in fair condition with good exterior and interior walls. It has a good roof and flooring. Painting the exterior siding and improving landscaping would significantly enhance its value.
Value-add opportunities
- Both Paint exterior siding — Painting the exterior siding can improve curb appeal and add value to the property.
- Both Landscaping improvements — Well-maintained landscaping can enhance the property's curb appeal and attract potential buyers or renters.
Renovation cost estimate screening
Value-add ROI direction
- Both Paint exterior siding — Painting the exterior siding can improve curb appeal and add value to the property. ↑
- Both Landscaping improvements — Well-maintained landscaping can enhance the property's curb appeal and attract potential buyers or renters. ↑
ⓘ Cost ranges are severity-bucket heuristics (US national rule-of-thumb). Get contractor quotes + a written scope before underwriting a rehab budget.
Schools (NCES district)
- District
- Laurens 56
- NCES district ID
- 4502640
- Math proficiency
- 35% ▼ -5.00%
- Reading proficiency
- 40% ▲ 3.00%
- Median HH income
- $35,830
- Composite
- 31.05/100
- National rank
- #6079
- State rank
- #38 of 80 in SC
Livability — Clinton
- Score
- 56/100
- State rank
- #296
- US rank
- #22922
Category grades
Schools grade is shown separately in the Schools card above.
Census & demographics
- Census place
- Clinton, SC
- City population
- 14,164
- Population (ZIP)
- 14,164
Population outlook (Laurens County) Hauer SSP2
- Today (2025)
- 66,741 people
- By 2030
- 66,454 · -0.4%
- By 2040
- 64,881 · -2.8%
- By 2050
- 61,941 · -7.2%
- By 2075
- 53,266 · -20.2%
- By 2100
- 41,495 · -37.8%
Race, ethnicity, and origin ACS 2023
- Neighborhood character
- Majority White (59%)
- Race & ethnicity
- White 59% Black 33% Two or more races 4% Hispanic / Latino 3%
- Common ancestry
- Serbian 3% Slovak 2% Lithuanian 1%
- Foreign-born
- 2% · Canada
- Languages at home
- 96% English-only · Spanish 2%
Political lean MEDSL · Laurens
- 2024 margin
- Solid R (+40.9) · D 29.0% · R 69.9% · Other 1.1%
- 2008→2024 swing
- -22.8pp toward R · 2008: -18.1pp · 2024: -40.9pp
- All cycles
- 2024: R+40.9 2020: R+32.3 2016: R+29.9 2012: R+17.5 2008: R+18.1
Not yet ingested
- Civics
- —
Market trends
- HPI YoY
- ▼ -86.54%
- Current HPI
- 150.1573
- Rent YoY
- —
- Metro
- —
- State GDP YoY
- ▲ 4.51%
- F500 in state
- 2
Industry mix (Fortune 500 HQ in SC)
| Industry | F500 HQs | Revenue |
|---|---|---|
| Packaging | 1 | $7B |
|
||
Cash-flow waterfall
monthlySold comps — $/sqft
last 12 mo · ≤1 miLoading sold comps…