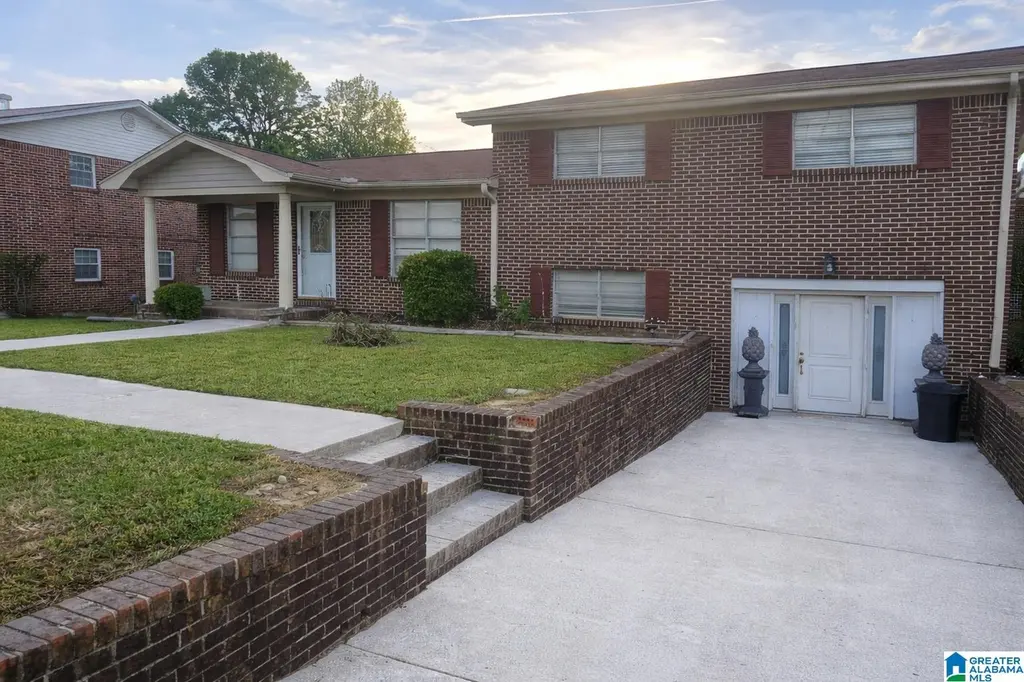
4852 Smithfield Dr N · Birmingham, AL
Flood risk 1/10 · Minimal
- FEMA flood zone
- X (unshaded)
- Chance of flooding over 30 yrs
- 0.0%
- Est. flood insurance / yr
- $473 – $860
Fire risk 4/10 · Minor
- Est. fire insurance / yr
- $916 – $1,700
Heat risk 6/10 · Moderate
- Hot days now (above 107°F)
- 7 days/yr
- Hot days in 30 yrs
- 20 days/yr
Wind risk 6/10 · Moderate
- Chance of severe wind over 30 yrs
- 27.0%
Air-quality risk 5/10 · Moderate
- Unhealthy air days now
- 9 days/yr
- Unhealthy air days in 30 yrs
- 10 days/yr
Risk factors via First Street. Map © Google.
Why this score? — see what drove the A- grade
The composite is a weighted blend of 9 inputs, each scored 0–100. Each bar is that input's sub-score; the figure is the points it added to the 100-point composite (weight × sub-score).
- Cash flow +30.0/30.0
- ARV discount +15.0/15.0
- DSCR +10.0/10.0
- Appreciation +10.0/10.0
- 1% rule +8.8/10.0
- Livability +3.4/5.0
- Rent growth +2.5/5.0
- Condition / age +2.5/5.0
- Schools +1.8/10.0
$150,000
🖨 Deal sheet 📄 Offer letter ✓ Due diligence
Listing remarks MLS
Welcome to this solid 4-sided brick home located in the desirable N. Smithfield Manor community! This 3BR, 1.5 bath home offers a functional layout with plenty of space to make your own. Step inside to find a comfortable living room, dedicated dining area, and a kitchen ready for your personal touch. Beautiful original hardwood floors add character and warmth, giving the home timeless appeal. Downstairs, you'll love the large family room- perfect for gatherings and entertaining. This home is ideal for first time buyers or investors, offering great bones and just needing a little TLC to truly shine. Outside enjoy a storage building for added convenience and extra space. Located in a welcoming neighborhood, residents have access to a community park, two storm shelters, and even a neighborhood fire department-adding both charm and a peace of mind. Don't miss this opportunity to turn this house into you perfect home! Property is being sold AS IS.
Key facts
- Large family room
- Storage building
- 4 sided brick home
Tags
Neighborhood map
What this means for you Summary
Snapshot
- This is a 3-bed/1.0-bath single-family listed at $150k.
Deal economics
- At list price, monthly cash flow is $593 ($7k/yr) — positive.
- The deal already cash-flows at list — no discount required.
- Meets the 1% rule at list price ($2k rent vs $150k).
- Recommended offer: $141k (6.0% below list) — sets the bar for market timing.
- Cap rate 11.0% vs local median 6.2% in Birmingham — top-decile yield for the area; either an underpriced asset or a hidden risk that comps aren't pricing in. Stress-test before assuming the spread holds.
Location & tenants
- Location reads 67/100 on livability (#78 in AL) — a middle-class / working-renter tenant base. Strengths: commute A+, cost of living A+, housing A+; Watch: amenities C-, schools F, crime F.
- Jefferson County (suburban): math 9% / reading 32% proficiency, ranked #104 of 129 in AL (top 81%) — low school quality limits family demand, transient renter base, plan for 1-2y turnover.
- Market conditions: 42 active listings in the ZIP; 4 comparable units currently listed for rent nearby; rentals at typical pace (median 16d on market — plan ~3-4 weeks tenant-placement turnaround); 2,114 units permitted in Jefferson County in 2024 (556 in 5+ unit buildings).
Forward outlook
- In year one you build about $16k of equity ($1k loan paydown + $15k appreciation (10.0% local appreciation)).
- Jefferson County population projected to shrink 4% by 2050 — rents likely to lag national; underwrite the cash flow, not the appreciation.
- At projected returns (10.0% appreciation + 3.0% rent growth), your $42k cash investment doubles in ~2 years — after that, you're playing with house money.
- By year 3, paydown + projected appreciation supports a ~$41k cash-out refi (75% LTV) — recoverable capital for the next deal without selling this one.
Negotiation context
- It's been on market 72 days — a 6% lower offer ($141k) is reasonable based on typical stale-listing flexibility.
Risks & watch-outs
- Climate carrying-cost: major wind risk, 27% chance of damaging wind over 30y; extreme-heat days projected 7→20/yr by 2055 (HVAC capex compounding) — expect insurance premiums to compound above CPI over the hold.
Questions for the listing agent
- It's been on market 72 days. Have you received any prior offers? Is the seller open to a 6% concession, seller financing, or rate buy-down credit?
- Built in 1969 — when were the roof, HVAC, electrical panel, plumbing, and water heater last replaced?
- Why hasn't it sold? Are there any deal-killer items the seller is aware of (foundation, flood, title, zoning, code violations)?
- Is there a deadline driving the sale (1031 exchange, divorce, estate, relocation)? That informs how much negotiation room exists.
- Schools are F-rated, which usually means shorter tenancies and higher turnover. Who's the typical renter profile here, and what's been the actual vacancy rate?
- Crime grade is F in this area — have there been break-ins, vandalism, or insurance claims at this property in the last 3 years? What carrier currently insures it and at what premium?
- What's the average days-on-market for RENTAL listings here right now (not sales)? A rising rental-DOM trend means longer vacancies and softer asking-rent achievability than the comps imply.
- What's the recent tenant-quality profile in this submarket — average credit score on applications, eviction rate, late-payment / NSF rate, and stable-employment percentage? A property-management company in the area should have these aggregated.
- How much new for-sale + rental construction is in the pipeline within 1–3 miles? Heavy new supply typically softens prices + rents 12–24 months out; constrained supply supports both.
Investment metrics
- 1% rule
- 1.38% ✓
- Cap rate
- 11.04%
- Cash-on-cash
- 16.94%
- DSCR
- 1.75
- GRM
- 6.1
CMA / ARV
- ARV (median comp)
- $221,426
- List price
- $150,000
- Delta
- -32.26%
- Verdict
- UNDERPRICED
- Comps
- 20 within 1.0 mi
Show comp detail 6 sales within ~0.75 mi
| Address | Dist | Beds/Ba | Sqft | Sold | Price | $/sf | Match |
|---|---|---|---|---|---|---|---|
| 4836 Smithfield Dr N | 0.05mi | 3/2.0 | 1,908 (+0%) | 16mo | $123,000 | $64 | 80 |
| 4826 Leola Ln | 0.12mi | 4/2.0 (+1) | 1,869 (-2%) | 7mo | $242,000 | $129 | 77 |
| 2012 Leola Ave | 0.16mi | 3/2.0 | 1,888 (-1%) | 16mo | $174,300 | $92 | 74 |
| 2233 Smithfield Ln N | 0.13mi | 4/2.0 (+1) | 1,850 (-3%) | 18mo | $162,000 | $88 | 66 |
| 4728 N Smithfield Dr | 0.29mi | 3/2.0 | 1,690 (-11%) | 4mo | $235,000 | $139 | 61 |
| 2343 Belmore Ln | 0.46mi | 4/2.0 (+1) | 1,798 (-6%) | 18mo | $247,000 | $137 | 45 |
Match score weights: distance 35% · size 25% · config 20% · recency 20%. Top-matched comps best support the ARV.
Projected returns pro-forma
10.0% appreciation · 3.0% rent growth · sell at horizon
- IRR
- 36.8%
- Equity multiple
- 3.85×
- Total profit
- $119,495
- Equity at exit
- $135,132
- IRR
- 31.7%
- Equity multiple
- 8.67×
- Total profit
- $322,254
- Equity at exit
- $291,417
Cash invested: $42,000 (down + closing). Projections, not guarantees.
Landlord ↔ Tenant lean methodology
- Overall (STATE)
- 90 Strongly Landlord-Friendly
- State Alabama
- 90 Strongly Landlord-Friendly · R+15
- County
- — inherits STATE
- City
- — inherits STATE
ZIP-level market 35207
- Home prices YoY
- 18.7%
- Active inventory
- 42
- Price-to-rent
- 6.1×
Monthly cashflow live
- Estimated rent
- $2,063 medium interval (Pro) →
- Mortgage (P&I)
- −$787
- Tax est. 1.5%
- −$188 /mo · $2,250/yr
- Insurance
- −$62
- HOA
- −$0
- Vacancy / Maint / Mgmt
- −$433
- Net cashflow
- $593
Break-even live
UW: 25.0% down · 7.5% · 30yr · 1.5% tax · 5.0% vac · 8.0% maint · 8.0% mgmt
Financing live
Cash to close
- Down payment
- $37,500
- Closing costs
- $4,500
- Reserves months
- —
- Total cash needed
- —
Loan-product check · same deal, 3 products live
Conventional
25% down · 7.5% · 30yr
- Down + closing
- —
- Monthly P&I
- —
- Monthly cashflow
- —
- DSCR
- —
- Eligible?
- —
Personal DTI + credit; lowest rate.
DSCR
20% down · 8.5% · 30yr
- Down + closing
- —
- Monthly P&I
- —
- Monthly cashflow
- —
- DSCR
- —
- Eligible?
- —
No personal income docs; deal must DSCR.
Hard money
10% down · 12.0% · 12mo
- Down + closing
- —
- Monthly P&I
- —
- Monthly cashflow
- —
- DSCR
- —
- Eligible?
- —
Short-term bridge; refi at stabilization.
Rent comps 4 comps
| Address | Beds | Baths | Sqft | Rent | $/sqft | DOM | Units | Dist |
|---|---|---|---|---|---|---|---|---|
| 2931 Summit Dr Fultondale, AL | 3.0 | 2.0 | 1327 | $1,900 | $1.43 | 2d | 1 | 1.02mi |
| 2938 Summit Dr Fultondale, AL | 4.0 | 2.0 | 1956 | $2,200 | $1.12 | 1d | 1 | 1.04mi |
| 3143 Enclave Ln Fultondale, AL | 3.0 | 2.0 | 1424 | $1,950 | $1.37 | 19d | 1 | 1.25mi |
| 465 W Park Dr Fultondale, AL | 4.0 | 2.5 | 2159 | $2,146 | $0.99 | 16d | 1 | 1.44mi |
Listing history 14 events
-
2026-06-18days on market $150,000 Active 72 DOM
-
2026-06-17days on market $150,000 Active 71 DOM
-
2026-06-16days on market $150,000 Active 70 DOM
-
2026-06-15days on market $150,000 Active 69 DOM
-
2026-06-13days on market $150,000 Active 67 DOM
-
2026-06-10days on market $150,000 Active 64 DOM
-
2026-06-09days on market $150,000 Active 63 DOM
-
2026-06-08days on market $150,000 Active 62 DOM
-
2026-06-07days on market $150,000 Active 61 DOM
-
2026-06-03days on market $150,000 Active 57 DOM
-
2026-06-02days on market $150,000 Active 56 DOM
-
2026-06-01days on market $150,000 Active 55 DOM
-
2026-05-31days on market $150,000 Active 54 DOM
-
2026-04-08$150,000 Active 956-char remark
Show marketing remark (956 chars)
Welcome to this solid 4-sided brick home located in the desirable N. Smithfield Manor community! This 3BR, 1.5 bath home offers a functional layout with plenty of space to make your own. Step inside to find a comfortable living room, dedicated dining area, and a kitchen ready for your personal touch. Beautiful original hardwood floors add character and warmth, giving the home timeless appeal. Downstairs, you'll love the large family room- perfect for gatherings and entertaining. This home is ideal for first time buyers or investors, offering great bones and just needing a little TLC to truly shine. Outside enjoy a storage building for added convenience and extra space. Located in a welcoming neighborhood, residents have access to a community park, two storm shelters, and even a neighborhood fire department-adding both charm and a peace of mind. Don't miss this opportunity to turn this house into you perfect home! Property is being sold AS IS.
ⓘ Source: listings_history table (triggers on properties + properties_extension) + one-shot
backfill from property_details.listing_events for pre-trigger history.
Climate risk First Street
- Flood 1/10 Low FEMA zone X (unshaded) · 0% chance over 30 yrs
- Wildfire 4/10 Moderate
- Heat 6/10 Major 7 d/yr ≥107°F today · 20 d/yr by 30 yrs out
- Wind 6/10 Major 27% chance of damaging wind over 30 yrs
- Air quality 5/10 Major 9 unhealthy d/yr today · 10 by 30 yrs out
Nearby sold comps map
Loading sold comps map…
Walkable amenities ~0.75 mi
Loading nearby amenities…
Taxation est. · year 1
- Rental income
- $24,754
- − Mortgage interest
- −$8,402
- − Property taxes
- −$2,250
- − Insurance
- −$750
- − Repairs & maintenance
- −$1,980
- − Management
- −$1,980
- − Depreciation
- −$4,364
- Taxable income
- $5,027
- Est. tax owed @ 24.0%
- −$1,207
- After-tax cash flow
- $5,910/yr
For passive investors: Depreciation is non-cash, so a rental often shows a tax loss while cash-flowing — sheltering income. Rental losses are passive: they offset passive income freely, and up to $25,000/yr can offset ordinary (W-2) income if you actively participate and your MAGI is under $100k (phasing out to $0 by $150k); unused losses carry forward. On sale, claimed depreciation is recaptured at up to 25%, and gains may owe capital-gains tax (a 1031 exchange can defer both). Figures are a year-1 estimate at your 24.0% rate — not tax advice; consult a CPA.
Schools (NCES district)
- District
- Jefferson County
- NCES district ID
- 0101920
- Math proficiency
- 9% ▼ -24.00%
- Reading proficiency
- 32% ▼ -5.00%
- Median HH income
- $51,712
- Composite
- 18.4/100
- National rank
- #8937
- State rank
- #104 of 129 in AL
Livability — Birmingham
- Score
- 67/100
- State rank
- #78
- US rank
- #10412
Category grades
Schools grade is shown separately in the Schools card above.
Census & demographics
- City population
- 210,422
- Population (ZIP)
- 6,824
Population outlook (Jefferson County) Hauer SSP2
- Today (2025)
- 669,185 people
- By 2030
- 669,694 · +0.1%
- By 2040
- 661,388 · -1.2%
- By 2050
- 643,086 · -3.9%
- By 2075
- 577,267 · -13.7%
- By 2100
- 474,758 · -29.1%
Race, ethnicity, and origin ACS 2023
- Neighborhood character
- Predominantly Black (86%)
- Race & ethnicity
- Black 86% White 7% Hispanic / Latino 6%
- Hispanic origin (detail)
- Mexican 5%
- Common ancestry
- Romanian 1% Hispanic 1%
- Foreign-born
- 3% · Canada
- Languages at home
- 92% English-only · Spanish 6% French/Haitian/Cajun 1%
Political lean MEDSL · Jefferson
- 2024 margin
- D (+10.4) · D 54.6% · R 44.2% · Other 1.2%
- 2008→2024 swing
- +5.4pp toward D · 2008: 5.1pp · 2024: 10.4pp
- All cycles
- 2024: D+10.4 2020: D+13.2 2016: D+7.2 2012: D+6.0 2008: D+5.1
Not yet ingested
- Civics
- —
Market trends
- HPI YoY
- ▲ 35.95%
- Current HPI
- 228.5664
- Rent YoY
- —
- Metro
- —
- State GDP YoY
- ▲ 2.94%
- F500 in state
- 4
Industry mix (Fortune 500 HQ in AL)
| Industry | F500 HQs | Revenue |
|---|---|---|
| Financial Services | 1 | $8B |
|
||
| Healthcare | 1 | $5B |
|
||
Price history
1 event — show timeline
- 2026-04-08 Listed $150,000 Greater Alabama MLS
Cash-flow waterfall
monthlySold comps — $/sqft
last 12 mo · ≤1 miLoading sold comps…