8023 Biggio Ln · San Antonio, TX
Flood risk No data
- FEMA flood zone
- —
- Chance of flooding over 30 yrs
- —
- Est. flood insurance / yr
- —
Fire risk No data
- Est. fire insurance / yr
- —
Heat risk No data
- Hot days now (above threshold)
- —
- Hot days in 30 yrs
- —
Wind risk No data
- Chance of severe wind over 30 yrs
- —
Air-quality risk No data
- Unhealthy air days now
- —
- Unhealthy air days in 30 yrs
- —
Risk factors via First Street. Map © Google.
Why this score? — see what drove the D+ grade
The composite is a weighted blend of 9 inputs, each scored 0–100. Each bar is that input's sub-score; the figure is the points it added to the 100-point composite (weight × sub-score).
- Cash flow +13.6/30.0
- ARV discount +10.3/15.0
- Condition / age +5.0/5.0
- 1% rule +4.1/10.0
- DSCR +4.1/10.0
- Livability +4.0/5.0
- Rent growth +2.2/5.0
- Schools +1.9/10.0
- Appreciation +0.0/10.0
$188,999
🖨 Deal sheet (PDF) 📄 Offer letter ✓ Due diligence
Listing remarks
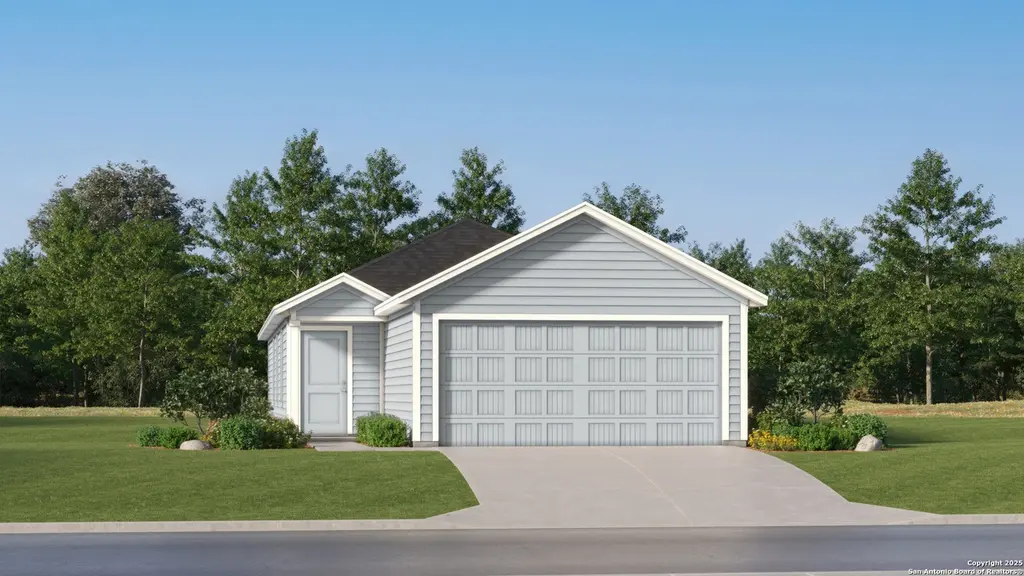
The Gerson - This new single-story home features a modern layout with room to grow. The stylish kitchen shares a footprint with the living and dining areas, and a covered patio provides convenient outdoor access. Three bedrooms are placed to the side of the home, including the luxe owner's suite, complete with an en-suite bathroom and generous walk-in closet. Estimated Completion August 2026. The completion date, prices and features may vary and are subject to change. Please verify with Lennar directly. Photos are for illustrative purposes only.
Key facts
- Luxe owner's suite
- Walk-in closet
- Stylish kitchen
Tags
Property features AI
Finance
- Other: Subdivision: Enclave at Horizon Pointe
- HOA & community: Mandatory HOA; HOA fee $125 paid quarterly; Association transfer fee $450
Exterior
- Parking: 2-car garage
- Utilities: Gas supplied by CPS; Electricity supplied by CPS; Water supplied by SAWS; Sewer supplied by SAWS; Garbage service by Frontier; Connected to water and sewer systems
- Home design: New construction by Lennar
- Construction: Slab foundation; Composition roof
- Exterior features: Brick, siding, and cement fiber exterior
Interior
- Kitchen: Stove/Range; Dishwasher
- Bedrooms: Master bedroom on lower level with walk-in closet and full bath; Bedroom 2 approximately 10 x 12; Bedroom 3 approximately 12 x 10; Master bedroom approximately 11 x 13
- Flooring: Carpeting; Vinyl flooring
- Bathrooms: Two full bathrooms; Master bath with shower only and single vanity
- Heating & cooling: Central heating; Electric and natural gas heating; Central air conditioning
- Interior features: Open floor plan; One living area; Utility room inside; Laundry room on main level; All bedrooms on lower level; Walk-in closets
- Laundry & utility: Washer connection; Dryer connection; Laundry room inside (main level)
Neighborhood map
What this means for you Summary
Snapshot
- This is a 3-bed/2.0-bath single-family listed at $189k. Condition is rated excellent.
Deal economics
- At list price, monthly cash flow is $10 ($123/yr) — positive.
- The deal already cash-flows at list — no discount required.
- To meet the 1% rule (rent ≥ 1% of price), the offer needs to be $172k (9.0% below list).
- Recommended offer: $172k (9.0% below list) — sets the bar for 1% rule.
- Cap rate 6.4% vs local median 3.8% in San Antonio — top-decile yield for the area; either an underpriced asset or a hidden risk that comps aren't pricing in. Stress-test before assuming the spread holds.
Location & tenants
- Location reads 80/100 on livability (#31 in TX, #1,616 nationally) — a professional / high-income tenant draw. Strengths: amenities A+, commute A+, cost of living A+; Watch: crime F.
- East Central ISD (rural): math 16% / reading 25% proficiency, ranked #758 of 826 in TX (top 92%) — low school quality limits family demand, transient renter base, plan for 1-2y turnover; 61% free/reduced lunch — lower-income household profile, screen leases tightly.
- Zoned schools: East Central Heritage Middle (math 11% / reading 26%, grade F, #1,478 of 1,662 statewide, top 90%, 1,120 students, 44% FRL); East Central H S (math 21% / reading 28%, grade F, #1,264 of 1,632 statewide, top 82%, 3,252 students, 52% FRL).
- Market conditions: Rents soft (-1.1%/yr); 1207 active listings in the ZIP; 40 comparable units currently listed for rent nearby; rentals at typical pace (median 17d on market — plan ~3-4 weeks tenant-placement turnaround); solid renter incomes; 8,308 units permitted in Bexar County in 2024 (2,506 in 5+ unit buildings).
Forward outlook
- Local home prices are declining (-3.0%/yr); year-one equity from $1k of loan paydown is wiped out by about $6k of value loss. Plan a longer hold.
- Bexar County population projected at +50% by 2050 — long-run rental-demand tailwind backs the buy-and-hold thesis.
Negotiation context
- It's been on market 23 days — a 2% lower offer ($186k) is reasonable based on typical stale-listing flexibility.
Questions for the listing agent
- What does the HOA fee cover, when was the last increase, and are there any pending special assessments or reserve-fund shortfalls?
- Is there a deadline driving the sale (1031 exchange, divorce, estate, relocation)? That informs how much negotiation room exists.
- Crime grade is F in this area — have there been break-ins, vandalism, or insurance claims at this property in the last 3 years? What carrier currently insures it and at what premium?
- The area grade is low — what's the realistic commute time and amenity access for the typical tenant pool here? Any planned neighborhood developments (good or bad) we should know about?
- What's the average days-on-market for RENTAL listings here right now (not sales)? A rising rental-DOM trend means longer vacancies and softer asking-rent achievability than the comps imply.
- What's the recent tenant-quality profile in this submarket — average credit score on applications, eviction rate, late-payment / NSF rate, and stable-employment percentage? A property-management company in the area should have these aggregated.
- How much new for-sale + rental construction is in the pipeline within 1–3 miles? Heavy new supply typically softens prices + rents 12–24 months out; constrained supply supports both.
Investment metrics
- 1% rule
- 0.91% ✗
- Cap rate
- 6.36%
- Cash-on-cash
- 0.23%
- DSCR
- 1.01
- GRM
- 9.2
CMA / ARV
- ARV (on-the-fly)
- $201,746
- Comps found
- 12
Show comp detail 12 sales within ~0.75 mi
| Address | Dist | Beds/Ba | Sqft | Sold | Price | $/sf | Match |
|---|---|---|---|---|---|---|---|
| 8010 Biggio Ln | 0.00mi | 3/2.0 | 1,354 (0%) | 1mo | $192,999 | $143 | 99 |
| 8018 Biggio Ln | 0.00mi | 3/2.0 | 1,354 (0%) | 1mo | $210,999 | $156 | 99 |
| 8002 Biggio Ln | 0.00mi | 3/2.0 | 1,354 (0%) | 2mo | $187,999 | $139 | 98 |
| 11537 Cinnamon Rose | 0.00mi | 3/2.0 | 1,380 (+2%) | 0mo | $164,999 | $120 | 96 |
| 2227 Camellia Rose | 0.00mi | 3/2.0 | 1,380 (+2%) | 2mo | $169,999 | $123 | 95 |
| 2013 Chicksaw Rose | 0.00mi | 3/2.0 | 1,402 (+4%) | 2mo | $208,999 | $149 | 93 |
| 1405 Sequoia Park | 0.00mi | 3/2.0 | 1,434 (+6%) | 2mo | $245,865 | $171 | 89 |
| 10324 Lassen Park | 0.00mi | 3/2.0 | 1,434 (+6%) | 2mo | $243,500 | $170 | 89 |
| 10313 Lassen Park | 0.00mi | 3/2.5 | 1,470 (+9%) | 1mo | $276,499 | $188 | 83 |
| 8030 Biggio Ln | 0.00mi | 4/2.0 (+1) | 1,483 (+10%) | 1mo | $205,999 | $139 | 78 |
| 8014 Biggio Ln | 0.00mi | 4/2.0 (+1) | 1,483 (+10%) | 1mo | $218,999 | $148 | 78 |
| 9427 Lochridge Pike | 0.44mi | 3/2.0 | 1,271 (-6%) | 1mo | $242,294 | $191 | 69 |
Match score weights: distance 35% · size 25% · config 20% · recency 20%. Top-matched comps best support the ARV.
Projected returns pro-forma
-3.0% appreciation · 0.0% rent growth · sell at horizon
- IRR
- -19.4%
- Equity multiple
- 0.34×
- Total profit
- $-34,960
- Equity at exit
- $28,180
- IRR
- -20.5%
- Equity multiple
- 0.08×
- Total profit
- $-48,865
- Equity at exit
- $16,341
Cash invested: $52,920 (down + closing). Projections, not guarantees.
Landlord ↔ Tenant lean methodology
- Overall (STATE)
- 87 Strongly Landlord-Friendly
- State Texas
- 87 Strongly Landlord-Friendly · R+5
- County
- — inherits STATE
- City
- — inherits STATE
ZIP-level market 78109
- Home prices YoY
- -17.8%
- Rents YoY
- -1.1%
- Active inventory
- 1207
- Price-to-rent
- 9.2×
Monthly cashflow live
- Estimated rent
- $1,719 high interval (Pro) →
- Mortgage (P&I)
- −$991
- Tax est. 1.5%
- −$236 /mo · $2,835/yr
- Insurance
- −$79
- HOA
- −$42
- Vacancy / Maint / Mgmt
- −$361
- Net cashflow
- $10
Break-even live
Sensitivity live
| Price | -10% $141 | -5% $76 | +0% $10 | +5% $-55 | +10% $-120 |
|---|---|---|---|---|---|
| Rent | -10% $-126 | -5% $-58 | +0% $10 | +5% $78 | +10% $146 |
| Rate | -1.0pp $105 | -0.5pp $58 | base $10 | +0.5pp $-39 | +1.0pp $-89 |
UW: 25.0% down · 7.5% · 30yr · 1.5% tax · 5.0% vac · 8.0% maint · 8.0% mgmt
Financing live
Cash to close
- Down payment
- $47,250
- Closing costs
- $5,670
- Reserves months
- —
- Total cash needed
- —
Loan-product check · same deal, 3 products live
Conventional
25% down · 7.5% · 30yr
- Down + closing
- —
- Monthly P&I
- —
- Monthly cashflow
- —
- DSCR
- —
- Eligible?
- —
Personal DTI + credit; lowest rate.
DSCR
20% down · 8.5% · 30yr
- Down + closing
- —
- Monthly P&I
- —
- Monthly cashflow
- —
- DSCR
- —
- Eligible?
- —
No personal income docs; deal must DSCR.
Hard money
10% down · 12.0% · 12mo
- Down + closing
- —
- Monthly P&I
- —
- Monthly cashflow
- —
- DSCR
- —
- Eligible?
- —
Short-term bridge; refi at stabilization.
Rent comps 40 comps
| Address | Beds | Baths | Sqft | Rent | $/sqft | DOM | Units | Dist |
|---|---|---|---|---|---|---|---|---|
| 5625 Rowan RDG Converse, TX | 3.0 | 2.5 | 1605 | $1,700 | $1.06 | 6d | 1 | 0.01mi |
| 11810 Spiderwort RDG Converse, TX | 4.0 | 2.5 | 1535 | $1,497 | $0.98 | 45d | 1 | 0.01mi |
| 11621 Dog Rose Converse, TX | 4.0 | 2.0 | 1500 | $1,495 | $1.00 | 6d | 1 | 0.01mi |
| 11710 California Rose Converse, TX | 4.0 | 2.5 | 1867 | $1,635 | $0.88 | 23d | 1 | 0.01mi |
| 12533 Spoor VLY Converse, TX | 3.0 | 2.0 | 1160 | $1,600 | $1.38 | 0d | 1 | 0.01mi |
| 9411 Braman Pt Converse, TX | 4.0 | 2.0 | 1703 | $1,850 | $1.09 | 0d | 1 | 0.28mi |
| 4611 East Loop 1604 N Unit 710 Converse, TX | 2.0 | 2.0 | 900 | $973 | $1.08 | 0d | 1 | 0.30mi |
| 5510 Cibolo Pass Unit 1 Converse, TX | 3.0 | 2.0 | 1253 | $1,695 | $1.35 | 25d | 1 | 0.57mi |
| 5423 Devils Gate Converse, TX | 3.0 | 2.0 | 1287 | $1,650 | $1.28 | 13d | 1 | 0.63mi |
| 5435 Devils Gate Converse, TX | 3.0 | 2.0 | 1243 | $1,650 | $1.33 | 4d | 1 | 0.65mi |
| 5435 Devils Gate Unit 1 Converse, TX | 3.0 | 2.0 | 1243 | $1,650 | $1.33 | 16d | 1 | 0.65mi |
| 5506 Rio Cyn Unit 2 Converse, TX | 3.0 | 2.0 | 1351 | $1,549 | $1.15 | 45d | 1 | 0.69mi |
| 5114 Y Bar Smt Converse, TX | 3.0 | 2.0 | 1276 | $1,525 | $1.20 | 6d | 1 | 0.74mi |
| 5114 Y Bar Smt Converse, TX | 3.0 | 2.0 | 1276 | $1,525 | $1.20 | 0d | 1 | 0.74mi |
| 4326 Stanley Park Converse, TX | 3.0 | 2.0 | 1484 | $1,650 | $1.11 | 3d | 1 | 0.74mi |
| 9204 Canyon Bnd Unit 2 Converse, TX | 3.0 | 2.5 | 1372 | $1,495 | $1.09 | 45d | 1 | 0.76mi |
| 9213 Groff Lndg Converse, TX | 3.0 | 2.0 | 1344 | $1,600 | $1.19 | 13d | 1 | 0.78mi |
| 8911 Sumners Wise Converse, TX | 4.0 | 2.0 | 1627 | $1,745 | $1.07 | 4d | 1 | 0.79mi |
| 9211 Griffith Run Converse, TX | 3.0 | 2.0 | 1266 | $1,446 | $1.14 | 6d | 1 | 0.79mi |
| 9115 Griffith Run Converse, TX | 3.0 | 2.0 | 1266 | $1,521 | $1.20 | 45d | 1 | 0.84mi |
| 8810 Barrow Path Converse, TX | 4.0 | 2.0 | 1667 | $1,695 | $1.02 | 22d | 1 | 0.84mi |
| 8803 Barrow Path Converse, TX | 3.0 | 2.0 | 1440 | $1,570 | $1.09 | 25d | 1 | 0.86mi |
| 3035 Selhurst St Converse, TX | 3.0 | 2.0 | 1557 | $1,800 | $1.16 | 25d | 1 | 0.88mi |
| 5223 Hornbeck Hts Converse, TX | 3.0 | 2.0 | 1440 | $1,795 | $1.25 | 45d | 1 | 0.88mi |
| 5107 Hornbeck Hts Converse, TX | 3.0 | 2.0 | 1266 | $1,436 | $1.13 | 0d | 1 | 0.89mi |
| 9026 Bowring Park Converse, TX | 3.0 | 2.0 | 1721 | $1,795 | $1.04 | 45d | 1 | 0.90mi |
| 5170 Fowler Crst Converse, TX | 3.0 | 2.0 | 1450 | $1,695 | $1.17 | 6d | 1 | 0.91mi |
| 5135 Fowler Crst Converse, TX | 3.0 | 2.0 | 1266 | $1,900 | $1.50 | 0d | 1 | 0.94mi |
| 10310 Waverunner Converse, TX | 3.0 | 2.0 | 1474 | $1,695 | $1.15 | 5d | 1 | 0.95mi |
| 8902 Grand Western Converse, TX | 3.0 | 2.5 | 1570 | $1,995 | $1.27 | 45d | 1 | 0.98mi |
| 10410 Waverunner Converse, TX | 3.0 | 2.0 | 1458 | $1,750 | $1.20 | 25d | 1 | 0.99mi |
| 9110 Longhorn Park Converse, TX | 3.0 | 2.0 | 1646 | $1,675 | $1.02 | 18d | 1 | 1.01mi |
| 9110 Longhorn Park Converse, TX | 3.0 | 2.0 | 1646 | $1,675 | $1.02 | 14d | 1 | 1.01mi |
| 9310 Nubuck Br Converse, TX | 3.0 | 2.0 | 1525 | $1,895 | $1.24 | 6d | 1 | 1.07mi |
| 6426 Thorpe Holw Converse, TX | 3.0 | 2.5 | 1414 | $1,600 | $1.13 | 25d | 1 | 1.08mi |
| 5950 Frisbee Path Converse, TX | 4.0 | 2.0 | 1667 | $1,700 | $1.02 | 45d | 1 | 1.12mi |
| 4351 W Vasquez Cir Converse, TX | 3.0 | 2.0 | 1652 | $1,850 | $1.12 | 21d | 1 | 1.14mi |
| 10403 Midsummer Mdw Converse, TX | 4.0 | 2.0 | 1699 | $1,775 | $1.04 | 25d | 1 | 1.17mi |
| 4398 W Vasquez Cir Unit 710 Converse, TX | 2.0 | 2.0 | 1060 | $1,380 | $1.30 | 0d | 1 | 1.19mi |
| 9219 Bennett Frst Converse, TX | 3.0 | 2.0 | 1526 | $1,900 | $1.25 | 45d | 1 | 1.20mi |
HOA detail
- Monthly dues
- $42 · $504/yr
Listing history 10 events
-
2026-06-13statusdays on market $188,999 Pending 23 DOM
-
2026-06-09days on market $188,999 Price Change 22 DOM
-
2026-06-08days on market $188,999 Price Change 21 DOM
-
2026-06-07days on market $188,999 Price Change 20 DOM
-
2026-06-04days on market $188,999 Price Change 17 DOM
-
2026-06-03days on market $188,999 Price Change 16 DOM
-
2026-06-02pricedays on market $188,999 Price Change 15 DOM
-
2026-06-01days on market $189,999 Price Change 14 DOM
-
2026-05-31days on market $189,999 Price Change 13 DOM
-
2026-05-18$208,999 New
ⓘ Source: listings_history table (triggers on properties + properties_extension) + one-shot
backfill from property_details.listing_events for pre-trigger history.
Nearby sold comps map
Loading sold comps map…
Walkable amenities ~0.75 mi
Loading nearby amenities…
Taxation est. · year 1
- Rental income
- $20,634
- − Mortgage interest
- −$10,587
- − Property taxes
- −$2,835
- − Insurance
- −$945
- − Repairs & maintenance
- −$1,651
- − Management
- −$1,651
- − HOA
- −$504
- − Depreciation
- −$5,498
- Taxable loss
- −$3,037
- Est. tax savings @ 24.0%
- +$729
- After-tax cash flow
- $852/yr
For passive investors: Depreciation is non-cash, so a rental often shows a tax loss while cash-flowing — sheltering income. Rental losses are passive: they offset passive income freely, and up to $25,000/yr can offset ordinary (W-2) income if you actively participate and your MAGI is under $100k (phasing out to $0 by $150k); unused losses carry forward. On sale, claimed depreciation is recaptured at up to 25%, and gains may owe capital-gains tax (a 1031 exchange can defer both). Figures are a year-1 estimate at your 24.0% rate — not tax advice; consult a CPA.
Condition & rehab AI · 6 photos
This new single-story home is move-in ready with a modern layout and stylish design, featuring a kitchen, bathrooms, and other amenities.
Schools (NCES district)
- District
- East Central ISD
- NCES district ID
- 4817850
- Math proficiency
- 16% ▼ -12.00%
- Reading proficiency
- 25% ▼ -6.00%
- Median HH income
- $53,941
- Composite
- 18.67/100
- National rank
- #8887
- State rank
- #758 of 826 in TX
Livability — San Antonio
- Score
- 80/100
- State rank
- #31
- US rank
- #1616
Category grades
Schools grade is shown separately in the Schools card above.
Census & demographics
- Census place
- San Antonio, TX
- County
- Bexar County · 1,990,555 people
- City population
- 1,806,925
- Metro
- San Antonio-New Braunfels, TX
- Population (ZIP)
- 63,067
- Household income
- $91,320
- Rent vs Own
- Severe rent burden
- 1732.0
Population outlook (Bexar County) Hauer SSP2
- Today (2025)
- 2,336,851 people
- By 2030
- 2,560,728 · +9.6%
- By 2040
- 3,020,569 · +29.3%
- By 2050
- 3,493,522 · +49.5%
- By 2075
- 4,668,459 · +99.8%
- By 2100
- 5,533,242 · +136.8%
Race, ethnicity, and origin ACS 2023
- Neighborhood character
- Diverse neighborhood (Simpson 0.69)
- Race & ethnicity
- Hispanic / Latino 44% White 27% Two or more races 21% Black 21% Asian 3%
- Hispanic origin (detail)
- Mexican 29% Puerto Rican 4%
- Common ancestry
- Lithuanian 1% Romanian 1% Italian 1%
- Foreign-born
- 11% · Canada, Vietnam, South Korea
- Languages at home
- 71% English-only · Spanish 23% Tagalog/Filipino 1% Other Asian/Pacific 1%
Political lean MEDSL · Bexar
- 2024 margin
- Lean D (+9.8) · D 54.3% · R 44.6% · Other 1.1%
- 2008→2024 swing
- +4.2pp toward D · 2008: 5.6pp · 2024: 9.8pp
- All cycles
- 2024: D+9.8 2020: D+18.2 2016: D+13.5 2012: D+4.6 2008: D+5.6
Not yet ingested
- Civics
- —
Market trends
- HPI YoY
- ▼ -51.02%
- Current HPI
- 236.4923
- Rent YoY
- ▼ -1.08%
- Metro
- San Antonio-New Braunfels, TX
- State GDP YoY
- ▲ 3.95%
- F500 in state
- 110
Industry mix (Fortune 500 HQ in TX)
| Industry | F500 HQs | Revenue |
|---|---|---|
| Energy | 16 | $1,198B |
|
||
| Technology | 5 | $198B |
|
||
| Engineering / Construction | 4 | $72B |
|
||
| Energy Services | 3 | $60B |
|
||
| Utilities | 3 | $41B |
|
||
| Healthcare | 2 | $330B |
|
||
Price history
1 event — show timeline
- 2026-05-18 Listed $208,999 LERA
Cash-flow waterfall
monthlySold comps — $/sqft
last 12 mo · ≤1 miLoading sold comps…