67 Periwinkle Dr · Rochester, NH
Flood risk No data
- FEMA flood zone
- —
- Chance of flooding over 30 yrs
- —
- Est. flood insurance / yr
- —
Fire risk No data
- Est. fire insurance / yr
- —
Heat risk No data
- Hot days now (above threshold)
- —
- Hot days in 30 yrs
- —
Wind risk No data
- Chance of severe wind over 30 yrs
- —
Air-quality risk No data
- Unhealthy air days now
- —
- Unhealthy air days in 30 yrs
- —
Risk factors via First Street. Map © Google.
Why this score? — see what drove the B- grade
The composite is a weighted blend of 9 inputs, each scored 0–100. Each bar is that input's sub-score; the figure is the points it added to the 100-point composite (weight × sub-score).
- Cash flow +30.0/30.0
- 1% rule +10.0/10.0
- DSCR +10.0/10.0
- ARV discount +7.5/15.0
- Livability +4.2/5.0
- Schools +2.7/10.0
- Rent growth +2.5/5.0
- Condition / age +2.5/5.0
- Appreciation +0.0/10.0
$59,900
🖨 Deal sheet (PDF) 📄 Offer letter ✓ Due diligence
Listing remarks MLS
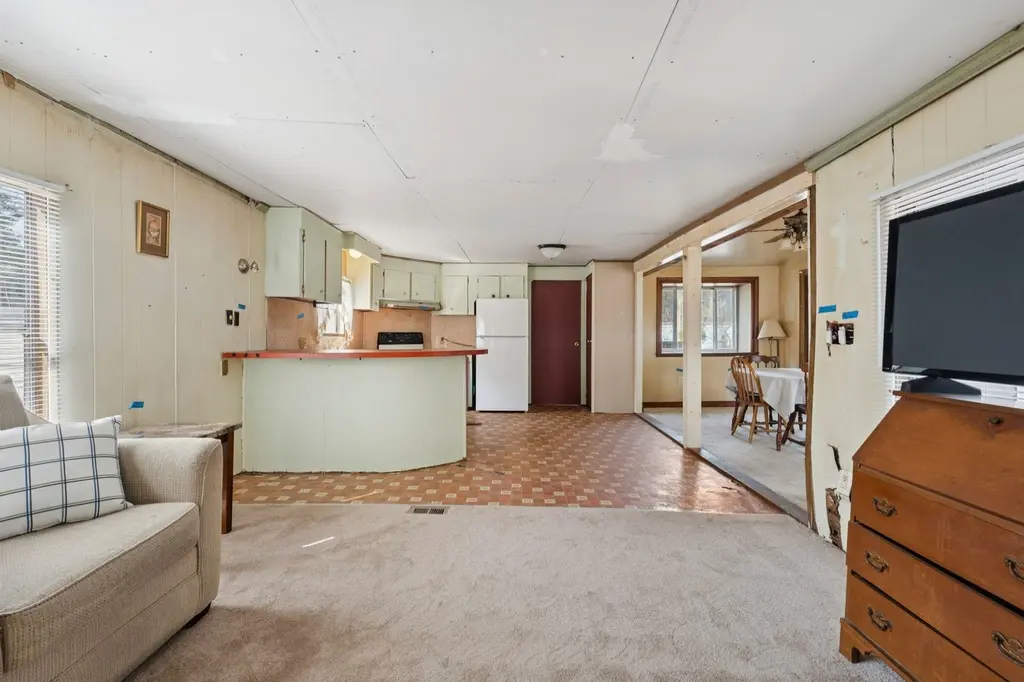
HARD TO FIND 3 BEDROOM MOBILE, NEW FURNACE, UPDATED PLUMBING, ELECTRIC, FLOORING, FULLY APPLIANCED, BEAUTIFUL ADDITION, NICELY LANDSCAPED LOT. SORRY, NO DOGS ALLOWED.
Key facts
- Recent upgrades
- New water heater
- New roof
Tags
Property features AI
Finance
- HOA & community: Monthly fee of 530 (includes park rent); Park approval indicates property is approved for the mobile home park
Exterior
- Parking: Paved driveway
- Utilities: Public water; Public sewer; Circuit breaker electrical panel; High-speed internet available; Cable available
- Home design: Manufactured home (mobile); Aluminum siding; Membrane roof; Built in 1977
- Construction: Manufactured structure; Aluminum siding; Membrane roof; Year built 1977
- Exterior features: Leased lot; Paved driveway
Interior
- Kitchen: Refrigerator included
- Bedrooms: Three bedrooms (all on main level)
- Flooring: Carpet; Vinyl
- Bathrooms: One full bathroom
- Heating & cooling: Forced air heating
- Interior features: Five total rooms; Open kitchen/living area; Living/dining space
- Laundry & utility: Washer and dryer included
Neighborhood map
What this means for you Summary
Snapshot
- This is a 3-bed/1.0-bath manufactured listed at $60k.
Deal economics
- At list price, monthly cash flow is $700 ($8k/yr) — positive.
- The deal already cash-flows at list — no discount required.
- Meets the 1% rule at list price ($2k rent vs $60k).
- Recommended offer: $58k (3.0% below list) — sets the bar for market timing.
- Cap rate 20.3% vs local median 3.3% in Rochester — top-decile yield for the area; either an underpriced asset or a hidden risk that comps aren't pricing in. Stress-test before assuming the spread holds.
Location & tenants
- Location reads 84/100 on livability (#8 in NH, #698 nationally) — a professional / high-income tenant draw. Strengths: crime A+, commute A+, cost of living A+; Watch: amenities C-.
- Rochester School District (suburban): math 27% / reading 35% proficiency, ranked #83 of 98 in NH (top 85%) — families likely to look elsewhere, expect single-tenant / working-renter base with shorter leases.
- Zoned schools: East Rochester School (math 37% / reading 42%, grade F, #164 of 263 statewide, top 64%, 293 students, 38% FRL); Rochester Middle School (math 18% / reading 27%, grade F, #85 of 96 statewide, top 89%, 847 students, 37% FRL); Spaulding High School (math 30% / reading 49%, grade F, #63 of 90 statewide, top 74%, 1,301 students, 32% FRL) — zoned schools at 36% FRL track the district average.
- Market conditions: 34 active listings in the ZIP; 951 units permitted in Strafford County in 2024 (551 in 5+ unit buildings).
Forward outlook
- Local home prices are declining (-3.0%/yr); year-one equity from $414 of loan paydown is wiped out by about $2k of value loss. Plan a longer hold.
- Strafford County population projected at +7% by 2050 — modest demand growth; plan on rents tracking national, not racing it.
- At projected returns (-3.0% appreciation + 3.0% rent growth), your $17k cash investment doubles in ~3 years — after that, you're playing with house money.
Negotiation context
- It's been on market 33 days — a 3% lower offer ($58k) is reasonable based on typical stale-listing flexibility.
- 2 sale attempts since 20y ago with the ask held roughly flat each time — persistent listings suggest the price (not the market) is what's stuck; bring a comps-based counter.
- Current owner paid $40k; 50% above their basis — modest negotiation headroom, anchor on the comps not their cost.
Risks & watch-outs
- Watch-outs: HOA is 25% of rent.
Questions for the listing agent
- It's been on market 33 days. Have you received any prior offers? Is the seller open to a 3% concession, seller financing, or rate buy-down credit?
- Built in 1977 — when were the roof, HVAC, electrical panel, plumbing, and water heater last replaced?
- What does the HOA fee cover, when was the last increase, and are there any pending special assessments or reserve-fund shortfalls?
- Is there a deadline driving the sale (1031 exchange, divorce, estate, relocation)? That informs how much negotiation room exists.
- What's the average days-on-market for RENTAL listings here right now (not sales)? A rising rental-DOM trend means longer vacancies and softer asking-rent achievability than the comps imply.
- What's the recent tenant-quality profile in this submarket — average credit score on applications, eviction rate, late-payment / NSF rate, and stable-employment percentage? A property-management company in the area should have these aggregated.
- How much new for-sale + rental construction is in the pipeline within 1–3 miles? Heavy new supply typically softens prices + rents 12–24 months out; constrained supply supports both.
Investment metrics
- 1% rule
- 3.51% ✓
- Cap rate
- 20.32%
- Cash-on-cash
- 50.10%
- DSCR
- 3.23
- GRM
- 2.4
CMA / ARV
- ARV (median comp)
- $179,686
- List price
- $59,900
- Delta
- -66.66%
- Verdict
- UNDERPRICED
- Comps
- 10 within 1.0 mi
Show comp detail 3 sales within ~0.75 mi
| Address | Dist | Beds/Ba | Sqft | Sold | Price | $/sf | Match |
|---|---|---|---|---|---|---|---|
| 67 Periwinkle Dr | 0.00mi | 3/1.0 | 1,114 (0%) | 0mo | $40,000 | $36 | 100 |
| 7 Gina Dr | 0.52mi | 3/2.0 | 1,040 (-7%) | 10mo | $250,000 | $240 | 53 |
| 3 Pineknoll Dr | 0.65mi | 2/2.0 (-1) | 1,116 (+0%) | 12mo | $265,000 | $237 | 50 |
Match score weights: distance 35% · size 25% · config 20% · recency 20%. Top-matched comps best support the ARV.
Projected returns pro-forma
-3.0% appreciation · 3.0% rent growth · sell at horizon
- IRR
- 48.1%
- Equity multiple
- 3.10×
- Total profit
- $35,259
- Equity at exit
- $8,931
- IRR
- 53.8%
- Equity multiple
- 6.34×
- Total profit
- $89,620
- Equity at exit
- $5,179
Cash invested: $16,772 (down + closing). Projections, not guarantees.
Landlord ↔ Tenant lean methodology
- Overall (STATE)
- 56 Moderately Landlord-Leaning
- State New Hampshire
- 56 Moderately Landlord-Leaning · D+1
- County
- — inherits STATE
- City
- — inherits STATE
ZIP-level market 03868
- Home prices YoY
- -6.6%
- Active inventory
- 34
- Price-to-rent
- 2.4×
Monthly cashflow live
- Estimated rent
- $2,100 medium interval (Pro) →
- Mortgage (P&I)
- −$314
- Tax from tax record
- −$89 /mo · $1,073/yr
- Insurance
- −$25
- HOA
- −$530
- Vacancy / Maint / Mgmt
- −$441
- Net cashflow
- $700
Break-even live
Sensitivity live
| Price | -10% $734 | -5% $717 | +0% $700 | +5% $683 | +10% $666 |
|---|---|---|---|---|---|
| Rent | -10% $534 | -5% $617 | +0% $700 | +5% $783 | +10% $866 |
| Rate | -1.0pp $730 | -0.5pp $715 | base $700 | +0.5pp $685 | +1.0pp $669 |
UW: 25.0% down · 7.5% · 30yr · 1.5% tax · 5.0% vac · 8.0% maint · 8.0% mgmt
Financing live
Cash to close
- Down payment
- $14,975
- Closing costs
- $1,797
- Reserves months
- —
- Total cash needed
- —
Loan-product check · same deal, 3 products live
Conventional
25% down · 7.5% · 30yr
- Down + closing
- —
- Monthly P&I
- —
- Monthly cashflow
- —
- DSCR
- —
- Eligible?
- —
Personal DTI + credit; lowest rate.
DSCR
20% down · 8.5% · 30yr
- Down + closing
- —
- Monthly P&I
- —
- Monthly cashflow
- —
- DSCR
- —
- Eligible?
- —
No personal income docs; deal must DSCR.
Hard money
10% down · 12.0% · 12mo
- Down + closing
- —
- Monthly P&I
- —
- Monthly cashflow
- —
- DSCR
- —
- Eligible?
- —
Short-term bridge; refi at stabilization.
HOA detail
- Monthly dues
- $530 · $6,360/yr
- Likely covers
- electric
Listing history 5 events
-
2026-04-24$59,900 Active 762-char remark
-
2006-04-07soldstatus $27,500 166-char remark
Show marketing remark (166 chars)
HARD TO FIND 3 BEDROOM MOBILE, NEW FURNACE, UPDATED PLUMBING, ELECTRIC, FLOORING, FULLY APPLIANCED, BEAUTIFUL ADDITION, NICELY LANDSCAPED LOT. SORRY, NO DOGS ALLOWED.
-
2006-04-07soldstatus $27,533
Show marketing remark (166 chars)
HARD TO FIND 3 BEDROOM MOBILE, NEW FURNACE, UPDATED PLUMBING, ELECTRIC, FLOORING, FULLY APPLIANCED, BEAUTIFUL ADDITION, NICELY LANDSCAPED LOT. SORRY, NO DOGS ALLOWED.
-
2006-03-31historical 166-char remark
Show marketing remark (166 chars)
HARD TO FIND 3 BEDROOM MOBILE, NEW FURNACE, UPDATED PLUMBING, ELECTRIC, FLOORING, FULLY APPLIANCED, BEAUTIFUL ADDITION, NICELY LANDSCAPED LOT. SORRY, NO DOGS ALLOWED.
-
2006-03-20$29,000 166-char remark
Show marketing remark (166 chars)
HARD TO FIND 3 BEDROOM MOBILE, NEW FURNACE, UPDATED PLUMBING, ELECTRIC, FLOORING, FULLY APPLIANCED, BEAUTIFUL ADDITION, NICELY LANDSCAPED LOT. SORRY, NO DOGS ALLOWED.
ⓘ Source: listings_history table (triggers on properties + properties_extension) + one-shot
backfill from property_details.listing_events for pre-trigger history.
Tax reassessment forecast NH · Partial reset (capped growth)
- Current annual tax
- $1,073 · $89/mo
- Projected year-2 tax
- $1,189 · $99/mo
- Expected delta
- +$116/yr (+$10/mo · 10.8%)
ⓘ Screening estimate from a state-policy table — verify with the county assessor before closing.
Nearby sold comps map
Loading sold comps map…
Walkable amenities ~0.75 mi
Loading nearby amenities…
Taxation est. · year 1
- Rental income
- $25,196
- − Mortgage interest
- −$3,355
- − Property taxes
- −$1,073
- − Insurance
- −$300
- − Repairs & maintenance
- −$2,016
- − Management
- −$2,016
- − HOA
- −$6,360
- − Depreciation
- −$1,743
- Taxable income
- $8,334
- Est. tax owed @ 24.0%
- −$2,000
- After-tax cash flow
- $6,403/yr
For passive investors: Depreciation is non-cash, so a rental often shows a tax loss while cash-flowing — sheltering income. Rental losses are passive: they offset passive income freely, and up to $25,000/yr can offset ordinary (W-2) income if you actively participate and your MAGI is under $100k (phasing out to $0 by $150k); unused losses carry forward. On sale, claimed depreciation is recaptured at up to 25%, and gains may owe capital-gains tax (a 1031 exchange can defer both). Figures are a year-1 estimate at your 24.0% rate — not tax advice; consult a CPA.
Schools (NCES district)
- District
- Rochester School District
- NCES district ID
- 3305940
- Math proficiency
- 27% ▼ -15.00%
- Reading proficiency
- 35% ▼ -14.00%
- Median HH income
- $51,080
- Composite
- 27.11/100
- National rank
- #7039
- State rank
- #83 of 98 in NH
Livability — Rochester
- Score
- 84/100
- State rank
- #8
- US rank
- #698
Category grades
Schools grade is shown separately in the Schools card above.
Census & demographics
- Census place
- Rochester, NH
- City population
- 22,732
- Population (ZIP)
- 5,830
Population outlook (Strafford County) Hauer SSP2
- Today (2025)
- 132,503 people
- By 2030
- 135,377 · +2.2%
- By 2040
- 139,609 · +5.4%
- By 2050
- 141,803 · +7.0%
- By 2075
- 149,280 · +12.7%
- By 2100
- 148,667 · +12.2%
Race, ethnicity, and origin ACS 2023
- Neighborhood character
- Predominantly White (91%)
- Race & ethnicity
- White 91% Two or more races 4% Asian 4% Black 1%
- Common ancestry
- Lithuanian 10% Serbian 3% Portuguese 2%
- Foreign-born
- 4% · Canada, Jamaica
- Languages at home
- 94% English-only · Other Asian/Pacific 2% Other Indo-European 2% Spanish 1%
Political lean MEDSL · Strafford
- 2024 margin
- D (+12.1) · D 55.5% · R 43.5% · Other 1.0%
- 2008→2024 swing
- -8.3pp toward R · 2008: 20.4pp · 2024: 12.1pp
- All cycles
- 2024: D+12.1 2020: D+15.2 2016: D+8.6 2012: D+14.5 2008: D+20.4
Not yet ingested
- Civics
- —
Market trends
- HPI YoY
- ▼ -29.24%
- Current HPI
- 411.2075
- Rent YoY
- —
- Metro
- —
- State GDP YoY
- —
- F500 in state
- 0
Price history
+37.9% since first listed7 events — show timeline
- 2026-06-16 Sold (MLS) $40,000 PrimeMLS
- 2026-05-27 Pending — PrimeMLS
- 2026-04-24 Listed $59,900 PrimeMLS
- 2006-04-07 Sold (Public Records) $27,533 Public Records
- 2006-04-07 Sold (MLS) $27,500 PrimeMLS
- 2006-03-31 Delisted — PrimeMLS
- 2006-03-20 Listed $29,000 PrimeMLS
Property tax history
+11.4%/yrLatest (2025): $1,073 · +3.1% YoY. Source: county tax records.
Cash-flow waterfall
monthlySold comps — $/sqft
last 12 mo · ≤1 miLoading sold comps…