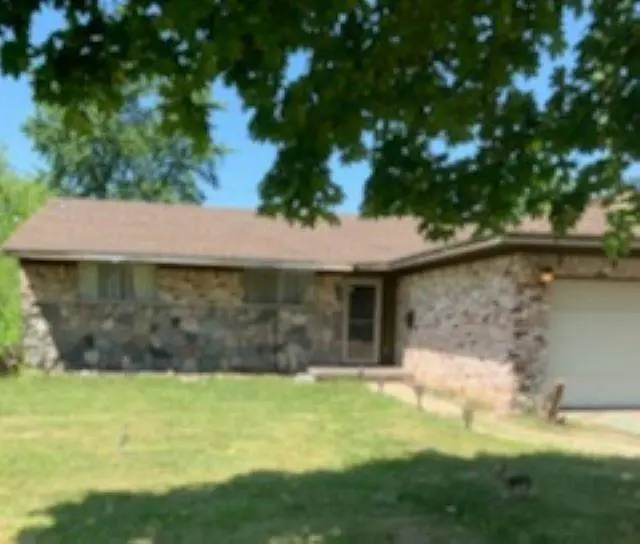
5447 Mendel Berger Dr · Beecher, MI
Flood risk 1/10 · Minimal
- FEMA flood zone
- X (unshaded)
- Chance of flooding over 30 yrs
- 0.0%
- Est. flood insurance / yr
- $473 – $860
Fire risk 1/10 · Minimal
- Est. fire insurance / yr
- $784 – $1,456
Heat risk 2/10 · Minimal
- Hot days now (above 97°F)
- 7 days/yr
- Hot days in 30 yrs
- 14 days/yr
Wind risk 2/10 · Minimal
- Chance of severe wind over 30 yrs
- —
Air-quality risk 2/10 · Minimal
- Unhealthy air days now
- 1 days/yr
- Unhealthy air days in 30 yrs
- 3 days/yr
Risk factors via First Street. Map © Google.
Why this score? — see what drove the D grade
The composite is a weighted blend of 9 inputs, each scored 0–100. Each bar is that input's sub-score; the figure is the points it added to the 100-point composite (weight × sub-score).
- Cash flow +16.9/30.0
- Appreciation +6.3/10.0
- 1% rule +5.5/10.0
- DSCR +5.3/10.0
- Livability +3.0/5.0
- Rent growth +2.5/5.0
- Condition / age +2.5/5.0
- Schools +1.0/10.0
- ARV discount +0.8/15.0
$100,000
🖨 Deal sheet (PDF) 📄 Offer letter ✓ Due diligence
Listing remarks MLS
Newly remodeled 3 bedroom 1 full 2 1/2 bathrooms. Hard wood floors throughout upstairs area, upgraded kitchen amenities, bathrooms on 1st level remodeled as well. Nice sized fenced in back yard, great for entertaining. Basement has good lounge area space with a built in bar and 1 1/2 bath. 2 car attached garage. Perfect family home that just needs the finishing touches of a new home owner!
Key facts
- 6,534 sq ft lot
- 2 garage spots
- Built 1965
Neighborhood map
What this means for you Summary
Snapshot
- This is a 3-bed/2.0-bath single-family listed at $100k.
Deal economics
- At list price, monthly cash flow is $66 ($788/yr) — positive.
- The deal already cash-flows at list — no discount required.
- Meets the 1% rule at list price ($1k rent vs $100k).
- Recommended offer: $91k (9.0% below list) — sets the bar for market timing.
Location & tenants
- Location reads 59/100 on livability (#603 in MI) — a working-class tenant base; expect higher turnover. Strengths: cost of living A+, housing A-; Watch: schools C-, crime F, amenities F.
- Beecher Community School District (suburban): math 7% / reading 10% proficiency, ranked #722 of 760 in MI (top 95%) — low school quality limits family demand, transient renter base, plan for 1-2y turnover; 90% free/reduced lunch — lower-income household profile, screen leases tightly.
- Market conditions: 99 active listings in the ZIP; 10 comparable units currently listed for rent nearby; rentals at typical pace (median 14d on market — plan ~3-4 weeks tenant-placement turnaround); lower-income renter base — watch delinquency; 419 units permitted in Genesee County in 2024 (68 in 5+ unit buildings).
- This rent runs 38% of the median local income ($33k/yr) — at the standard rent-burdened threshold; future hikes will face affordability resistance.
Forward outlook
- In year one you build about $3k of equity ($691 loan paydown + $3k appreciation (2.7% local appreciation)).
- Genesee County population projected at -27% by 2050 — secular population decline; favor cash flow + early exit over multi-decade hold.
- At projected returns (2.7% appreciation + 3.0% rent growth), your $28k cash investment doubles in ~6 years — after that, you're playing with house money.
- By year 10, paydown + projected appreciation supports a ~$33k cash-out refi (75% LTV) — recoverable capital for the next deal without selling this one.
Negotiation context
- It's been on market 91 days — a 9% lower offer ($91k) is reasonable based on typical stale-listing flexibility.
- 6 sale attempts since 24y ago with the ask held roughly flat each time — persistent listings suggest the price (not the market) is what's stuck; bring a comps-based counter.
- Current owner paid $85k; 18% above their basis — modest negotiation headroom, anchor on the comps not their cost.
Questions for the listing agent
- It's been on market 91 days. Have you received any prior offers? Is the seller open to a 9% concession, seller financing, or rate buy-down credit?
- Built in 1965 — when were the roof, HVAC, electrical panel, plumbing, and water heater last replaced?
- Why hasn't it sold? Are there any deal-killer items the seller is aware of (foundation, flood, title, zoning, code violations)?
- Is there a deadline driving the sale (1031 exchange, divorce, estate, relocation)? That informs how much negotiation room exists.
- Crime grade is F in this area — have there been break-ins, vandalism, or insurance claims at this property in the last 3 years? What carrier currently insures it and at what premium?
- The area grade is low — what's the realistic commute time and amenity access for the typical tenant pool here? Any planned neighborhood developments (good or bad) we should know about?
- What's the average days-on-market for RENTAL listings here right now (not sales)? A rising rental-DOM trend means longer vacancies and softer asking-rent achievability than the comps imply.
- What's the recent tenant-quality profile in this submarket — average credit score on applications, eviction rate, late-payment / NSF rate, and stable-employment percentage? A property-management company in the area should have these aggregated.
- How much new for-sale + rental construction is in the pipeline within 1–3 miles? Heavy new supply typically softens prices + rents 12–24 months out; constrained supply supports both.
Investment metrics
- 1% rule
- 1.05% ✓
- Cap rate
- 7.08%
- Cash-on-cash
- 2.81%
- DSCR
- 1.13
- GRM
- 7.9
CMA / ARV
- ARV (on-the-fly)
- $87,048
- Comps found
- 10
Show comp detail 10 sales within ~0.75 mi
| Address | Dist | Beds/Ba | Sqft | Sold | Price | $/sf | Match |
|---|---|---|---|---|---|---|---|
| 2210 O'brien Rd | 0.31mi | 3/2.0 | 1,450 (+3%) | 4mo | $94,900 | $65 | 77 |
| 2187 Armstrong Rd | 0.24mi | 3/2.0 | 1,468 (+5%) | 15mo | $87,500 | $60 | 69 |
| 2267 Douglas Joel Dr | 0.11mi | 3/1.0 | 1,296 (-8%) | 16mo | $67,500 | $52 | 65 |
| 2161 Flamingo Dr | 0.66mi | 3/1.0 | 1,416 (+1%) | 13mo | $87,500 | $62 | 53 |
| 6126 Titan Rd | 0.58mi | 3/2.0 | 1,243 (-12%) | 2mo | $125,000 | $101 | 52 |
| 6094 Penwood Rd | 0.67mi | 4/1.0 (+1) | 1,480 (+5%) | 3mo | $122,000 | $82 | 49 |
| 1432 Charwood Rd | 0.67mi | 2/1.5 (-1) | 1,353 (-4%) | 11mo | $45,000 | $33 | 46 |
| 6121 Eldon Rd | 0.63mi | 2/1.5 (-1) | 1,340 (-5%) | 12mo | $81,620 | $61 | 46 |
| 1422 W Coldwater Rd | 0.67mi | 3/1.0 | 1,299 (-8%) | 22mo | $46,000 | $35 | 34 |
| 2439 W Coldwater Rd | 0.44mi | 2/1.0 (-1) | 1,194 (-15%) | 15mo | $90,000 | $75 | 33 |
Match score weights: distance 35% · size 25% · config 20% · recency 20%. Top-matched comps best support the ARV.
Projected returns pro-forma
2.67% appreciation · 3.0% rent growth · sell at horizon
- IRR
- 9.3%
- Equity multiple
- 1.52×
- Total profit
- $14,576
- Equity at exit
- $43,141
- IRR
- 11.9%
- Equity multiple
- 2.72×
- Total profit
- $48,289
- Equity at exit
- $65,101
Cash invested: $28,000 (down + closing). Projections, not guarantees.
Landlord ↔ Tenant lean methodology
- Overall (STATE)
- 62 Landlord-Friendly
- State Michigan
- 62 Landlord-Friendly · EVEN
- County
- — inherits STATE
- City
- — inherits STATE
ZIP-level market 48505
- Home prices YoY
- 1.3%
- Active inventory
- 99
- Price-to-rent
- 7.9×
Monthly cashflow live
- Estimated rent
- $1,052 high interval (Pro) →
- Mortgage (P&I)
- −$524
- Tax from tax record
- −$200 /mo · $2,396/yr
- Insurance
- −$42
- HOA
- −$0
- Vacancy / Maint / Mgmt
- −$221
- Net cashflow
- $66
Break-even live
Sensitivity live
| Price | -10% $122 | -5% $94 | +0% $66 | +5% $37 | +10% $9 |
|---|---|---|---|---|---|
| Rent | -10% $-17 | -5% $24 | +0% $66 | +5% $107 | +10% $149 |
| Rate | -1.0pp $116 | -0.5pp $91 | base $66 | +0.5pp $40 | +1.0pp $13 |
UW: 25.0% down · 7.5% · 30yr · 1.5% tax · 5.0% vac · 8.0% maint · 8.0% mgmt
Financing live
Cash to close
- Down payment
- $25,000
- Closing costs
- $3,000
- Reserves months
- —
- Total cash needed
- —
Loan-product check · same deal, 3 products live
Conventional
25% down · 7.5% · 30yr
- Down + closing
- —
- Monthly P&I
- —
- Monthly cashflow
- —
- DSCR
- —
- Eligible?
- —
Personal DTI + credit; lowest rate.
DSCR
20% down · 8.5% · 30yr
- Down + closing
- —
- Monthly P&I
- —
- Monthly cashflow
- —
- DSCR
- —
- Eligible?
- —
No personal income docs; deal must DSCR.
Hard money
10% down · 12.0% · 12mo
- Down + closing
- —
- Monthly P&I
- —
- Monthly cashflow
- —
- DSCR
- —
- Eligible?
- —
Short-term bridge; refi at stabilization.
Rent comps 10 comps
| Address | Beds | Baths | Sqft | Rent | $/sqft | DOM | Units | Dist |
|---|---|---|---|---|---|---|---|---|
| 2216 Obrien Rd Mount Morris, MI | 3.0 | 2.0 | 1080 | $1,000 | $0.93 | 14d | 1 | 0.32mi |
| 5280 Cedar Shores Ct Flint, MI | 2.0–3.0 | 2.0 | 1150 | $1,148 | $1.00 | 14d | 6 | 0.53mi |
| 6113 Natchez Dr Mount Morris, MI | 3.0 | 1.0 | 1100 | $990 | $0.90 | 44d | 1 | 0.84mi |
| 6230 Natchez Dr Mount Morris, MI | 3.0 | 1.0 | 1060 | $1,000 | $0.94 | 14d | 1 | 0.99mi |
| 6802 DuPont St Flint, MI | 3.0 | 1.0 | 1200 | $1,000 | $0.83 | 21d | 1 | 1.04mi |
| 514 W Alma Ave Flint, MI | 3.0 | 1.0 | 894 | $925 | $1.03 | 14d | 1 | 1.11mi |
| 1 Sunny Ln Mount Morris, MI | 3.0 | 2.0 | 1100 | $1,100 | $1.00 | 44d | 1 | 1.36mi |
| 5905 Griggs Dr Flint, MI | 3.0 | 1.0 | 940 | $1,000 | $1.06 | 14d | 1 | 1.44mi |
| 5813 Edwards Ave Flint, MI | 3.0 | 1.0 | 1500 | $899 | $0.60 | 14d | 1 | 1.47mi |
| 7028 Rosewood Dr Mt Morris, MI | 2.0 | 1.0 | 967 | $1,020 | $1.05 | 14d | 1 | 1.48mi |
Listing history 17 events
-
2024-12-17status Pending
-
2023-09-07soldstatus $85,000
-
2022-10-09status Pending
Show marketing remark (392 chars)
Newly remodeled 3 bedroom 1 full 2 1/2 bathrooms. Hard wood floors throughout upstairs area, upgraded kitchen amenities, bathrooms on 1st level remodeled as well. Nice sized fenced in back yard, great for entertaining. Basement has good lounge area space with a built in bar and 1 1/2 bath. 2 car attached garage. Perfect family home that just needs the finishing touches of a new home owner!
-
2022-10-09status Pending 392-char remark
Show marketing remark (392 chars)
Newly remodeled 3 bedroom 1 full 2 1/2 bathrooms. Hard wood floors throughout upstairs area, upgraded kitchen amenities, bathrooms on 1st level remodeled as well. Nice sized fenced in back yard, great for entertaining. Basement has good lounge area space with a built in bar and 1 1/2 bath. 2 car attached garage. Perfect family home that just needs the finishing touches of a new home owner!
-
2022-07-09$100,000 Active
Show marketing remark (392 chars)
Newly remodeled 3 bedroom 1 full 2 1/2 bathrooms. Hard wood floors throughout upstairs area, upgraded kitchen amenities, bathrooms on 1st level remodeled as well. Nice sized fenced in back yard, great for entertaining. Basement has good lounge area space with a built in bar and 1 1/2 bath. 2 car attached garage. Perfect family home that just needs the finishing touches of a new home owner!
-
2022-07-09$100,000 Active 392-char remark
Show marketing remark (392 chars)
Newly remodeled 3 bedroom 1 full 2 1/2 bathrooms. Hard wood floors throughout upstairs area, upgraded kitchen amenities, bathrooms on 1st level remodeled as well. Nice sized fenced in back yard, great for entertaining. Basement has good lounge area space with a built in bar and 1 1/2 bath. 2 car attached garage. Perfect family home that just needs the finishing touches of a new home owner!
-
2013-01-03soldstatus $7,509 174-char remark
Show marketing remark (174 chars)
HUD Home. Are you tired of paying rent? This is a very nice home and at a price like this renting isn't an option! The bidding will end soon so don't delay, preview it today!
-
2013-01-03soldstatus $7,509
Show marketing remark (174 chars)
HUD Home. Are you tired of paying rent? This is a very nice home and at a price like this renting isn't an option! The bidding will end soon so don't delay, preview it today!
-
2012-12-17historical
-
2012-12-11$6,000 174-char remark
Show marketing remark (174 chars)
HUD Home. Are you tired of paying rent? This is a very nice home and at a price like this renting isn't an option! The bidding will end soon so don't delay, preview it today!
-
2012-12-11$6,000
Show marketing remark (174 chars)
HUD Home. Are you tired of paying rent? This is a very nice home and at a price like this renting isn't an option! The bidding will end soon so don't delay, preview it today!
-
2003-01-10soldstatus $79,000
-
2002-12-20soldstatus $79,000
-
2002-12-20soldstatus $79,000
-
2002-10-28historical
-
2002-04-01$84,900
-
2002-04-01$84,900
ⓘ Source: listings_history table (triggers on properties + properties_extension) + one-shot
backfill from property_details.listing_events for pre-trigger history.
Tax reassessment forecast MI · Partial reset (capped growth)
- Current annual tax
- $2,396 · $200/mo
- Projected year-2 tax
- $2,396 · $200/mo
- Expected delta
- $0/yr ($0/mo · 0.0%)
ⓘ Screening estimate from a state-policy table — verify with the county assessor before closing.
Climate risk First Street
- Flood 1/10 Low FEMA zone X (unshaded) · 0% chance over 30 yrs
- Wildfire 1/10 Low
- Heat 2/10 Low 7 d/yr ≥97°F today · 14 d/yr by 30 yrs out
- Wind 2/10 Low
- Air quality 2/10 Low 1 unhealthy d/yr today · 3 by 30 yrs out
Nearby sold comps map
Loading sold comps map…
Walkable amenities ~0.75 mi
Loading nearby amenities…
Taxation est. · year 1
- Rental income
- $12,630
- − Mortgage interest
- −$5,602
- − Property taxes
- −$2,396
- − Insurance
- −$500
- − Repairs & maintenance
- −$1,010
- − Management
- −$1,010
- − Depreciation
- −$2,909
- Taxable loss
- −$798
- Est. tax savings @ 24.0%
- +$192
- After-tax cash flow
- $980/yr
For passive investors: Depreciation is non-cash, so a rental often shows a tax loss while cash-flowing — sheltering income. Rental losses are passive: they offset passive income freely, and up to $25,000/yr can offset ordinary (W-2) income if you actively participate and your MAGI is under $100k (phasing out to $0 by $150k); unused losses carry forward. On sale, claimed depreciation is recaptured at up to 25%, and gains may owe capital-gains tax (a 1031 exchange can defer both). Figures are a year-1 estimate at your 24.0% rate — not tax advice; consult a CPA.
Schools (NCES district)
- District
- Beecher Community School District
- NCES district ID
- 2604500
- Math proficiency
- 7% ▲ 3.00%
- Reading proficiency
- 10% ▼ -2.00%
- Median HH income
- $27,719
- Composite
- 9.96/100
- National rank
- #14685
- State rank
- #722 of 760 in MI
Livability — Beecher
- Score
- 59/100
- State rank
- #603
- US rank
- #19782
Category grades
Schools grade is shown separately in the Schools card above.
Census & demographics
- Census place
- Beecher, MI
- County
- Genesee County · 221,329 people
- City population
- 93,814
- Metro
- Flint, MI
- Population (ZIP)
- 18,032
- Household income
- $33,283
- Rent vs Own
- Severe rent burden
- 960.0
Population outlook (Genesee County) Hauer SSP2
- Today (2025)
- 381,312 people
- By 2030
- 362,731 · -4.9%
- By 2040
- 321,550 · -15.7%
- By 2050
- 279,212 · -26.8%
- By 2075
- 193,336 · -49.3%
- By 2100
- 128,118 · -66.4%
Race, ethnicity, and origin ACS 2023
- Neighborhood character
- Predominantly Black (79%)
- Race & ethnicity
- Black 79% White 11% Two or more races 6% Hispanic / Latino 3%
- Common ancestry
- Romanian 1% Iranian 1% Lithuanian 1%
- Foreign-born
- 1% · Canada
- Languages at home
- 98% English-only · Spanish 1%
Political lean MEDSL · Genesee
- 2024 margin
- Toss-up / Even · D 51.4% · R 47.2% · Other 1.4%
- 2008→2024 swing
- -28.3pp toward R · 2008: 32.5pp · 2024: 4.2pp
- All cycles
- 2024: D+4.2 2020: D+9.3 2016: D+9.5 2012: D+28.2 2008: D+32.5
Not yet ingested
- Civics
- —
Market trends
- HPI YoY
- ▲ 2.67%
- Current HPI
- 202.4878
- Rent YoY
- —
- Metro
- Flint, MI
- State GDP YoY
- ▲ 1.37%
- F500 in state
- 28
Industry mix (Fortune 500 HQ in MI)
| Industry | F500 HQs | Revenue |
|---|---|---|
| Automotive Parts | 3 | $48B |
|
||
| Automotive | 2 | $372B |
|
||
| Chemicals | 1 | $45B |
|
||
| Automotive Retail | 1 | $29B |
|
||
| Healthcare / Medical Devices | 1 | $23B |
|
||
| Automotive Technology | 1 | $20B |
|
||
Price history
+0.1% since first listed17 events — show timeline
- 2024-12-17 Pending — REALCOMP
- 2023-09-07 Sold (Public Records) $85,000 Public Records
- 2022-10-09 Pending — REALCOMP
- 2022-10-09 Pending — MiRealSource-MiMLS
- 2022-07-09 Listed $100,000 MiRealSource-MiMLS
- 2022-07-09 Listed $100,000 REALCOMP
- 2013-01-03 Sold (MLS) $7,509 MiRealSource-MiMLS
- 2013-01-03 Sold (MLS) $7,509 REALCOMP
- 2012-12-17 Listing Removed — MiRealSource-MiMLS
- 2012-12-11 Listed $6,000 MiRealSource-MiMLS
- 2012-12-11 Listed $6,000 REALCOMP
- 2003-01-10 Sold (Public Records) $79,000 Public Records
- 2002-12-20 Sold (MLS) $79,000 REALCOMP
- 2002-12-20 Sold (MLS) $79,000 MiRealSource-MiMLS
- 2002-10-28 Listing Removed — MiRealSource-MiMLS
- 2002-04-01 Listed $84,900 REALCOMP
- 2002-04-01 Listed $84,900 MiRealSource-MiMLS
Property tax history
+8.0%/yrLatest (2025): $2,396 · +2.4% YoY. Source: county tax records.
Cash-flow waterfall
monthlySold comps — $/sqft
last 12 mo · ≤1 miLoading sold comps…