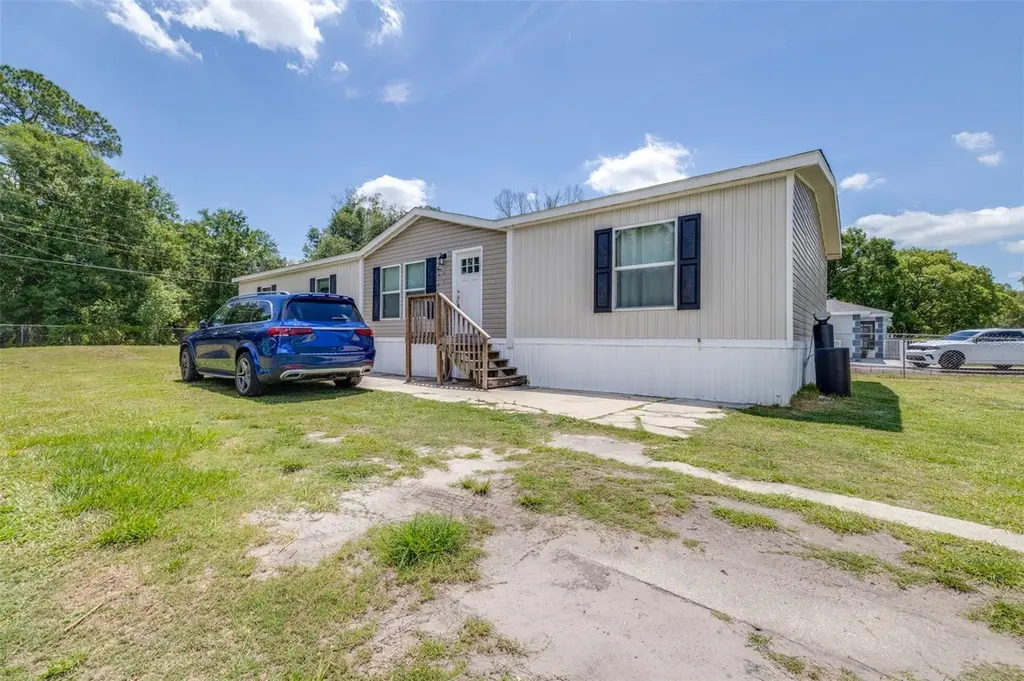
1012 Snowdown E · Lakeland, FL
Flood risk 1/10 · Minimal
- FEMA flood zone
- X (unshaded)
- Chance of flooding over 30 yrs
- 0.0%
- Est. flood insurance / yr
- $507 – $1,088
Fire risk 3/10 · Minor
- Est. fire insurance / yr
- $947 – $1,759
Heat risk 8/10 · Major
- Hot days now (above 108°F)
- 7 days/yr
- Hot days in 30 yrs
- 24 days/yr
Wind risk 10/10 · Severe
- Chance of severe wind over 30 yrs
- 99.0%
Air-quality risk 2/10 · Minimal
- Unhealthy air days now
- 1 days/yr
- Unhealthy air days in 30 yrs
- 2 days/yr
Risk factors via First Street. Map © Google.
Why this score? — see what drove the C grade
The composite is a weighted blend of 9 inputs, each scored 0–100. Each bar is that input's sub-score; the figure is the points it added to the 100-point composite (weight × sub-score).
- Cash flow +15.3/30.0
- Appreciation +10.0/10.0
- ARV discount +7.5/15.0
- DSCR +4.7/10.0
- 1% rule +4.3/10.0
- Rent growth +4.0/5.0
- Livability +3.9/5.0
- Schools +3.5/10.0
- Condition / age +2.5/5.0
$232,000
🖨 Deal sheet 📄 Offer letter ✓ Due diligence
Listing remarks
Built in 2022, this beautifully maintained 4-bedroom, 2-bath manufactured home offers modern living with all the upgrades you've been looking for! Featuring luxury vinyl flooring throughout, this home combines style, durability, and easy maintenance. The spacious open-concept layout flows into a modern kitchen complete with updated finishes and plenty of cabinet space, while both bathrooms showcase contemporary touches and clean design. Situated on an oversized lot, the property offers plenty of room to enjoy the outdoors with a fully fenced yard perfect for pets, entertaining, or added privacy. An outdoor shed provides additional storage for tools, toys or lawn equipment. Whether you're a
Key facts
- Outdoor shed
- Modern kitchen
- Fully fenced yard
Tags
Property features AI
Finance
- Other: Property type: Residential; Property subtype: Manufactured Home; Zoning: R-3; Homestead exemption: Yes; Total living area reported as 1,904 sq ft
- Financial info: Taxes listed (not included per instructions)
- HOA & community: No HOA/association
Exterior
- Parking: Parking details not provided
- Security: No security features listed
- Utilities: Public water; Public sewer; Cable connected; Broadband/High-speed internet available; Water connected
- Home design: Manufactured home (double wide); One story; North-facing
- Construction: Vinyl siding; Shingle roof; Crawlspace foundation; Built as a double wide manufactured home
- Exterior features: Concrete road access; Workshop on property; Lot approximately 0.2 acres
Interior
- Kitchen: Cooktop; Range; Microwave; Dishwasher; Refrigerator
- Bedrooms: 4 bedrooms
- Flooring: Carpet
- Bathrooms: 2 full bathrooms
- Heating & cooling: Central heat; Central air conditioning
- Interior features: No additional interior features listed
- Laundry & utility: Washer; Dryer; Laundry area in kitchen
Neighborhood map
What this means for you Summary
Snapshot
- This is a 4-bed/2.0-bath manufactured listed at $232k.
Deal economics
- At list price, monthly cash flow is $85 ($1k/yr) — positive.
- The deal already cash-flows at list — no discount required.
- To meet the 1% rule (rent ≥ 1% of price), the offer needs to be $217k (6.5% below list).
- Recommended offer: $217k (6.5% below list) — sets the bar for 1% rule.
Location & tenants
- Location reads 77/100 on livability (#206 in FL, #3,179 nationally) — a middle-class / working-renter tenant base. Strengths: cost of living A+, housing A+, health & safety A+; Watch: employment D+, amenities F, commute F.
- Polk (suburban): math 39% / reading 43% proficiency, ranked #62 of 73 in FL (top 85%) — families likely to look elsewhere, expect single-tenant / working-renter base with shorter leases.
- Market conditions: Rents rising fast (+6.1%/yr); 72 active listings in the ZIP; 8 comparable units currently listed for rent nearby; rentals at typical pace (median 24d on market — plan ~3-4 weeks tenant-placement turnaround); lower-income renter base — watch delinquency; 10,384 units permitted in Polk County in 2024 (1,716 in 5+ unit buildings).
- At $2,168/mo this rent would consume 69% of the median local household income ($37k/yr) (locally 700% of renters already pay >50% of income on rent) — very limited rent-growth headroom before tenants either downsize or default.
Forward outlook
- In year one you build about $25k of equity ($2k loan paydown + $23k appreciation (10.0% local appreciation)).
- Polk County population projected at +33% by 2050 — long-run rental-demand tailwind backs the buy-and-hold thesis.
- At projected returns (10.0% appreciation + 6.1% rent growth), your $65k cash investment doubles in ~3 years — after that, you're playing with house money.
- By year 2, paydown + projected appreciation supports a ~$40k cash-out refi (75% LTV) — recoverable capital for the next deal without selling this one.
Negotiation context
- It's been on market 38 days — a 3% lower offer ($225k) is reasonable based on typical stale-listing flexibility.
- Current owner paid $14k; list at $232k implies a 1557% gain — meaningful room to come down on a strong offer.
Risks & watch-outs
- Climate carrying-cost: severe wind risk, 99% chance of damaging wind over 30y; extreme-heat days projected 7→24/yr by 2055 (HVAC capex compounding) — expect insurance premiums to compound above CPI over the hold.
Questions for the listing agent
- It's been on market 38 days. Have you received any prior offers? Is the seller open to a 7% concession, seller financing, or rate buy-down credit?
- Is there a deadline driving the sale (1031 exchange, divorce, estate, relocation)? That informs how much negotiation room exists.
- What's the average days-on-market for RENTAL listings here right now (not sales)? A rising rental-DOM trend means longer vacancies and softer asking-rent achievability than the comps imply.
- What's the recent tenant-quality profile in this submarket — average credit score on applications, eviction rate, late-payment / NSF rate, and stable-employment percentage? A property-management company in the area should have these aggregated.
- How much new for-sale + rental construction is in the pipeline within 1–3 miles? Heavy new supply typically softens prices + rents 12–24 months out; constrained supply supports both.
Investment metrics
- 1% rule
- 0.93% ✗
- Cap rate
- 6.73%
- Cash-on-cash
- 1.57%
- DSCR
- 1.07
- GRM
- 8.9
CMA / ARV
No comps found within radius.
Projected returns pro-forma
10.0% appreciation · 6.14% rent growth · sell at horizon
- IRR
- 26.6%
- Equity multiple
- 3.14×
- Total profit
- $138,872
- Equity at exit
- $209,004
- IRR
- 24.2%
- Equity multiple
- 7.48×
- Total profit
- $421,072
- Equity at exit
- $450,725
Cash invested: $64,960 (down + closing). Projections, not guarantees.
Landlord ↔ Tenant lean methodology
- Overall (STATE)
- 87 Strongly Landlord-Friendly
- State Florida
- 87 Strongly Landlord-Friendly · R+3
- County
- — inherits STATE
- City
- — inherits STATE
ZIP-level market 33815
- Home prices YoY
- 12.6%
- Rents YoY
- 6.1%
- Active inventory
- 72
- Price-to-rent
- 8.9×
Monthly cashflow live
- Estimated rent
- $2,168 high interval (Pro) →
- Mortgage (P&I)
- −$1,217
- Tax from tax record
- −$315 /mo · $3,776/yr
- Insurance
- −$97
- HOA
- −$0
- Vacancy / Maint / Mgmt
- −$455
- Net cashflow
- $85
Break-even live
UW: 25.0% down · 7.5% · 30yr · 1.5% tax · 5.0% vac · 8.0% maint · 8.0% mgmt
Financing live
Cash to close
- Down payment
- $58,000
- Closing costs
- $6,960
- Reserves months
- —
- Total cash needed
- —
Loan-product check · same deal, 3 products live
Conventional
25% down · 7.5% · 30yr
- Down + closing
- —
- Monthly P&I
- —
- Monthly cashflow
- —
- DSCR
- —
- Eligible?
- —
Personal DTI + credit; lowest rate.
DSCR
20% down · 8.5% · 30yr
- Down + closing
- —
- Monthly P&I
- —
- Monthly cashflow
- —
- DSCR
- —
- Eligible?
- —
No personal income docs; deal must DSCR.
Hard money
10% down · 12.0% · 12mo
- Down + closing
- —
- Monthly P&I
- —
- Monthly cashflow
- —
- DSCR
- —
- Eligible?
- —
Short-term bridge; refi at stabilization.
Rent comps 8 comps
| Address | Beds | Baths | Sqft | Rent | $/sqft | DOM | Units | Dist |
|---|---|---|---|---|---|---|---|---|
| 1806 Dorothy St Lakeland, FL | 3.0 | 2.0 | 2046 | $1,695 | $0.83 | 3d | 1 | 0.63mi |
| 2480 Chestnut Woods Dr Lakeland, FL | 3.0 | 2.0 | 2440 | $1,300 | $0.53 | 23d | 1 | 0.93mi |
| 1246 Dorothy St Lakeland, FL | 3.0 | 2.0 | 1484 | $2,300 | $1.55 | 23d | 1 | 1.16mi |
| 1335 W Walnut St Lakeland, FL | 3.0 | 2.0 | 1626 | $1,800 | $1.11 | 3d | 1 | 1.20mi |
| 2127 Blue Highlands Dr Lakeland, FL | 4.0 | 2.0 | 1872 | $2,275 | $1.22 | 23d | 1 | 1.22mi |
| 3327 Old Tampa Hwy Unit N/A Lakeland, FL | 3.0 | 2.0 | 1409 | $2,290 | $1.63 | 14d | 1 | 1.25mi |
| 3227 Bayou Bay Dr Lakeland, FL | 4.0 | 2.0 | 1872 | $2,600 | $1.39 | 3d | 1 | 1.38mi |
| 2853 Grandbury Grove Rd Lakeland, FL | 3.0 | 2.0 | 1711 | $2,300 | $1.34 | 23d | 1 | 1.48mi |
Listing history 16 events
-
2026-06-18days on market $232,000 Active 38 DOM
-
2026-06-17days on market $232,000 Active 37 DOM
-
2026-06-16days on market $232,000 Active 36 DOM
-
2026-06-15days on market $232,000 Active 35 DOM
-
2026-06-13pricedays on market $232,000 Active 33 DOM
-
2026-06-10days on market $240,000 Active 30 DOM
-
2026-06-09days on market $240,000 Active 29 DOM
-
2026-06-08days on market $240,000 Active 28 DOM
-
2026-06-07days on market $240,000 Active 27 DOM
-
2026-06-05days on market $240,000 Active 24 DOM
-
2026-06-03days on market $240,000 Active 23 DOM
-
2026-06-03days on market $240,000 Active 22 DOM
-
2026-06-01days on market $240,000 Active 21 DOM
-
2026-05-31days on market $240,000 Active 20 DOM
-
2026-05-11$240,000 Active
-
1982-03-01soldstatus $14,000
ⓘ Source: listings_history table (triggers on properties + properties_extension) + one-shot
backfill from property_details.listing_events for pre-trigger history.
Tax reassessment forecast FL · Resets to sale price
- Current annual tax
- $3,776 · $315/mo
- Projected year-2 tax
- $3,776 · $315/mo
- Expected delta
- $0/yr ($0/mo · 0.0%)
ⓘ Screening estimate from a state-policy table — verify with the county assessor before closing.
Climate risk First Street
- Flood 1/10 Low FEMA zone X (unshaded) · 0% chance over 30 yrs
- Wildfire 3/10 Moderate
- Heat 8/10 Severe 7 d/yr ≥108°F today · 24 d/yr by 30 yrs out
- Wind 10/10 Extreme 99% chance of damaging wind over 30 yrs
- Air quality 2/10 Low 1 unhealthy d/yr today · 2 by 30 yrs out
Nearby sold comps map
Loading sold comps map…
Walkable amenities ~0.75 mi
Loading nearby amenities…
Taxation est. · year 1
- Rental income
- $26,018
- − Mortgage interest
- −$12,996
- − Property taxes
- −$3,776
- − Insurance
- −$1,160
- − Repairs & maintenance
- −$2,081
- − Management
- −$2,081
- − Depreciation
- −$6,749
- Taxable loss
- −$2,826
- Est. tax savings @ 24.0%
- +$678
- After-tax cash flow
- $1,697/yr
For passive investors: Depreciation is non-cash, so a rental often shows a tax loss while cash-flowing — sheltering income. Rental losses are passive: they offset passive income freely, and up to $25,000/yr can offset ordinary (W-2) income if you actively participate and your MAGI is under $100k (phasing out to $0 by $150k); unused losses carry forward. On sale, claimed depreciation is recaptured at up to 25%, and gains may owe capital-gains tax (a 1031 exchange can defer both). Figures are a year-1 estimate at your 24.0% rate — not tax advice; consult a CPA.
Schools (NCES district)
- District
- Polk
- NCES district ID
- 1201590
- Math proficiency
- 39% ▼ -11.00%
- Reading proficiency
- 43% ▼ -4.00%
- Median HH income
- $43,979
- Composite
- 34.74/100
- National rank
- #5132
- State rank
- #62 of 73 in FL
Livability — Lakeland
- Score
- 77/100
- State rank
- #206
- US rank
- #3179
Category grades
Schools grade is shown separately in the Schools card above.
Census & demographics
- County
- Polk County · 740,051 people
- City population
- 277,690
- Metro
- Lakeland-Winter Haven, FL
- Population (ZIP)
- 13,975
- Household income
- $37,487
- Rent vs Own
- Severe rent burden
- 700.0
Population outlook (Polk County) Hauer SSP2
- Today (2025)
- 752,975 people
- By 2030
- 804,621 · +6.9%
- By 2040
- 906,117 · +20.3%
- By 2050
- 1,000,476 · +32.9%
- By 2075
- 1,197,520 · +59.0%
- By 2100
- 1,271,518 · +68.9%
Race, ethnicity, and origin ACS 2023
- Neighborhood character
- Diverse neighborhood (Simpson 0.67)
- Race & ethnicity
- White 43% Black 27% Hispanic / Latino 26% Two or more races 10% Asian 1%
- Hispanic origin (detail)
- Mexican 12% Puerto Rican 10%
- Common ancestry
- Romanian 1% German 1% Lithuanian 1%
- Foreign-born
- 11% · Canada, Jamaica, China
- Languages at home
- 75% English-only · Spanish 23% German/W. Germanic 1%
Political lean MEDSL · Polk
- 2024 margin
- Strong R (+20.7) · D 39.2% · R 59.9%
- 2008→2024 swing
- -14.6pp toward R · 2008: -6.1pp · 2024: -20.7pp
- All cycles
- 2024: R+20.7 2020: R+14.4 2016: R+14.1 2012: R+6.8 2008: R+6.1
Not yet ingested
- Civics
- —
Market trends
- HPI YoY
- ▲ 47.45%
- Current HPI
- 424.0956
- Rent YoY
- ▲ 6.14%
- Metro
- Lakeland-Winter Haven, FL
- State GDP YoY
- ▲ 3.28%
- F500 in state
- 36
Industry mix (Fortune 500 HQ in FL)
| Industry | F500 HQs | Revenue |
|---|---|---|
| Industrial Technology | 2 | $29B |
|
||
| Insurance | 2 | $17B |
|
||
| Retail | 1 | $60B |
|
||
| Technology Distribution | 1 | $58B |
|
||
| Homebuilding | 1 | $35B |
|
||
| Technology Manufacturing | 1 | $35B |
|
||
Price history
+1614.3% since first listed2 events — show timeline
- 2026-05-11 Listed $240,000 Stellar MLS as Distributed by MLS Grid
- 1982-03-01 Sold (Public Records) $14,000 Public Records
Property tax history
+15.3%/yrLatest (2025): $3,776 · -4.7% YoY. Source: county tax records.
Cash-flow waterfall
monthlySold comps — $/sqft
last 12 mo · ≤1 miLoading sold comps…