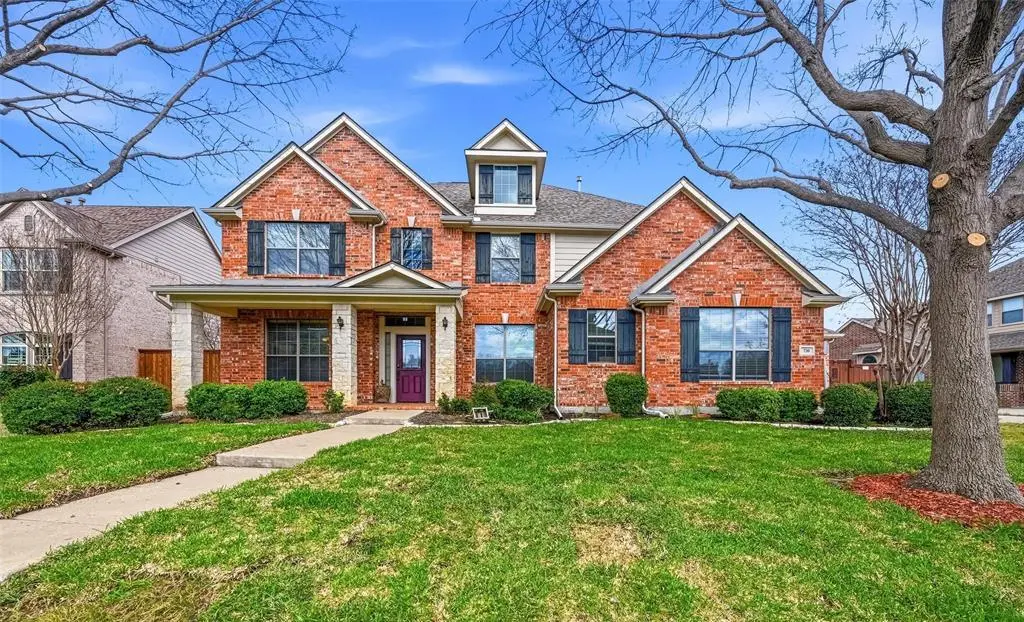
730 Pheasant Run Dr · Murphy, TX
Flood risk 1/10 · Minimal
- FEMA flood zone
- X (unshaded)
- Chance of flooding over 30 yrs
- 0.0%
- Est. flood insurance / yr
- $507 – $1,088
Fire risk 4/10 · Minor
- Est. fire insurance / yr
- $1,222 – $2,270
Heat risk 7/10 · Major
- Hot days now (above 109°F)
- 7 days/yr
- Hot days in 30 yrs
- 23 days/yr
Wind risk 6/10 · Moderate
- Chance of severe wind over 30 yrs
- 27.0%
Air-quality risk 3/10 · Minor
- Unhealthy air days now
- 2 days/yr
- Unhealthy air days in 30 yrs
- 3 days/yr
Risk factors via First Street. Map © Google.
Why this score? — see what drove the B grade
The composite is a weighted blend of 9 inputs, each scored 0–100. Each bar is that input's sub-score; the figure is the points it added to the 100-point composite (weight × sub-score).
- Cash flow +30.0/30.0
- ARV discount +10.8/15.0
- 1% rule +10.0/10.0
- DSCR +10.0/10.0
- Schools +4.9/10.0
- Livability +4.1/5.0
- Rent growth +2.5/5.0
- Condition / age +2.5/5.0
- Appreciation +0.0/10.0
$715,000
🖨 Deal sheet (PDF) 📄 Offer letter ✓ Due diligence
Listing remarks MLS
Welcome to your dream home! This stunning three story residence offers the perfect blend of comfort, space, and style. The home’s layout is designed for versatility and privacy, making it ideal for multigenerational living or growing families. Step outside to your private backyard oasis, complete with a sparkling swimming pool; perfect for summer fun and outdoor gatherings. Whether you’re looking for space to spread out, areas to entertain, or a beautiful neighborhood to call home, this property checks all the boxes. Don’t miss your chance to own this exceptional home, schedule a showing today!
Key facts
- 0.26 acre lot
- 3 garage spots
- Pool
Tags
Neighborhood map
What this means for you Summary
Snapshot
- This is a 6-bed/4.0-bath single-family listed at $715k.
Deal economics
- At list price, monthly cash flow is $4k ($43k/yr) — positive.
- The deal already cash-flows at list — no discount required.
- Meets the 1% rule at list price ($11k rent vs $715k).
- Recommended offer: $651k (9.0% below list) — sets the bar for market timing.
- Cap rate 12.3% vs local median 2.9% in Murphy — top-decile yield for the area; either an underpriced asset or a hidden risk that comps aren't pricing in. Stress-test before assuming the spread holds.
Location & tenants
- Location reads 82/100 on livability (#17 in TX, #1,218 nationally) — a professional / high-income tenant draw. Strengths: schools A+, crime A+, amenities A+; Watch: commute F, cost of living F.
- Plano ISD (urban): math 52% / reading 55% proficiency, ranked #90 of 826 in TX (top 11%) — acceptable for families but not a draw, mixed tenant base, ~2y average lease.
- Market conditions: 98 active listings in the ZIP; 4 comparable units currently listed for rent nearby; rentals lingering (median 44d on market — plan ~5-8 weeks vacancy on turnover, expect pricing pressure); 100% of comp listings sitting > 30 days — soft ceiling on asking rent; 19,194 units permitted in Collin County in 2024 (3,988 in 5+ unit buildings).
Forward outlook
- Local home prices are declining (-3.0%/yr); year-one equity from $5k of loan paydown is wiped out by about $21k of value loss. Plan a longer hold.
- Collin County population projected at +60% by 2050 — long-run rental-demand tailwind backs the buy-and-hold thesis.
- At projected returns (-3.0% appreciation + 3.0% rent growth), your $200k cash investment doubles in ~6 years — after that, you're playing with house money.
Negotiation context
- It's been on market 98 days — a 9% lower offer ($651k) is reasonable based on typical stale-listing flexibility.
- 3 sale attempts since 7y ago with the ask held roughly flat each time — persistent listings suggest the price (not the market) is what's stuck; bring a comps-based counter.
Risks & watch-outs
- Climate carrying-cost: major wind risk, 27% chance of damaging wind over 30y; extreme-heat days projected 7→23/yr by 2055 (HVAC capex compounding) — expect insurance premiums to compound above CPI over the hold.
Questions for the listing agent
- It's been on market 98 days. Have you received any prior offers? Is the seller open to a 9% concession, seller financing, or rate buy-down credit?
- What does the HOA fee cover, when was the last increase, and are there any pending special assessments or reserve-fund shortfalls?
- Why hasn't it sold? Are there any deal-killer items the seller is aware of (foundation, flood, title, zoning, code violations)?
- Is there a deadline driving the sale (1031 exchange, divorce, estate, relocation)? That informs how much negotiation room exists.
- Schools are A-rated — typically a magnet for longer-tenancy family renters. What's the average tenant stay here, and is there a school-zone premium baked into asking?
- What's the average days-on-market for RENTAL listings here right now (not sales)? A rising rental-DOM trend means longer vacancies and softer asking-rent achievability than the comps imply.
- What's the recent tenant-quality profile in this submarket — average credit score on applications, eviction rate, late-payment / NSF rate, and stable-employment percentage? A property-management company in the area should have these aggregated.
- How much new for-sale + rental construction is in the pipeline within 1–3 miles? Heavy new supply typically softens prices + rents 12–24 months out; constrained supply supports both.
Investment metrics
- 1% rule
- 1.53% ✓
- Cap rate
- 12.31%
- Cash-on-cash
- 21.47%
- DSCR
- 1.96
- GRM
- 5.4
CMA / ARV
- ARV (median comp)
- $770,897
- List price
- $715,000
- Delta
- -7.25%
- Verdict
- FAIR
- Comps
- 20 within 1.0 mi
Show comp detail 12 sales within ~0.75 mi
| Address | Dist | Beds/Ba | Sqft | Sold | Price | $/sf | Match |
|---|---|---|---|---|---|---|---|
| 527 Buffalo Bend Ct | 0.29mi | 5/3.5 (-1) | 4,087 (+1%) | 2mo | $799,000 | $195 | 77 |
| 535 Cedarbird Trl | 0.28mi | 5/4.0 (-1) | 4,117 (+2%) | 7mo | $725,000 | $176 | 73 |
| 926 Falcon Trl | 0.37mi | 5/3.5 (-1) | 4,073 (+0%) | 5mo | $675,000 | $166 | 71 |
| 433 Shady Oaks Dr | 0.27mi | 5/4.0 (-1) | 3,783 (-7%) | 2mo | $650,000 | $172 | 70 |
| 526 Mockingbird Dr | 0.39mi | 5/4.0 (-1) | 4,474 (+10%) | 3mo | $895,000 | $200 | 57 |
| 338 Greenfield Dr | 0.47mi | 5/3.0 (-1) | 3,785 (-7%) | 2mo | $724,900 | $192 | 57 |
| 341 Greenfield Dr | 0.44mi | 5/4.0 (-1) | 3,583 (-12%) | 0mo | $615,000 | $172 | 55 |
| 432 Huntington Dr | 0.35mi | 5/4.0 (-1) | 4,475 (+10%) | 8mo | $759,000 | $170 | 55 |
| 448 Huntington Dr | 0.31mi | 5/4.0 (-1) | 4,475 (+10%) | 11mo | $825,000 | $184 | 54 |
| 431 Dakota Dr | 0.42mi | 5/3.5 (-1) | 3,568 (-12%) | 1mo | $695,000 | $195 | 53 |
| 227 Justin Rd | 0.74mi | 5/4.0 (-1) | 3,960 (-2%) | 5mo | $700,000 | $177 | 52 |
| 830 Mustang Ridge Dr | 0.33mi | 5/4.0 (-1) | 4,528 (+12%) | 10mo | $775,000 | $171 | 52 |
Match score weights: distance 35% · size 25% · config 20% · recency 20%. Top-matched comps best support the ARV.
Projected returns pro-forma
-3.0% appreciation · 3.0% rent growth · sell at horizon
- IRR
- 14.1%
- Equity multiple
- 1.56×
- Total profit
- $112,535
- Equity at exit
- $106,609
- IRR
- 22.9%
- Equity multiple
- 2.96×
- Total profit
- $392,765
- Equity at exit
- $61,820
Cash invested: $200,200 (down + closing). Projections, not guarantees.
Landlord ↔ Tenant lean methodology
- Overall (STATE)
- 87 Strongly Landlord-Friendly
- State Texas
- 87 Strongly Landlord-Friendly · R+5
- County
- — inherits STATE
- City
- — inherits STATE
ZIP-level market 75094
- Home prices YoY
- -18.1%
- Active inventory
- 98
- Price-to-rent
- 5.4×
Monthly cashflow live
- Estimated rent
- $10,950 medium interval (Pro) →
- Mortgage (P&I)
- −$3,750
- Tax from tax record
- −$983 /mo · $11,794/yr
- Insurance
- −$298
- HOA
- −$38
- Vacancy / Maint / Mgmt
- −$2,300
- Net cashflow
- $3,582
Break-even live
Sensitivity live
| Price | -10% $3,987 | -5% $3,785 | +0% $3,582 | +5% $3,380 | +10% $3,177 |
|---|---|---|---|---|---|
| Rent | -10% $2,717 | -5% $3,150 | +0% $3,582 | +5% $4,015 | +10% $4,447 |
| Rate | -1.0pp $3,942 | -0.5pp $3,764 | base $3,582 | +0.5pp $3,397 | +1.0pp $3,208 |
UW: 25.0% down · 7.5% · 30yr · 1.5% tax · 5.0% vac · 8.0% maint · 8.0% mgmt
Financing live
Cash to close
- Down payment
- $178,750
- Closing costs
- $21,450
- Reserves months
- —
- Total cash needed
- —
Loan-product check · same deal, 3 products live
Conventional
25% down · 7.5% · 30yr
- Down + closing
- —
- Monthly P&I
- —
- Monthly cashflow
- —
- DSCR
- —
- Eligible?
- —
Personal DTI + credit; lowest rate.
DSCR
20% down · 8.5% · 30yr
- Down + closing
- —
- Monthly P&I
- —
- Monthly cashflow
- —
- DSCR
- —
- Eligible?
- —
No personal income docs; deal must DSCR.
Hard money
10% down · 12.0% · 12mo
- Down + closing
- —
- Monthly P&I
- —
- Monthly cashflow
- —
- DSCR
- —
- Eligible?
- —
Short-term bridge; refi at stabilization.
Rent comps 4 comps
| Address | Beds | Baths | Sqft | Rent | $/sqft | DOM | Units | Dist |
|---|---|---|---|---|---|---|---|---|
| 509 Lochwood Dr Murphy, TX | 5.0 | 3.0 | 3761 | $3,750 | $1.00 | 44d | 1 | 0.65mi |
| 139 Wentwood Dr Murphy, TX | 5.0 | 3.5 | 3103 | $3,250 | $1.05 | 44d | 1 | 0.74mi |
| 4325 Angelina Dr Unit 1019521P Plano, TX | 6.0 | 3.5 | 3379 | $22,166 | $6.56 | 44d | 1 | 1.04mi |
| 4325 Angelina Dr Plano, TX | 6.0 | 3.5 | 3381 | $10,950 | $3.24 | 44d | 1 | 1.04mi |
HOA detail
- Monthly dues
- $38 · $456/yr
- Likely covers
- pool
Listing history 24 events
-
2026-06-18days on market $715,000 Active 98 DOM
-
2026-06-17days on market $715,000 Active 97 DOM
-
2026-06-16days on market $715,000 Active 96 DOM
-
2026-06-15days on market $715,000 Active 95 DOM
-
2026-06-13days on market $715,000 Active 93 DOM
-
2026-06-09days on market $715,000 Active 89 DOM
-
2026-06-08days on market $715,000 Active 88 DOM
-
2026-06-07days on market $715,000 Active 87 DOM
-
2026-06-04days on market $715,000 Active 84 DOM
-
2026-06-03days on market $715,000 Active 83 DOM
-
2026-06-02days on market $715,000 Active 82 DOM
-
2026-06-01days on market $715,000 Active 81 DOM
-
2026-05-31days on market $715,000 Active 80 DOM
-
2026-05-18price $715,000 626-char remark
Show marketing remark (626 chars)
Welcome to your dream home! This stunning three story residence offers the perfect blend of comfort, space, and style. The home’s layout is designed for versatility and privacy, making it ideal for multigenerational living or growing families. Step outside to your private backyard oasis, complete with a sparkling swimming pool; perfect for summer fun and outdoor gatherings. Whether you’re looking for space to spread out, areas to entertain, or a beautiful neighborhood to call home, this property checks all the boxes. Don’t miss your chance to own this exceptional home, schedule a showing today!
-
2026-03-12$740,000 Active 626-char remark
Show marketing remark (626 chars)
Welcome to your dream home! This stunning three story residence offers the perfect blend of comfort, space, and style. The home’s layout is designed for versatility and privacy, making it ideal for multigenerational living or growing families. Step outside to your private backyard oasis, complete with a sparkling swimming pool; perfect for summer fun and outdoor gatherings. Whether you’re looking for space to spread out, areas to entertain, or a beautiful neighborhood to call home, this property checks all the boxes. Don’t miss your chance to own this exceptional home, schedule a showing today!
-
2025-12-31historical
-
2025-09-27price $769,999
-
2025-07-02price $770,000
-
2025-06-02$785,000 Active
-
2019-07-15soldstatus Sold
-
2019-07-15soldstatus
-
2019-07-12status Pending
-
2019-06-17historical Active Option Contract
-
2019-06-10$490,000 Active
ⓘ Source: listings_history table (triggers on properties + properties_extension) + one-shot
backfill from property_details.listing_events for pre-trigger history.
Tax reassessment forecast TX · Resets to sale price
- Current annual tax
- $11,794 · $983/mo
- Projected year-2 tax
- $13,084 · $1,090/mo
- Expected delta
- +$1,290/yr (+$108/mo · 10.9%)
ⓘ Screening estimate from a state-policy table — verify with the county assessor before closing.
Climate risk First Street
- Flood 1/10 Low FEMA zone X (unshaded) · 0% chance over 30 yrs
- Wildfire 4/10 Moderate
- Heat 7/10 Severe 7 d/yr ≥109°F today · 23 d/yr by 30 yrs out
- Wind 6/10 Major 27% chance of damaging wind over 30 yrs
- Air quality 3/10 Moderate 2 unhealthy d/yr today · 3 by 30 yrs out
Nearby sold comps map
Loading sold comps map…
Walkable amenities ~0.75 mi
Loading nearby amenities…
Taxation est. · year 1
- Rental income
- $131,400
- − Mortgage interest
- −$40,051
- − Property taxes
- −$11,794
- − Insurance
- −$3,575
- − Repairs & maintenance
- −$10,512
- − Management
- −$10,512
- − HOA
- −$456
- − Depreciation
- −$20,800
- Taxable income
- $33,700
- Est. tax owed @ 24.0%
- −$8,088
- After-tax cash flow
- $34,898/yr
For passive investors: Depreciation is non-cash, so a rental often shows a tax loss while cash-flowing — sheltering income. Rental losses are passive: they offset passive income freely, and up to $25,000/yr can offset ordinary (W-2) income if you actively participate and your MAGI is under $100k (phasing out to $0 by $150k); unused losses carry forward. On sale, claimed depreciation is recaptured at up to 25%, and gains may owe capital-gains tax (a 1031 exchange can defer both). Figures are a year-1 estimate at your 24.0% rate — not tax advice; consult a CPA.
Schools (NCES district)
- District
- Plano ISD
- NCES district ID
- 4835100
- Math proficiency
- 52% ▼ -13.00%
- Reading proficiency
- 55% ▼ -8.00%
- Median HH income
- $79,861
- Composite
- 48.54/100
- National rank
- #2115
- State rank
- #90 of 826 in TX
Livability — Murphy
- Score
- 82/100
- State rank
- #17
- US rank
- #1218
Category grades
Schools grade is shown separately in the Schools card above.
Census & demographics
- Census place
- Murphy, TX
- City population
- 23,669
- Population (ZIP)
- 23,669
Population outlook (Collin County) Hauer SSP2
- Today (2025)
- 1,210,074 people
- By 2030
- 1,358,201 · +12.2%
- By 2040
- 1,654,061 · +36.7%
- By 2050
- 1,937,359 · +60.1%
- By 2075
- 2,567,039 · +112.1%
- By 2100
- 2,952,048 · +144.0%
Race, ethnicity, and origin ACS 2023
- Neighborhood character
- Diverse neighborhood (Simpson 0.63)
- Race & ethnicity
- White 47% Asian 38% Black 10% Two or more races 4% Hispanic / Latino 3%
- Common ancestry
- Lithuanian 2% Romanian 2% Italian 2%
- Foreign-born
- 28% · Vietnam, China, Canada
- Languages at home
- 61% English-only · Other Indo-European 16% Vietnamese 7% Other Asian/Pacific 5%
Political lean MEDSL · Collin
- 2024 margin
- R (+11.1) · D 43.1% · R 54.3% · Other 2.6%
- 2008→2024 swing
- +14.4pp toward D · 2008: -25.6pp · 2024: -11.1pp
- All cycles
- 2024: R+11.1 2020: R+4.3 2016: R+17.0 2012: R+31.6 2008: R+25.6
Not yet ingested
- Civics
- —
Market trends
- HPI YoY
- ▼ -53.09%
- Current HPI
- 240.1094
- Rent YoY
- —
- Metro
- —
- State GDP YoY
- ▲ 3.95%
- F500 in state
- 110
Industry mix (Fortune 500 HQ in TX)
| Industry | F500 HQs | Revenue |
|---|---|---|
| Energy | 16 | $1,198B |
|
||
| Technology | 5 | $198B |
|
||
| Engineering / Construction | 4 | $72B |
|
||
| Energy Services | 3 | $60B |
|
||
| Utilities | 3 | $41B |
|
||
| Healthcare | 2 | $330B |
|
||
Price history
+45.9% since first listed11 events — show timeline
- 2026-05-18 Price Changed $715,000 NTREIS
- 2026-03-12 Listed $740,000 NTREIS
- 2025-12-31 Listing Removed — NTREIS
- 2025-09-27 Price Changed $769,999 NTREIS
- 2025-07-02 Price Changed $770,000 NTREIS
- 2025-06-02 Listed $785,000 NTREIS
- 2019-07-15 Sold (Public Records) — Public Records
- 2019-07-15 Sold (MLS) — NTREIS
- 2019-07-12 Pending — NTREIS
- 2019-06-17 Contingent — NTREIS
- 2019-06-10 Listed $490,000 NTREIS
Property tax history
+2.7%/yrLatest (2025): $11,794 · +8.2% YoY. Source: county tax records.
Cash-flow waterfall
monthlySold comps — $/sqft
last 12 mo · ≤1 miLoading sold comps…