 Duplex
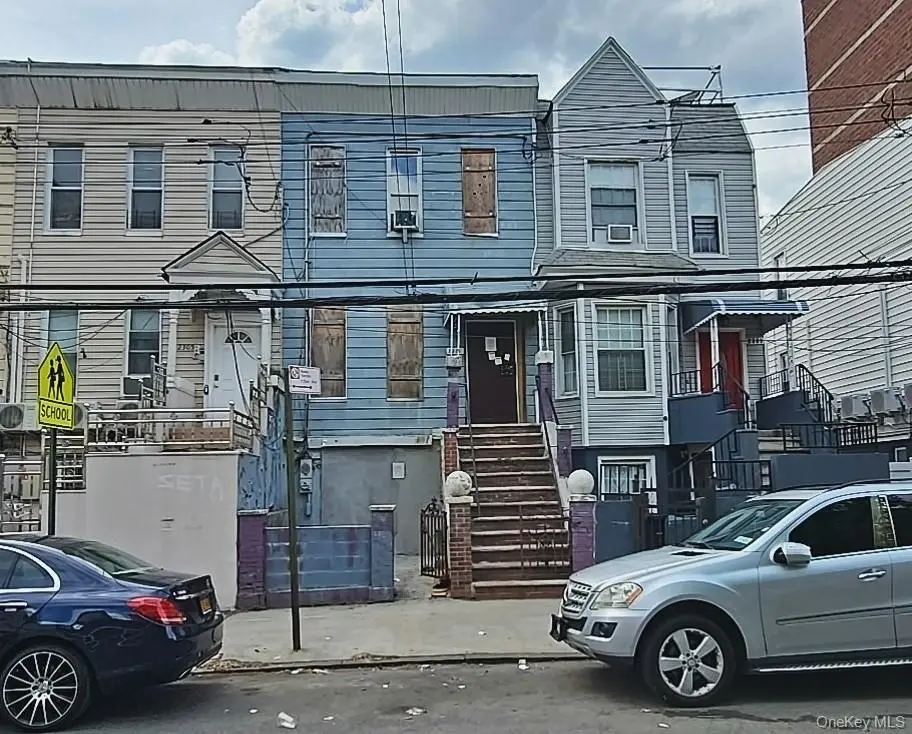
2307 Cambreleng Ave · New York, NY
Flood risk 1/10 · Minimal
- FEMA flood zone
- X (unshaded)
- Chance of flooding over 30 yrs
- 0.0%
- Est. flood insurance / yr
- $507 – $1,088
Fire risk 1/10 · Minimal
- Est. fire insurance / yr
- $691 – $1,283
Heat risk 6/10 · Moderate
- Hot days now (above 99°F)
- 7 days/yr
- Hot days in 30 yrs
- 15 days/yr
Wind risk 6/10 · Moderate
- Chance of severe wind over 30 yrs
- 27.0%
Air-quality risk 3/10 · Minor
- Unhealthy air days now
- 3 days/yr
- Unhealthy air days in 30 yrs
- 4 days/yr
Risk factors via First Street. Map © Google.
Why this score? — see what drove the A grade
The composite is a weighted blend of 9 inputs, each scored 0–100. Each bar is that input's sub-score; the figure is the points it added to the 100-point composite (weight × sub-score).
- Cash flow +29.4/30.0
- ARV discount +15.0/15.0
- DSCR +10.0/10.0
- 1% rule +7.5/10.0
- Appreciation +7.5/10.0
- Schools +5.0/10.0
- Rent growth +4.5/5.0
- Livability +3.8/5.0
- Condition / age +2.5/5.0
$484,900
🖨 Deal sheet 📄 Offer letter ✓ Due diligence
Multi-family units
County records classify this as Multi-Family (2-4 Unit). Listing-text estimate: 2 units. confirmed
Listing remarks
This vacant 1,575 sq ft duplex townhouse—just blocks from Arthur Avenue and the heart of Little Italy—offers a rare value add opportunity in an R7 1 zone. The property requires renovation, but the price reflects the condition and the strong upside potential for renovation, expansion, or redevelopment. The current layout includes: Unit 1: Two levels with 2 bedrooms, living room with fireplace, kitchen, and full bath. Unit 2: Upper level 1 bedroom unit with living room, kitchen, and bath With strong rental demand and walkability, this is a rare chance to invest in a property in one of the Bronx’s most vibrant and consistently appreciating neighborhoods.
Key facts
- Strong rental demand
- 1,558 sq ft lot
- Built 1925
Tags
Property features AI
Exterior
- Parking: No carport; No designated parking
- Utilities: Public sewer; Electricity connected; Natural gas connected; Sewer connected; Trash collection (public); Water connected
- Home design: Townhouse; Duplex
- Construction: Frame and stucco construction
- Exterior features: No waterfront
Interior
- Bedrooms: One 1-bedroom unit; One 2-bedroom unit
- Bathrooms: Two full bathrooms
- Heating & cooling: Hot water heating; Wall/window air conditioning unit(s)
- Interior features: First floor bedroom; First floor full bath; Finished basement
Neighborhood map
What this means for you Summary
Snapshot
- This is a 1×3bd/2.0ba + 1×1bd/1.0ba units multifamily listed at $485k.
Deal economics
- At list price, monthly cash flow is $2k ($21k/yr) — positive. Per door: $861/mo.
- The deal already cash-flows at list — no discount required.
- Meets the 1% rule at list price ($6k rent vs $485k).
- Recommended offer: $478k (1.5% below list) — sets the bar for market timing.
- Cap rate 10.6% vs local median 2.6% in New York — top-decile yield for the area; either an underpriced asset or a hidden risk that comps aren't pricing in. Stress-test before assuming the spread holds.
Location & tenants
- Location reads 75/100 on livability (#268 in NY, #4,188 nationally) — a middle-class / working-renter tenant base. Strengths: amenities A+, commute A+, health & safety A; Watch: crime F, cost of living F.
- Market conditions: Rents rising fast (+8.0%/yr); 62 active listings in the ZIP; lower-income renter base — watch delinquency; 6,929 units permitted in Bronx County in 2024 (6,829 in 5+ unit buildings).
- At $6,080/mo this rent would consume 179% of the median local household income ($41k/yr) (locally 10274% of renters already pay >50% of income on rent) — very limited rent-growth headroom before tenants either downsize or default.
Forward outlook
- In year one you build about $28k of equity ($3k loan paydown + $24k appreciation (5.0% local appreciation)).
- Bronx County population projected at +21% by 2050 — long-run rental-demand tailwind backs the buy-and-hold thesis.
- At projected returns (5.0% appreciation + 8.0% rent growth), your $136k cash investment doubles in ~3 years — after that, you're playing with house money.
- By year 2, paydown + projected appreciation supports a ~$44k cash-out refi (75% LTV) — recoverable capital for the next deal without selling this one.
Negotiation context
- It's been on market 25 days — a 2% lower offer ($478k) is reasonable based on typical stale-listing flexibility.
- Current owner paid $130k; list at $485k implies a 272% gain — meaningful room to come down on a strong offer.
Risks & watch-outs
- Watch-outs: built in 1925 — expect roof / HVAC / electrical / plumbing capex.
- Climate carrying-cost: major wind risk, 27% chance of damaging wind over 30y; extreme-heat days projected 7→15/yr by 2055 (HVAC capex compounding) — expect insurance premiums to compound above CPI over the hold.
Questions for the listing agent
- Can we see the unit-by-unit rent roll, current vacancy, and any below-market leases? What's the average tenancy length?
- What capital expenditures (roof, boiler, parking lot, exteriors) have been made in the last 5 years, and what's planned in the next 2?
- Built in 1925 — when were the roof, HVAC, electrical panel, plumbing, and water heater last replaced?
- Is there a deadline driving the sale (1031 exchange, divorce, estate, relocation)? That informs how much negotiation room exists.
- Schools are B-rated — typically a magnet for longer-tenancy family renters. What's the average tenant stay here, and is there a school-zone premium baked into asking?
- Crime grade is F in this area — have there been break-ins, vandalism, or insurance claims at this property in the last 3 years? What carrier currently insures it and at what premium?
- What's the average days-on-market for RENTAL listings here right now (not sales)? A rising rental-DOM trend means longer vacancies and softer asking-rent achievability than the comps imply.
- What's the recent tenant-quality profile in this submarket — average credit score on applications, eviction rate, late-payment / NSF rate, and stable-employment percentage? A property-management company in the area should have these aggregated.
- How much new apartment / multifamily construction is in the pipeline within 1–3 miles? Heavy new supply (>2% of stock underway) typically softens rents 12–24 months out; light construction supports rent growth.
Investment metrics
- 1% rule
- 1.25% ✓
- Cap rate
- 10.55%
- Cash-on-cash
- 15.22%
- DSCR
- 1.68
- GRM
- 6.6
CMA / ARV
- ARV (on-the-fly)
- $708,750
- Comps found
- 2
Show comp detail 2 sales within ~0.75 mi
| Address | Dist | Beds/Ba | Sqft | Sold | Price | $/sf | Match |
|---|---|---|---|---|---|---|---|
| 2249 Bassford Ave | 0.38mi | 5/2.0 (-1) | 1,716 (+9%) | 1mo | $510,000 | $297 | 53 |
| 2461 Belmont Ave | 0.24mi | 6/3.0 | 1,800 (+14%) | 15mo | $810,000 | $450 | 48 |
Match score weights: distance 35% · size 25% · config 20% · recency 20%. Top-matched comps best support the ARV.
Projected returns pro-forma
5.03% appreciation · 8.0% rent growth · sell at horizon
- IRR
- 29.0%
- Equity multiple
- 2.87×
- Total profit
- $254,171
- Equity at exit
- $275,512
- IRR
- 30.1%
- Equity multiple
- 6.53×
- Total profit
- $750,271
- Equity at exit
- $476,097
Cash invested: $135,772 (down + closing). Projections, not guarantees.
Landlord ↔ Tenant lean methodology
- Overall (CITY)
- 0 Strongly Tenant-Friendly
- State New York
- 15 Strongly Tenant-Friendly · D+10
- County
- — inherits STATE
- City New York
- 0 Strongly Tenant-Friendly · D+34
ZIP-level market 10458
- Home prices YoY
- 3.0%
- Rents YoY
- 8.0%
- Active inventory
- 62
- Price-to-rent
- 11.7×
Monthly cashflow live
- Estimated rent
- $6,080 medium interval (Pro) →
- Mortgage (P&I)
- −$2,543
- Tax from tax record
- −$336 /mo · $4,037/yr
- Insurance
- −$202
- HOA
- −$0
- Vacancy / Maint / Mgmt
- −$1,277
- Net cashflow
- $1,722
Break-even live
2-unit breakdown (identical units grouped — click to expand)
| Units | Beds | Baths | Est. rent |
|---|---|---|---|
| 1× unit | 3 | 2 | $3,465 |
| 1× unit | 1 | 1 | $2,616 |
| Total (2 units) | $6,080 | ||
UW: 25.0% down · 7.5% · 30yr · 1.5% tax · 5.0% vac · 8.0% maint · 8.0% mgmt
Financing live
Cash to close
- Down payment
- $121,225
- Closing costs
- $14,547
- Reserves months
- —
- Total cash needed
- —
Loan-product check · same deal, 3 products live
Conventional
25% down · 7.5% · 30yr
- Down + closing
- —
- Monthly P&I
- —
- Monthly cashflow
- —
- DSCR
- —
- Eligible?
- —
Personal DTI + credit; lowest rate.
DSCR
20% down · 8.5% · 30yr
- Down + closing
- —
- Monthly P&I
- —
- Monthly cashflow
- —
- DSCR
- —
- Eligible?
- —
No personal income docs; deal must DSCR.
Hard money
10% down · 12.0% · 12mo
- Down + closing
- —
- Monthly P&I
- —
- Monthly cashflow
- —
- DSCR
- —
- Eligible?
- —
Short-term bridge; refi at stabilization.
Listing history 16 events
-
2026-06-18days on market $484,900 Active 25 DOM
-
2026-06-17days on market $484,900 Active 24 DOM
-
2026-06-16days on market $484,900 Active 23 DOM
-
2026-06-15days on market $484,900 Active 22 DOM
-
2026-06-13days on market $484,900 Active 20 DOM
-
2026-06-10days on market $484,900 Active 16 DOM
-
2026-06-08days on market $484,900 Active 15 DOM
-
2026-06-08days on market $484,900 Active 14 DOM
-
2026-06-04days on market $484,900 Active 11 DOM
-
2026-06-03days on market $484,900 Active 10 DOM
-
2026-06-02days on market $484,900 Active 9 DOM
-
2026-06-01days on market $484,900 Active 8 DOM
-
2026-05-31days on market $484,900 Active 7 DOM
-
2026-05-22$484,500 Active
-
1996-06-10soldstatus $130,500
-
1995-08-23soldstatus $82,500
ⓘ Source: listings_history table (triggers on properties + properties_extension) + one-shot
backfill from property_details.listing_events for pre-trigger history.
Tax reassessment forecast NY · Partial reset (capped growth)
- Current annual tax
- $4,037 · $336/mo
- Projected year-2 tax
- $6,116 · $510/mo
- Expected delta
- +$2,079/yr (+$173/mo · 51.5%)
ⓘ Screening estimate from a state-policy table — verify with the county assessor before closing.
Climate risk First Street
- Flood 1/10 Low FEMA zone X (unshaded) · 0% chance over 30 yrs
- Wildfire 1/10 Low
- Heat 6/10 Major 7 d/yr ≥99°F today · 15 d/yr by 30 yrs out
- Wind 6/10 Major 27% chance of damaging wind over 30 yrs
- Air quality 3/10 Moderate 3 unhealthy d/yr today · 4 by 30 yrs out
Nearby sold comps map
Loading sold comps map…
Walkable amenities ~0.75 mi
Loading nearby amenities…
Taxation est. · year 1
- Rental income
- $72,960
- − Mortgage interest
- −$27,162
- − Property taxes
- −$4,037
- − Insurance
- −$2,424
- − Repairs & maintenance
- −$5,837
- − Management
- −$5,837
- − Depreciation
- −$14,106
- Taxable income
- $13,557
- Est. tax owed @ 24.0%
- −$3,254
- After-tax cash flow
- $17,409/yr
For passive investors: Depreciation is non-cash, so a rental often shows a tax loss while cash-flowing — sheltering income. Rental losses are passive: they offset passive income freely, and up to $25,000/yr can offset ordinary (W-2) income if you actively participate and your MAGI is under $100k (phasing out to $0 by $150k); unused losses carry forward. On sale, claimed depreciation is recaptured at up to 25%, and gains may owe capital-gains tax (a 1031 exchange can defer both). Figures are a year-1 estimate at your 24.0% rate — not tax advice; consult a CPA.
Schools (NCES district)
No district data.
Livability — New York
- Score
- 75/100
- State rank
- #268
- US rank
- #4188
Category grades
Schools grade is shown separately in the Schools card above.
Census & demographics
- Census place
- New York, NY
- County
- Bronx County · 1,197,324 people
- City population
- 7,731,280
- Metro
- New York-Newark-Jersey City, NY-NJ-PA
- Population (ZIP)
- 74,898
- Household income
- $40,800
- Rent vs Own
- Severe rent burden
- 10274.0
Population outlook (Bronx County) Hauer SSP2
- Today (2025)
- 1,607,353 people
- By 2030
- 1,681,852 · +4.6%
- By 2040
- 1,824,421 · +13.5%
- By 2050
- 1,945,470 · +21.0%
- By 2075
- 2,187,887 · +36.1%
- By 2100
- 2,244,136 · +39.6%
Race, ethnicity, and origin ACS 2023
- Neighborhood character
- Predominantly Hispanic (70%)
- Race & ethnicity
- Hispanic / Latino 70% Black 16% Two or more races 10% White 8% Asian 4% Native American 2%
- Hispanic origin (detail)
- Mexican 12% Puerto Rican 15% Dominican 34%
- Foreign-born
- 41% · Canada, Jamaica, South Korea
- Languages at home
- 30% English-only · Spanish 61% Other Indo-European 3% French/Haitian/Cajun 1%
Political lean MEDSL · Bronx
- 2024 margin
- Solid D (+45.4) · D 72.7% · R 27.3%
- 2008→2024 swing
- -32.3pp toward R · 2008: 77.8pp · 2024: 45.4pp
- All cycles
- 2024: D+45.4 2020: D+67.6 2016: D+79.1 2012: D+82.9 2008: D+77.8
Not yet ingested
- Civics
- —
Market trends
- HPI YoY
- ▲ 5.03%
- Current HPI
- 173.4217
- Rent YoY
- ▲ 8.04%
- Metro
- New York-Newark-Jersey City, NY-NJ-PA
- State GDP YoY
- ▲ 2.60%
- F500 in state
- 92
Industry mix (Fortune 500 HQ in NY)
| Industry | F500 HQs | Revenue |
|---|---|---|
| Financial Services | 10 | $950B |
|
||
| Consumer Goods | 9 | $162B |
|
||
| Insurance | 4 | $225B |
|
||
| Telecommunications | 2 | $144B |
|
||
| Pharmaceuticals | 2 | $112B |
|
||
| Media / Entertainment | 2 | $69B |
|
||
Price history
+487.3% since first listed3 events — show timeline
- 2026-05-22 Listed $484,500 OneKey® MLS as Distributed by MLS Grid
- 1996-06-10 Sold (Public Records) $130,500 Public Records
- 1995-08-23 Sold (Public Records) $82,500 Public Records
Property tax history
+5.2%/yrLatest (2025): $4,037 · +5.8% YoY. Source: county tax records.
Cash-flow waterfall
monthlySold comps — $/sqft
last 12 mo · ≤1 miLoading sold comps…