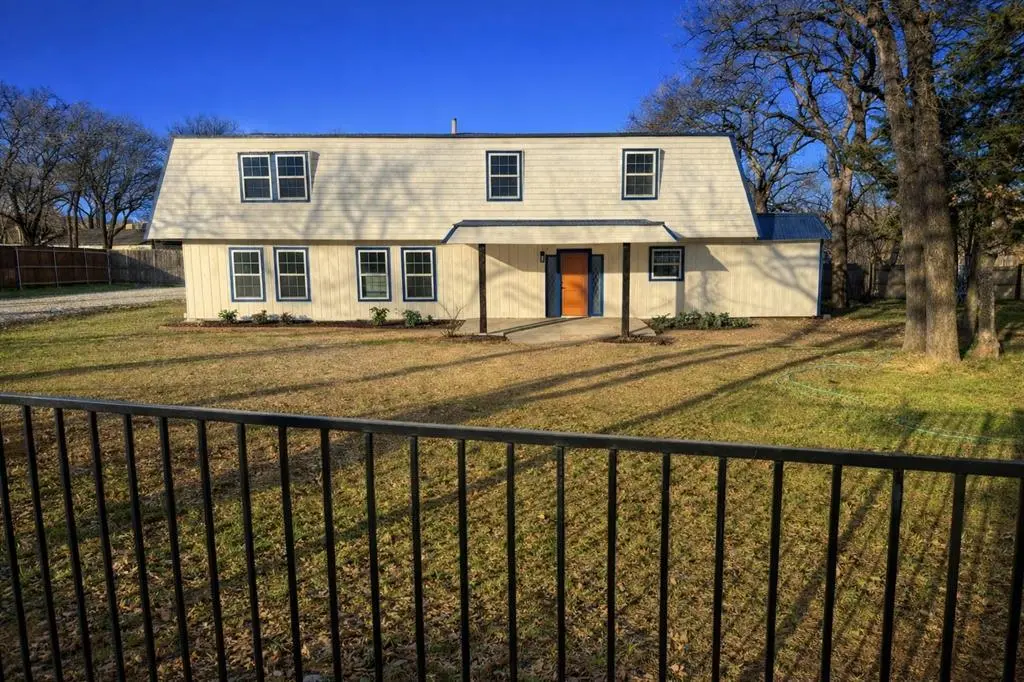
4340 Danny Dr · Kennedale, TX
Flood risk 1/10 · Minimal
- FEMA flood zone
- X (unshaded)
- Chance of flooding over 30 yrs
- 0.0%
- Est. flood insurance / yr
- $507 – $1,088
Fire risk 5/10 · Moderate
- Est. fire insurance / yr
- $1,222 – $2,270
Heat risk 7/10 · Major
- Hot days now (above 109°F)
- 7 days/yr
- Hot days in 30 yrs
- 24 days/yr
Wind risk 6/10 · Moderate
- Chance of severe wind over 30 yrs
- 27.0%
Air-quality risk 3/10 · Minor
- Unhealthy air days now
- 2 days/yr
- Unhealthy air days in 30 yrs
- 3 days/yr
Risk factors via First Street. Map © Google.
Why this score? — see what drove the D grade
The composite is a weighted blend of 9 inputs, each scored 0–100. Each bar is that input's sub-score; the figure is the points it added to the 100-point composite (weight × sub-score).
- ARV discount +15.0/15.0
- Cash flow +7.9/30.0
- Schools +4.6/10.0
- Rent growth +4.0/5.0
- Livability +3.5/5.0
- Condition / age +2.5/5.0
- DSCR +1.9/10.0
- 1% rule +1.5/10.0
- Appreciation +0.0/10.0
$339,000
🖨 Deal sheet 📄 Offer letter ✓ Due diligence
Listing remarks
4340 Danny Dr Kennedale, TX Fully renovated and move-in ready! This spacious 5 bed, 2 bath home offers 3,448 sq ft of modern living—perfect for families or multi-generational space. Features: • Two large living areas + oversized dining with deck access • Multiple decks + private primary suite balcony • Luxury plank flooring, new kitchen, updated baths • New roof, windows, HVAC, appliances, and more -Turn-key with major upgrades already done—just move in and enjoy. VACANT - Schedule your tour today
Key facts
- Updated kitchen
- Private suite
- New roof
Tags
Property features AI
Finance
- Other: Lot approximately 0.7 acres (.5 to < 1 acre); Will not subdivide; Parcel number 04494172
- Financial info: Treat as clear loan type; No second mortgage; Listing terms include Cash, Conventional, FHA
- HOA & community: No homeowners association
Exterior
- Parking: Driveway parking; Gravel parking; Off-street parking
- Security: Smoke detector(s)
- Utilities: City water with individual water meter; City sewer; Electricity available; Cable available
- Home design: Single family residence; Two levels; Residential property; Property is not attached; Subdivision: Hudson
- Construction: Built in 1975 (preowned); Siding exterior; Metal roof; Pillar/post/pier foundation
- Exterior features: Fenced yard with gate (wood and wrought iron); Deck; Grassed vegetation
Interior
- Kitchen: Granite countertops; Built-in cabinets; Dishwasher; Disposal; Refrigerator
- Bedrooms: 5 bedrooms (primary bedroom located on level 2 with a walk-in closet)
- Flooring: Luxury vinyl plank flooring
- Bathrooms: 2 bathrooms
- Heating & cooling: Central heating (electric); Central air conditioning; Ceiling fan(s)
- Interior features: Built-in features; Granite counters; Walk-in closets; Bay window(s)
- Laundry & utility: Full-size washer/dryer area; Washer hookup; Electric dryer hookup; Utility room; Utility room with built-in cabinets, linen closet and second sink
Neighborhood map
What this means for you Summary
Snapshot
- This is a 3-bed/1.0-bath single-family listed at $339k.
Deal economics
- At list price, monthly cash flow is $-368 ($-4k/yr) — negative.
- To cash-flow at today's rent, offer at most $274k (19.2% below list).
- To meet the 1% rule (rent ≥ 1% of price), the offer needs to be $219k (35.3% below list).
- Recommended offer: $219k (35.3% below list) — sets the bar for 1% rule.
- Cap rate 5.0% vs local median 2.9% in Kennedale — top-decile yield for the area; either an underpriced asset or a hidden risk that comps aren't pricing in. Stress-test before assuming the spread holds.
Location & tenants
- Location reads 70/100 on livability (#340 in TX) — a middle-class / working-renter tenant base. Strengths: crime A+, employment A+, cost of living A+; Watch: amenities F, commute F, health & safety F.
- Mansfield ISD (suburban): math 47% / reading 53% proficiency, ranked #125 of 826 in TX (top 15%) — acceptable for families but not a draw, mixed tenant base, ~2y average lease.
- Zoned schools: Nancy Neal El (math 62% / reading 62%, grade B, #321 of 4,322 statewide, top 8%, 416 students, 38% FRL) — zoned schools at 38% FRL track the district average.
- Zoned-school proficiency averages 62% at this address vs 50% district-wide (+12 pts) — the actual schools serving this property are materially stronger than the Mansfield ISD average implies; a family-tenant draw the district grade alone would hide.
- Market conditions: Rents rising fast (+6.0%/yr); 92 active listings in the ZIP; high-income renter base; 18,938 units permitted in Tarrant County in 2024 (8,336 in 5+ unit buildings).
Forward outlook
- Local home prices are declining (-3.0%/yr); year-one equity from $2k of loan paydown is wiped out by about $10k of value loss. Plan a longer hold.
- Tarrant County population projected at +41% by 2050 — long-run rental-demand tailwind backs the buy-and-hold thesis.
Negotiation context
- Only 1 days on market — expect competitive offers; lowballing is unlikely to land.
- 3 sale attempts with the ask held roughly flat each time — persistent listings suggest the price (not the market) is what's stuck; bring a comps-based counter.
Risks & watch-outs
- Climate carrying-cost: major wind risk, 27% chance of damaging wind over 30y; moderate wildfire risk; extreme-heat days projected 7→24/yr by 2055 (HVAC capex compounding) — expect insurance premiums to compound above CPI over the hold.
Questions for the listing agent
- What do current leases actually rent for vs. the listed asking? Can we see a recent rent roll and the last 12 months of T-12 income?
- Built in 1975 — when were the roof, HVAC, electrical panel, plumbing, and water heater last replaced?
- Is there a deadline driving the sale (1031 exchange, divorce, estate, relocation)? That informs how much negotiation room exists.
- The area grade is low — what's the realistic commute time and amenity access for the typical tenant pool here? Any planned neighborhood developments (good or bad) we should know about?
- What's the average days-on-market for RENTAL listings here right now (not sales)? A rising rental-DOM trend means longer vacancies and softer asking-rent achievability than the comps imply.
- What's the recent tenant-quality profile in this submarket — average credit score on applications, eviction rate, late-payment / NSF rate, and stable-employment percentage? A property-management company in the area should have these aggregated.
- How much new for-sale + rental construction is in the pipeline within 1–3 miles? Heavy new supply typically softens prices + rents 12–24 months out; constrained supply supports both.
Investment metrics
- 1% rule
- 0.65% ✗
- Cap rate
- 4.99%
- Cash-on-cash
- -4.65%
- DSCR
- 0.79
- GRM
- 12.9
CMA / ARV
- ARV (median comp)
- $542,492
- List price
- $339,000
- Delta
- -37.51%
- Verdict
- UNDERPRICED
- Comps
- 6 within 1.0 mi
Projected returns pro-forma
-3.0% appreciation · 5.99% rent growth · sell at horizon
- IRR
- -21.3%
- Equity multiple
- 0.24×
- Total profit
- $-71,685
- Equity at exit
- $50,546
- IRR
- -9.8%
- Equity multiple
- 0.33×
- Total profit
- $-63,407
- Equity at exit
- $29,311
Cash invested: $94,920 (down + closing). Projections, not guarantees.
Landlord ↔ Tenant lean methodology
- Overall (STATE)
- 87 Strongly Landlord-Friendly
- State Texas
- 87 Strongly Landlord-Friendly · R+5
- County
- — inherits STATE
- City
- — inherits STATE
ZIP-level market 76060
- Home prices YoY
- -5.1%
- Rents YoY
- 6.0%
- Active inventory
- 92
- Price-to-rent
- 12.9×
Monthly cashflow live
- Estimated rent
- $2,194 medium interval (Pro) →
- Mortgage (P&I)
- −$1,778
- Tax from tax record
- −$182 /mo · $2,184/yr
- Insurance
- −$141
- HOA
- −$0
- Vacancy / Maint / Mgmt
- −$461
- Net cashflow
- $-368
Break-even live
UW: 25.0% down · 7.5% · 30yr · 1.5% tax · 5.0% vac · 8.0% maint · 8.0% mgmt
Financing live
Cash to close
- Down payment
- $84,750
- Closing costs
- $10,170
- Reserves months
- —
- Total cash needed
- —
Loan-product check · same deal, 3 products live
Conventional
25% down · 7.5% · 30yr
- Down + closing
- —
- Monthly P&I
- —
- Monthly cashflow
- —
- DSCR
- —
- Eligible?
- —
Personal DTI + credit; lowest rate.
DSCR
20% down · 8.5% · 30yr
- Down + closing
- —
- Monthly P&I
- —
- Monthly cashflow
- —
- DSCR
- —
- Eligible?
- —
No personal income docs; deal must DSCR.
Hard money
10% down · 12.0% · 12mo
- Down + closing
- —
- Monthly P&I
- —
- Monthly cashflow
- —
- DSCR
- —
- Eligible?
- —
Short-term bridge; refi at stabilization.
Listing history 15 events
-
2026-06-18days on market $339,000 Active 1 DOM
-
2026-06-03days on market $339,000 Active 48 DOM
-
2026-06-02days on market $339,000 Active 47 DOM
-
2026-06-01days on market $339,000 Active 46 DOM
-
2026-05-31days on market $339,000 Active 45 DOM
-
2026-05-09price $339,000 550-char remark
-
2026-04-29price $349,000 550-char remark
-
2026-04-16$364,000 Active 550-char remark
-
2026-04-12historical
-
2026-04-08price $364,000
-
2026-03-25price $389,000
-
2026-03-11price $399,000
-
2026-02-17price $429,000
-
2026-01-13$469,000 Active
-
2025-09-15soldstatus
ⓘ Source: listings_history table (triggers on properties + properties_extension) + one-shot
backfill from property_details.listing_events for pre-trigger history.
Tax reassessment forecast TX · Resets to sale price
- Current annual tax
- $2,184 · $182/mo
- Projected year-2 tax
- $6,204 · $517/mo
- Expected delta
- +$4,020/yr (+$335/mo · 184.1%)
ⓘ Screening estimate from a state-policy table — verify with the county assessor before closing.
Climate risk First Street
- Flood 1/10 Low FEMA zone X (unshaded) · 0% chance over 30 yrs
- Wildfire 5/10 Major
- Heat 7/10 Severe 7 d/yr ≥109°F today · 24 d/yr by 30 yrs out
- Wind 6/10 Major 27% chance of damaging wind over 30 yrs
- Air quality 3/10 Moderate 2 unhealthy d/yr today · 3 by 30 yrs out
Nearby sold comps map
Loading sold comps map…
Walkable amenities ~0.75 mi
Loading nearby amenities…
Taxation est. · year 1
- Rental income
- $26,325
- − Mortgage interest
- −$18,989
- − Property taxes
- −$2,184
- − Insurance
- −$1,695
- − Repairs & maintenance
- −$2,106
- − Management
- −$2,106
- − Depreciation
- −$9,862
- Taxable loss
- −$10,617
- Est. tax savings @ 24.0%
- +$2,548
- After-tax cash flow
- $-1,867/yr
For passive investors: Depreciation is non-cash, so a rental often shows a tax loss while cash-flowing — sheltering income. Rental losses are passive: they offset passive income freely, and up to $25,000/yr can offset ordinary (W-2) income if you actively participate and your MAGI is under $100k (phasing out to $0 by $150k); unused losses carry forward. On sale, claimed depreciation is recaptured at up to 25%, and gains may owe capital-gains tax (a 1031 exchange can defer both). Figures are a year-1 estimate at your 24.0% rate — not tax advice; consult a CPA.
Schools (NCES district)
- District
- Mansfield ISD
- NCES district ID
- 4828920
- Math proficiency
- 47% ▼ -17.00%
- Reading proficiency
- 53% ▼ -6.00%
- Median HH income
- $81,934
- Composite
- 45.82/100
- National rank
- #2558
- State rank
- #125 of 826 in TX
Livability — Kennedale
- Score
- 70/100
- State rank
- #340
- US rank
- #7441
Category grades
Schools grade is shown separately in the Schools card above.
Census & demographics
- Census place
- Kennedale, TX
- County
- Tarrant County · 2,033,669 people
- City population
- 9,444
- Metro
- Dallas-Fort Worth-Arlington, TX
- Population (ZIP)
- 9,444
- Household income
- $119,156
- Rent vs Own
- Severe rent burden
- 244.0
Population outlook (Tarrant County) Hauer SSP2
- Today (2025)
- 2,380,417 people
- By 2030
- 2,578,900 · +8.3%
- By 2040
- 2,974,995 · +25.0%
- By 2050
- 3,350,489 · +40.8%
- By 2075
- 4,216,909 · +77.2%
- By 2100
- 4,741,527 · +99.2%
Race, ethnicity, and origin ACS 2023
- Neighborhood character
- Diverse neighborhood (Simpson 0.61)
- Race & ethnicity
- White 57% Black 19% Hispanic / Latino 16% Two or more races 9% Asian 4%
- Hispanic origin (detail)
- Mexican 13%
- Common ancestry
- Lithuanian 5% Slovak 2% Subsaharan African 1%
- Foreign-born
- 9% · Canada, Vietnam, Guatemala
- Languages at home
- 83% English-only · Spanish 11% Vietnamese 2% Other Indo-European 2%
Political lean MEDSL · Tarrant
- 2024 margin
- Lean R (+5.1) · D 46.7% · R 51.9% · Other 1.4%
- 2008→2024 swing
- +6.6pp toward D · 2008: -11.7pp · 2024: -5.1pp
- All cycles
- 2024: R+5.1 2020: D+0.2 2016: R+8.7 2012: R+15.7 2008: R+11.7
Not yet ingested
- Civics
- —
Market trends
- HPI YoY
- ▼ -14.02%
- Current HPI
- 261.8007
- Rent YoY
- ▲ 5.99%
- Metro
- Dallas-Fort Worth-Arlington, TX
- State GDP YoY
- ▲ 3.95%
- F500 in state
- 110
Industry mix (Fortune 500 HQ in TX)
| Industry | F500 HQs | Revenue |
|---|---|---|
| Energy | 16 | $1,198B |
|
||
| Technology | 5 | $198B |
|
||
| Engineering / Construction | 4 | $72B |
|
||
| Energy Services | 3 | $60B |
|
||
| Utilities | 3 | $41B |
|
||
| Healthcare | 2 | $330B |
|
||
Price history
-27.7% since first listed12 events — show timeline
- 2026-06-18 Listed $339,000 NTREIS
- 2026-06-03 Listing Removed — NTREIS
- 2026-05-09 Price Changed $339,000 NTREIS
- 2026-04-29 Price Changed $349,000 NTREIS
- 2026-04-16 Listed $364,000 NTREIS
- 2026-04-12 Listing Removed — NTREIS
- 2026-04-08 Price Changed $364,000 NTREIS
- 2026-03-25 Price Changed $389,000 NTREIS
- 2026-03-11 Price Changed $399,000 NTREIS
- 2026-02-17 Price Changed $429,000 NTREIS
- 2026-01-13 Listed $469,000 NTREIS
- 2025-09-15 Sold (Public Records) — Public Records
Property tax history
+5.0%/yrLatest (2025): $2,184 · +8.6% YoY. Source: county tax records.
Cash-flow waterfall
monthlySold comps — $/sqft
last 12 mo · ≤1 miLoading sold comps…