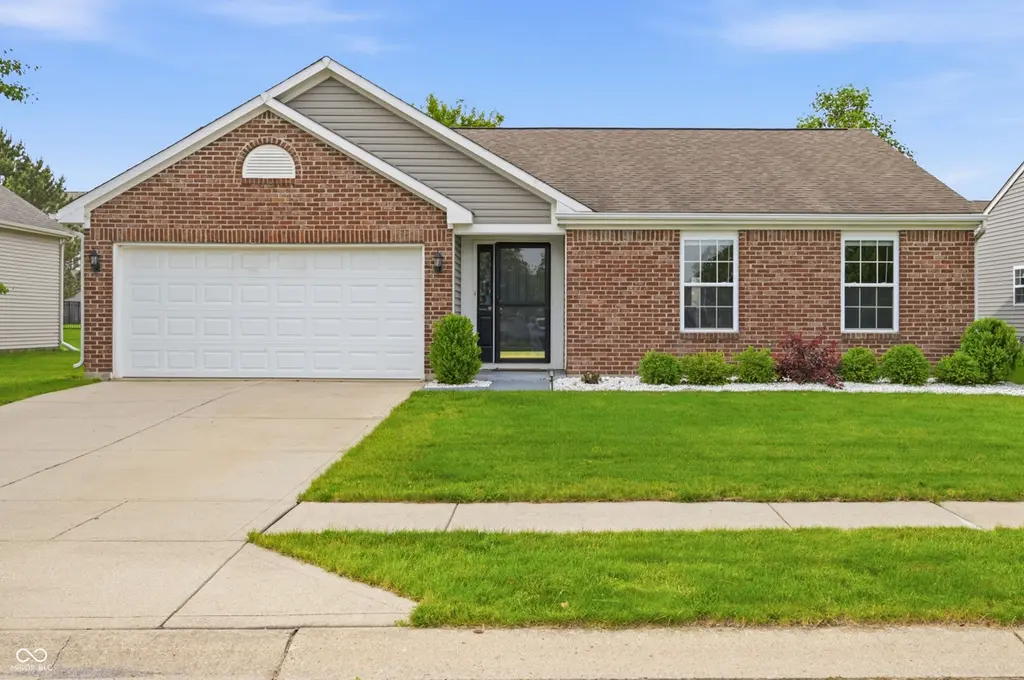
6815 W Odessa Way · McCordsville, IN
Flood risk 1/10 · Minimal
- FEMA flood zone
- X (unshaded)
- Chance of flooding over 30 yrs
- 0.0%
- Est. flood insurance / yr
- $507 – $1,088
Fire risk 1/10 · Minimal
- Est. fire insurance / yr
- $717 – $1,331
Heat risk 3/10 · Minor
- Hot days now (above 100°F)
- 7 days/yr
- Hot days in 30 yrs
- 18 days/yr
Wind risk 2/10 · Minimal
- Chance of severe wind over 30 yrs
- 1.0%
Air-quality risk 2/10 · Minimal
- Unhealthy air days now
- 1 days/yr
- Unhealthy air days in 30 yrs
- 2 days/yr
Risk factors via First Street. Map © Google.
Why this score? — see what drove the B- grade
The composite is a weighted blend of 9 inputs, each scored 0–100. Each bar is that input's sub-score; the figure is the points it added to the 100-point composite (weight × sub-score).
- Cash flow +26.4/30.0
- ARV discount +13.9/15.0
- DSCR +9.0/10.0
- 1% rule +6.5/10.0
- Schools +4.1/10.0
- Rent growth +3.8/5.0
- Livability +3.5/5.0
- Condition / age +2.5/5.0
- Appreciation +0.0/10.0
$209,000
🖨 Deal sheet (PDF) 📄 Offer letter ✓ Due diligence
Listing remarks MLS
Located in desirable Austin Trace, this 3-bedroom, 2-bath ranch offers a fantastic investment opportunity with tons of potential. Featuring a new roof and siding, the major exterior updates are already complete, giving you a solid head start on your next project. With good bones and a functional layout, this home just needs a few quick and easy cosmetic updates to really shine. Whether you're looking for a rental property, flip, or affordable home to make your own, this property is priced to sell and full of possibilities.
Key facts
- New siding
- Functional layout
- New roof
Tags
Property features AI
Exterior
- Parking: Attached garage (1 car)
- Utilities: Municipal sewer connected; Public and private water sources
- Home design: Single-family residence; One story; Home faces north
- Construction: Brick and vinyl siding exterior; Slab foundation
- Exterior features: Lot under 1/4 acre (approximately 0.17 acre)
Interior
- Kitchen: Refrigerator; Dishwasher; Range hood; Water heater
- Bedrooms: 3 bedrooms on the main level; Primary bedroom with walk-in closet
- Bathrooms: 2 full bathrooms; Primary bathroom suite with tub and shower
- Heating & cooling: Forced air heating; Central air conditioning
- Interior features: Eat-in kitchen; Walk-in closet(s); Smoke detector(s)
- Laundry & utility: Utility room on main level (7 x 6)
Neighborhood map
What this means for you Summary
Snapshot
- This is a 3-bed/2.0-bath single-family listed at $209k.
Deal economics
- At list price, monthly cash flow is $544 ($7k/yr) — positive.
- The deal already cash-flows at list — no discount required.
- Meets the 1% rule at list price ($2k rent vs $209k).
- Recommended offer: $206k (1.5% below list) — sets the bar for market timing.
- Cap rate 9.4% vs local median 3.9% in McCordsville — top-decile yield for the area; either an underpriced asset or a hidden risk that comps aren't pricing in. Stress-test before assuming the spread holds.
Location & tenants
- Location reads 69/100 on livability (#181 in IN) — a middle-class / working-renter tenant base. Strengths: employment A+, cost of living A+, housing A+; Watch: amenities F, commute F, health & safety F.
- Mt Vernon Community School Corporation (rural): math 43% / reading 48% proficiency, ranked #70 of 301 in IN (top 23%) — families likely to look elsewhere, expect single-tenant / working-renter base with shorter leases; only 18% free/reduced lunch — higher-income household profile.
- Zoned schools: Mt Vernon High School (math 41% / reading 71%, grade C, #73 of 369 statewide, top 20%, 1,431 students, 27% FRL).
- Market conditions: Rents rising fast (+5.2%/yr); 422 active listings in the ZIP; 5 comparable units currently listed for rent nearby; rentals leasing fast (median 4d on market — plan ~1-2 weeks tenant-placement turnaround); high-income renter base; 1,091 units permitted in Hancock County in 2024 (0 in 5+ unit buildings).
Forward outlook
- Local home prices are declining (-3.0%/yr); year-one equity from $1k of loan paydown is wiped out by about $6k of value loss. Plan a longer hold.
- Hancock County population projected at +7% by 2050 — modest demand growth; plan on rents tracking national, not racing it.
- At projected returns (-3.0% appreciation + 5.2% rent growth), your $59k cash investment doubles in ~9 years — after that, you're playing with house money.
Negotiation context
- It's been on market 19 days — a 2% lower offer ($206k) is reasonable based on typical stale-listing flexibility.
- 2 sale attempts with the ask held roughly flat each time — persistent listings suggest the price (not the market) is what's stuck; bring a comps-based counter.
Questions for the listing agent
- Is there a deadline driving the sale (1031 exchange, divorce, estate, relocation)? That informs how much negotiation room exists.
- Schools are B-rated — typically a magnet for longer-tenancy family renters. What's the average tenant stay here, and is there a school-zone premium baked into asking?
- What's the average days-on-market for RENTAL listings here right now (not sales)? A rising rental-DOM trend means longer vacancies and softer asking-rent achievability than the comps imply.
- What's the recent tenant-quality profile in this submarket — average credit score on applications, eviction rate, late-payment / NSF rate, and stable-employment percentage? A property-management company in the area should have these aggregated.
- How much new for-sale + rental construction is in the pipeline within 1–3 miles? Heavy new supply typically softens prices + rents 12–24 months out; constrained supply supports both.
Investment metrics
- 1% rule
- 1.15% ✓
- Cap rate
- 9.41%
- Cash-on-cash
- 11.15%
- DSCR
- 1.50
- GRM
- 7.3
CMA / ARV
- ARV (on-the-fly)
- $243,555
- Comps found
- 7
Show comp detail 7 sales within ~0.75 mi
| Address | Dist | Beds/Ba | Sqft | Sold | Price | $/sf | Match |
|---|---|---|---|---|---|---|---|
| 6815 W Odessa Way | 0.00mi | 3/2.0 | 1,249 (0%) | 0mo | $205,000 | $164 | 100 |
| 6884 N Laredo Dr | 0.16mi | 3/2.0 | 1,272 (+2%) | 3mo | $283,900 | $223 | 87 |
| 6899 N Karnes Dr | 0.15mi | 3/2.0 | 1,245 (-0%) | 8mo | $270,000 | $217 | 85 |
| 6847 W Odessa Way | 0.06mi | 3/2.0 | 1,358 (+9%) | 7mo | $265,000 | $195 | 77 |
| 6915 Laredo Dr | 0.20mi | 3/2.0 | 1,275 (+2%) | 16mo | $277,500 | $218 | 74 |
| 6605 W Odessa Way | 0.24mi | 3/2.0 | 1,370 (+10%) | 1mo | $259,700 | $190 | 72 |
| 6963 N Abilene Way | 0.37mi | 3/2.0 | 1,390 (+11%) | 12mo | $265,000 | $191 | 54 |
Match score weights: distance 35% · size 25% · config 20% · recency 20%. Top-matched comps best support the ARV.
Projected returns pro-forma
-3.0% appreciation · 5.18% rent growth · sell at horizon
- IRR
- 2.7%
- Equity multiple
- 1.10×
- Total profit
- $6,123
- Equity at exit
- $31,163
- IRR
- 14.1%
- Equity multiple
- 2.25×
- Total profit
- $72,923
- Equity at exit
- $18,071
Cash invested: $58,520 (down + closing). Projections, not guarantees.
Landlord ↔ Tenant lean methodology
- Overall (STATE)
- 90 Strongly Landlord-Friendly
- State Indiana
- 90 Strongly Landlord-Friendly · R+11
- County
- — inherits STATE
- City
- — inherits STATE
ZIP-level market 46055
- Home prices YoY
- -20.1%
- Rents YoY
- 5.2%
- Active inventory
- 422
- Price-to-rent
- 7.3×
Monthly cashflow live
- Estimated rent
- $2,400 high interval (Pro) →
- Mortgage (P&I)
- −$1,096
- Tax from tax record
- −$169 /mo · $2,031/yr
- Insurance
- −$87
- HOA
- −$0
- Vacancy / Maint / Mgmt
- −$504
- Net cashflow
- $544
Break-even live
Sensitivity live
| Price | -10% $662 | -5% $603 | +0% $544 | +5% $485 | +10% $425 |
|---|---|---|---|---|---|
| Rent | -10% $354 | -5% $449 | +0% $544 | +5% $639 | +10% $733 |
| Rate | -1.0pp $649 | -0.5pp $597 | base $544 | +0.5pp $490 | +1.0pp $434 |
UW: 25.0% down · 7.5% · 30yr · 1.5% tax · 5.0% vac · 8.0% maint · 8.0% mgmt
Financing live
Cash to close
- Down payment
- $52,250
- Closing costs
- $6,270
- Reserves months
- —
- Total cash needed
- —
Loan-product check · same deal, 3 products live
Conventional
25% down · 7.5% · 30yr
- Down + closing
- —
- Monthly P&I
- —
- Monthly cashflow
- —
- DSCR
- —
- Eligible?
- —
Personal DTI + credit; lowest rate.
DSCR
20% down · 8.5% · 30yr
- Down + closing
- —
- Monthly P&I
- —
- Monthly cashflow
- —
- DSCR
- —
- Eligible?
- —
No personal income docs; deal must DSCR.
Hard money
10% down · 12.0% · 12mo
- Down + closing
- —
- Monthly P&I
- —
- Monthly cashflow
- —
- DSCR
- —
- Eligible?
- —
Short-term bridge; refi at stabilization.
Rent comps 5 comps
| Address | Beds | Baths | Sqft | Rent | $/sqft | DOM | Units | Dist |
|---|---|---|---|---|---|---|---|---|
| 7357 N Gateway Crossing Blvd McCordsville, IN | 1.0–2.0 | 1.0–1.5 | 882 | $1,830 | $2.07 | 24d | 4 | 0.64mi |
| 7298 N Kensington Way Unit 6311-213 McCordsville, IN | 2.0 | 2.0 | 1109 | $2,050 | $1.85 | 2d | 1 | 0.71mi |
| N Kensington Way McCordsville, IN | 1.0–2.0 | 1.0–2.0 | 968 | $2,375 | $2.45 | 21d | 6 | 0.83mi |
| 5871 Broadacre Dr McCordsville, IN | 1.0–3.0 | 1.0–2.0 | 978 | $2,285 | $2.34 | 3d | 150 | 1.19mi |
| 5811 Main St McCordsville, IN | 1.0–2.0 | 1.0–2.0 | 926 | $2,140 | $2.31 | 2d | 14 | 1.33mi |
Listing history 6 events
-
2026-06-16days on market $209,000 Active 19 DOM
-
2026-06-15days on market $209,000 Active 18 DOM
-
2026-06-13days on market $209,000 Active 16 DOM
-
2026-06-13statusdays on market $209,000 Active 15 DOM
-
2026-05-28$209,000 Active
Show marketing remark (528 chars)
Located in desirable Austin Trace, this 3-bedroom, 2-bath ranch offers a fantastic investment opportunity with tons of potential. Featuring a new roof and siding, the major exterior updates are already complete, giving you a solid head start on your next project. With good bones and a functional layout, this home just needs a few quick and easy cosmetic updates to really shine. Whether you're looking for a rental property, flip, or affordable home to make your own, this property is priced to sell and full of possibilities.
-
2026-05-28$209,000 Active 528-char remark
Show marketing remark (528 chars)
Located in desirable Austin Trace, this 3-bedroom, 2-bath ranch offers a fantastic investment opportunity with tons of potential. Featuring a new roof and siding, the major exterior updates are already complete, giving you a solid head start on your next project. With good bones and a functional layout, this home just needs a few quick and easy cosmetic updates to really shine. Whether you're looking for a rental property, flip, or affordable home to make your own, this property is priced to sell and full of possibilities.
ⓘ Source: listings_history table (triggers on properties + properties_extension) + one-shot
backfill from property_details.listing_events for pre-trigger history.
Tax reassessment forecast IN · Partial reset (capped growth)
- Current annual tax
- $2,031 · $169/mo
- Projected year-2 tax
- $2,031 · $169/mo
- Expected delta
- $0/yr ($0/mo · 0.0%)
ⓘ Screening estimate from a state-policy table — verify with the county assessor before closing.
Climate risk First Street
- Flood 1/10 Low FEMA zone X (unshaded) · 0% chance over 30 yrs
- Wildfire 1/10 Low
- Heat 3/10 Moderate 7 d/yr ≥100°F today · 18 d/yr by 30 yrs out
- Wind 2/10 Low 100% chance of damaging wind over 30 yrs
- Air quality 2/10 Low 1 unhealthy d/yr today · 2 by 30 yrs out
Nearby sold comps map
Loading sold comps map…
Walkable amenities ~0.75 mi
Loading nearby amenities…
Taxation est. · year 1
- Rental income
- $28,802
- − Mortgage interest
- −$11,707
- − Property taxes
- −$2,031
- − Insurance
- −$1,045
- − Repairs & maintenance
- −$2,304
- − Management
- −$2,304
- − Depreciation
- −$6,080
- Taxable income
- $3,330
- Est. tax owed @ 24.0%
- −$799
- After-tax cash flow
- $5,726/yr
For passive investors: Depreciation is non-cash, so a rental often shows a tax loss while cash-flowing — sheltering income. Rental losses are passive: they offset passive income freely, and up to $25,000/yr can offset ordinary (W-2) income if you actively participate and your MAGI is under $100k (phasing out to $0 by $150k); unused losses carry forward. On sale, claimed depreciation is recaptured at up to 25%, and gains may owe capital-gains tax (a 1031 exchange can defer both). Figures are a year-1 estimate at your 24.0% rate — not tax advice; consult a CPA.
Schools (NCES district)
- District
- Mt Vernon Community School Corporation
- NCES district ID
- 1807260
- Math proficiency
- 43% ▼ -12.00%
- Reading proficiency
- 48% ▼ -7.00%
- Median HH income
- $73,671
- Composite
- 41.3/100
- National rank
- #3514
- State rank
- #70 of 301 in IN
Livability — McCordsville
- Score
- 69/100
- State rank
- #181
- US rank
- #8388
Category grades
Schools grade is shown separately in the Schools card above.
Census & demographics
- Census place
- McCordsville, IN
- County
- Hancock County · 59,521 people
- City population
- 16,010
- Metro
- Indianapolis-Carmel-Anderson, IN
- Population (ZIP)
- 16,010
- Household income
- $113,784
- Rent vs Own
- Severe rent burden
- 58.0
Population outlook (Hancock County) Hauer SSP2
- Today (2025)
- 77,820 people
- By 2030
- 79,914 · +2.7%
- By 2040
- 82,734 · +6.3%
- By 2050
- 83,348 · +7.1%
- By 2075
- 82,439 · +5.9%
- By 2100
- 74,181 · -4.7%
Race, ethnicity, and origin ACS 2023
- Neighborhood character
- Predominantly White (77%)
- Race & ethnicity
- White 77% Black 13% Two or more races 6% Hispanic / Latino 4% Asian 1%
- Common ancestry
- Lithuanian 3% Italian 3% Romanian 3%
- Foreign-born
- 4% · Canada, Vietnam, Jamaica
- Languages at home
- 94% English-only · Spanish 4%
Political lean MEDSL · Hancock
- 2024 margin
- Solid R (+33.7) · D 32.2% · R 65.9% · Other 1.9%
- 2008→2024 swing
- -4.1pp toward R · 2008: -29.6pp · 2024: -33.7pp
- All cycles
- 2024: R+33.7 2020: R+37.5 2016: R+44.8 2012: R+41.0 2008: R+29.6
Not yet ingested
- Civics
- —
Market trends
- HPI YoY
- ▼ -52.35%
- Current HPI
- 207.9764
- Rent YoY
- ▲ 5.18%
- Metro
- Indianapolis-Carmel-Anderson, IN
- State GDP YoY
- ▲ 2.90%
- F500 in state
- 18
Industry mix (Fortune 500 HQ in IN)
| Industry | F500 HQs | Revenue |
|---|---|---|
| Industrial Machinery | 2 | $37B |
|
||
| Healthcare | 1 | $177B |
|
||
| Pharmaceuticals | 1 | $45B |
|
||
| Metals / Steel | 1 | $18B |
|
||
| Agriculture | 1 | $17B |
|
||
| Packaging | 1 | $12B |
|
||
Price history
+0.0% since first listed2 events — show timeline
- 2026-05-28 Listed $209,000 IRMLS
- 2026-05-28 Listed $209,000 MIBOR as Distributed by MLS Grid
Property tax history
+6.7%/yrLatest (2025): $2,031 · -8.7% YoY. Source: county tax records.
Cash-flow waterfall
monthlySold comps — $/sqft
last 12 mo · ≤1 miLoading sold comps…