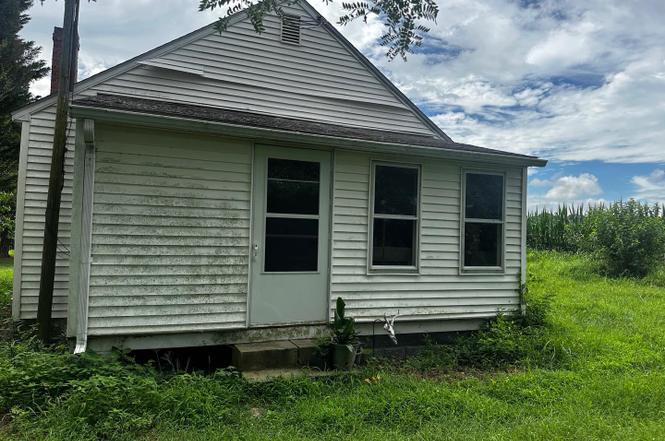
1500 Roe Ingleside Rd · Barclay, MD
Flood risk 7/10 · Major
- FEMA flood zone
- X (unshaded)
- Chance of flooding over 30 yrs
- 0.99%
- Est. flood insurance / yr
- $507 – $1,088
Fire risk 2/10 · Minimal
- Est. fire insurance / yr
- $755 – $1,403
Heat risk 8/10 · Major
- Hot days now (above 104°F)
- 7 days/yr
- Hot days in 30 yrs
- 15 days/yr
Wind risk 6/10 · Moderate
- Chance of severe wind over 30 yrs
- 27.0%
Air-quality risk 3/10 · Minor
- Unhealthy air days now
- 2 days/yr
- Unhealthy air days in 30 yrs
- 3 days/yr
Risk factors via First Street. Map © Google.
Why this score? — see what drove the B+ grade
The composite is a weighted blend of 9 inputs, each scored 0–100. Each bar is that input's sub-score; the figure is the points it added to the 100-point composite (weight × sub-score).
- Cash flow +30.0/30.0
- ARV discount +10.4/15.0
- 1% rule +10.0/10.0
- DSCR +10.0/10.0
- Appreciation +5.0/10.0
- Schools +3.0/10.0
- Rent growth +2.5/5.0
- Livability +2.5/5.0
- Condition / age +2.5/5.0
$70,000
🖨 Deal sheet 📄 Offer letter ✓ Due diligence
Listing remarks
Investor, special, major rehab, Has enclosed front porch and enclosed back porch.
Key facts
- 9,800 sq ft lot
- 2 parking spots
- Built 1955
Property features AI
Finance
- Other: Improvement and land assessed values on file
- Financial info: Fee simple ownership
Exterior
- Parking: Driveway parking (2 spaces); 2 total garage/parking spaces
- Utilities: Private water; Private septic tank
- Home design: Detached property; Major rehab needed
- Construction: Built with block and stick-built construction; Block and wood foundation; Shingle roof; Building not winterized; Approximate above-grade finished area 720 (assessor)
- Exterior features: Not in a federal flood zone; Tidal water: no; Pets allowed with no restrictions; Other structures both above and below grade
Interior
- Bedrooms: 2 bedrooms on the main level
- Bathrooms: 1 full bathroom on the main level
- Heating & cooling: Oil heating; Electric hot water
- Interior features: No basement; Living area per assessor
Neighborhood map
What this means for you Summary
Snapshot
- This is a 2-bed/1.0-bath single-family listed at $70k.
Deal economics
- At list price, monthly cash flow is $380 ($5k/yr) — positive.
- The deal already cash-flows at list — no discount required.
- Meets the 1% rule at list price ($1k rent vs $70k).
Location & tenants
- Location reads 50/100 on livability (#455 in MD) — a working-class tenant base; expect higher turnover. Strengths: housing A+, crime A, cost of living B; Watch: schools F, amenities F, commute F.
- Queen Anne'S County Public Schools (rural): math 22% / reading 39% proficiency, ranked #7 of 24 in MD (top 29%) — families likely to look elsewhere, expect single-tenant / working-renter base with shorter leases.
- Market conditions: 2 active listings in the ZIP; 320 units permitted in Queen Anne's County in 2024 (56 in 5+ unit buildings).
Forward outlook
- In year one you build about $3k of equity ($484 loan paydown + $2k appreciation (3.0% local appreciation)).
- At projected returns (3.0% appreciation + 3.0% rent growth), your $20k cash investment doubles in ~3 years — after that, you're playing with house money.
Negotiation context
- Only 7 days on market — expect competitive offers; lowballing is unlikely to land.
- 2 sale attempts with the ask held roughly flat each time — persistent listings suggest the price (not the market) is what's stuck; bring a comps-based counter.
Risks & watch-outs
- Watch-outs: flood insurance adds $66/mo; built in 1955 — expect roof / HVAC / electrical / plumbing capex.
- Climate carrying-cost: major flood risk; major wind risk, 27% chance of damaging wind over 30y; extreme-heat days projected 7→15/yr by 2055 (HVAC capex compounding) — expect insurance premiums to compound above CPI over the hold.
Questions for the listing agent
- Built in 1955 — when were the roof, HVAC, electrical panel, plumbing, and water heater last replaced?
- What's the actual annual flood-insurance premium (NFIP or private), and is the property in a SFHA with mandatory coverage?
- Is there a deadline driving the sale (1031 exchange, divorce, estate, relocation)? That informs how much negotiation room exists.
- Schools are F-rated, which usually means shorter tenancies and higher turnover. Who's the typical renter profile here, and what's been the actual vacancy rate?
- What's the average days-on-market for RENTAL listings here right now (not sales)? A rising rental-DOM trend means longer vacancies and softer asking-rent achievability than the comps imply.
- What's the recent tenant-quality profile in this submarket — average credit score on applications, eviction rate, late-payment / NSF rate, and stable-employment percentage? A property-management company in the area should have these aggregated.
- How much new for-sale + rental construction is in the pipeline within 1–3 miles? Heavy new supply typically softens prices + rents 12–24 months out; constrained supply supports both.
Investment metrics
- 1% rule
- 1.68% ✓
- Cap rate
- 13.94%
- Cash-on-cash
- 27.31%
- DSCR
- 2.22
- GRM
- 5.0
CMA / ARV
- ARV (on-the-fly)
- $74,880
- Comps found
- 1
Show comp detail 1 sale within ~0.75 mi
| Address | Dist | Beds/Ba | Sqft | Sold | Price | $/sf | Match |
|---|---|---|---|---|---|---|---|
| 1500 Roe Ingleside Rd | 0.00mi | 2/1.0 | 720 (0%) | 0mo | $75,000 | $104 | 100 |
Match score weights: distance 35% · size 25% · config 20% · recency 20%. Top-matched comps best support the ARV.
Projected returns pro-forma
3.0% appreciation · 3.0% rent growth · sell at horizon
- IRR
- 29.4%
- Equity multiple
- 2.67×
- Total profit
- $32,669
- Equity at exit
- $31,475
- IRR
- 29.9%
- Equity multiple
- 5.21×
- Total profit
- $82,506
- Equity at exit
- $48,507
Cash invested: $19,600 (down + closing). Projections, not guarantees.
Landlord ↔ Tenant lean methodology
- Overall (STATE)
- 27 Tenant-Leaning
- State Maryland
- 27 Tenant-Leaning · D+14
- County
- — inherits STATE
- City
- — inherits STATE
ZIP-level market 21644
- Active inventory
- 2
- Price-to-rent
- 5.0×
Monthly cashflow live
- Estimated rent
- $1,177 medium interval (Pro) →
- Mortgage (P&I)
- −$367
- Tax est. 1.5%
- −$88 /mo · $1,050/yr
- Insurance
- −$29
- Flood insurance flood zone
- −$66 /mo · $798/yr
- HOA
- −$0
- Vacancy / Maint / Mgmt
- −$247
- Net cashflow
- $380
Break-even live
UW: 25.0% down · 7.5% · 30yr · 1.5% tax · 5.0% vac · 8.0% maint · 8.0% mgmt
Financing live
Cash to close
- Down payment
- $17,500
- Closing costs
- $2,100
- Reserves months
- —
- Total cash needed
- —
Loan-product check · same deal, 3 products live
Conventional
25% down · 7.5% · 30yr
- Down + closing
- —
- Monthly P&I
- —
- Monthly cashflow
- —
- DSCR
- —
- Eligible?
- —
Personal DTI + credit; lowest rate.
DSCR
20% down · 8.5% · 30yr
- Down + closing
- —
- Monthly P&I
- —
- Monthly cashflow
- —
- DSCR
- —
- Eligible?
- —
No personal income docs; deal must DSCR.
Hard money
10% down · 12.0% · 12mo
- Down + closing
- —
- Monthly P&I
- —
- Monthly cashflow
- —
- DSCR
- —
- Eligible?
- —
Short-term bridge; refi at stabilization.
Listing history 6 events
-
2026-05-23status Pending
-
2026-05-23historical
-
2026-05-19status Active
-
2025-07-13historical
-
2025-07-11$70,000 Active
-
2025-07-08historical $70,000
ⓘ Source: listings_history table (triggers on properties + properties_extension) + one-shot
backfill from property_details.listing_events for pre-trigger history.
Climate risk First Street
- Flood 7/10 Severe FEMA zone X (unshaded) · 99% chance over 30 yrs
- Wildfire 2/10 Low
- Heat 8/10 Severe 7 d/yr ≥104°F today · 15 d/yr by 30 yrs out
- Wind 6/10 Major 27% chance of damaging wind over 30 yrs
- Air quality 3/10 Moderate 2 unhealthy d/yr today · 3 by 30 yrs out
Nearby sold comps map
Loading sold comps map…
Walkable amenities ~0.75 mi
Loading nearby amenities…
Taxation est. · year 1
- Rental income
- $14,124
- − Mortgage interest
- −$3,921
- − Property taxes
- −$1,050
- − Insurance
- −$1,148
- − Repairs & maintenance
- −$1,130
- − Management
- −$1,130
- − Depreciation
- −$2,036
- Taxable income
- $3,709
- Est. tax owed @ 24.0%
- −$890
- After-tax cash flow
- $3,665/yr
For passive investors: Depreciation is non-cash, so a rental often shows a tax loss while cash-flowing — sheltering income. Rental losses are passive: they offset passive income freely, and up to $25,000/yr can offset ordinary (W-2) income if you actively participate and your MAGI is under $100k (phasing out to $0 by $150k); unused losses carry forward. On sale, claimed depreciation is recaptured at up to 25%, and gains may owe capital-gains tax (a 1031 exchange can defer both). Figures are a year-1 estimate at your 24.0% rate — not tax advice; consult a CPA.
Schools (NCES district)
- District
- Queen Anne'S County Public Schools
- NCES district ID
- 2400540
- Math proficiency
- 22% ▼ -30.00%
- Reading proficiency
- 39% ▼ -22.00%
- Median HH income
- $84,577
- Composite
- 29.86/100
- National rank
- #6406
- State rank
- #7 of 24 in MD
Livability — Barclay
- Score
- 50/100
- State rank
- #455
- US rank
- #25674
Category grades
Schools grade is shown separately in the Schools card above.
Census & demographics
- Population (ZIP)
- 82
Population outlook (Queen Anne's County) Hauer SSP2
- Today (2025)
- 51,149 people
- By 2030
- 51,979 · +1.6%
- By 2040
- 52,728 · +3.1%
- By 2050
- 51,828 · +1.3%
- By 2075
- 50,169 · -1.9%
- By 2100
- 44,442 · -13.1%
Race, ethnicity, and origin ACS 2023
- Neighborhood character
- Predominantly White (100%)
- Race & ethnicity
- White 100%
Political lean MEDSL · Queen Anne's
- 2024 margin
- Strong R (+27.8) · D 35.1% · R 62.9% · Other 2.1%
- 2008→2024 swing
- -0.7pp no change · 2008: -27.1pp · 2024: -27.8pp
- All cycles
- 2024: R+27.8 2020: R+26.5 2016: R+36.1 2012: R+30.1 2008: R+27.1
Not yet ingested
- Civics
- —
Market trends
- HPI YoY
- —
- Current HPI
- —
- Rent YoY
- —
- Metro
- —
- State GDP YoY
- ▲ 2.97%
- F500 in state
- 12
Industry mix (Fortune 500 HQ in MD)
| Industry | F500 HQs | Revenue |
|---|---|---|
| Aerospace / Defense | 1 | $71B |
|
||
| Utilities | 1 | $25B |
|
||
| Hotels | 1 | $24B |
|
||
| Consumer Goods | 1 | $7B |
|
||
| Real Estate | 1 | $6B |
|
||
| Chemicals | 1 | $2B |
|
||
Price history
+0.0% since first listed6 events — show timeline
- 2026-05-23 Pending — BRIGHT MLS
- 2026-05-23 Listing Removed — BRIGHT MLS
- 2026-05-19 Relisted — BRIGHT MLS
- 2025-07-13 Listing Removed — BRIGHT MLS
- 2025-07-11 Listed $70,000 BRIGHT MLS
- 2025-07-08 Coming Soon $70,000 BRIGHT MLS
Cash-flow waterfall
monthlySold comps — $/sqft
last 12 mo · ≤1 miLoading sold comps…