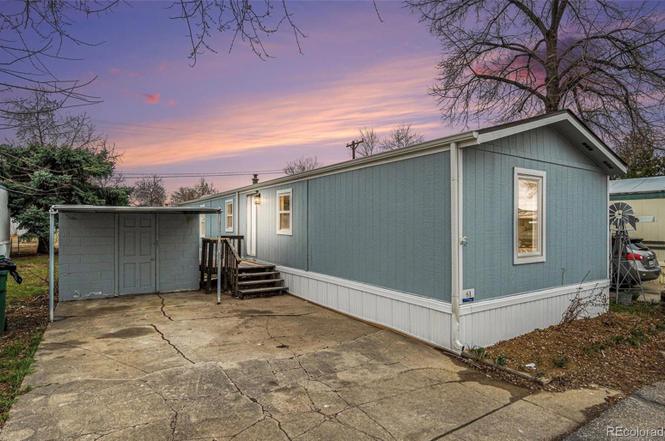
4105 N Garfield Ave · Loveland, CO
Flood risk 1/10 · Minimal
- FEMA flood zone
- X (unshaded)
- Chance of flooding over 30 yrs
- 0.0%
- Est. flood insurance / yr
- $507 – $1,088
Fire risk 7/10 · Major
- Est. fire insurance / yr
- $939 – $1,743
Heat risk 3/10 · Minor
- Hot days now (above 92°F)
- 7 days/yr
- Hot days in 30 yrs
- 17 days/yr
Wind risk 1/10 · Minimal
- Chance of severe wind over 30 yrs
- —
Air-quality risk 4/10 · Minor
- Unhealthy air days now
- 6 days/yr
- Unhealthy air days in 30 yrs
- 8 days/yr
Risk factors via First Street. Map © Google.
Why this score? — see what drove the B grade
The composite is a weighted blend of 9 inputs, each scored 0–100. Each bar is that input's sub-score; the figure is the points it added to the 100-point composite (weight × sub-score).
- Cash flow +30.0/30.0
- 1% rule +10.0/10.0
- DSCR +10.0/10.0
- ARV discount +7.5/15.0
- Livability +3.7/5.0
- Schools +3.4/10.0
- Rent growth +3.3/5.0
- Condition / age +2.5/5.0
- Appreciation +0.0/10.0
$64,900
🖨 Deal sheet 📄 Offer letter ✓ Due diligence
Listing remarks MLS
Welcome to this charming 3-bedroom, 2-bath home in Loveland with an open and airy feel. The spacious kitchen is a standout feature, boasting new countertops and recently installed cabinetry, providing both style and functionality. With a thoughtful layout and comfortable living spaces, this home offers a great opportunity to enjoy easy living in a convenient location.
Key facts
- Large deck
- Laminate flooring
- New exterior paint
Tags
Property features AI
Finance
- HOA & community: Located in Loveland Plaza mobile home park; Land lease: $1,117 monthly
Exterior
- Parking: Off-street parking (park setting)
- Utilities: Public water; Public sewer
- Home design: Manufactured home in park; Individual ownership; Single-story (main level layout)
- Construction: Frame construction; Metal roof; Wood skirting; Mobile dimensions: 66' x 16'
- Exterior features: Deck; Partial fencing; Corner, level lot; Paved road access
Interior
- Kitchen: Dishwasher; Range; Microwave; Refrigerator; Eat-in kitchen
- Bedrooms: 2 bedrooms (both on the main level); Primary suite
- Flooring: Laminate flooring throughout
- Bathrooms: 2 full bathrooms (both on the main level); Primary suite bathroom
- Heating & cooling: Forced air heating (natural gas); Evaporative cooling
- Interior features: Ceiling fans; Eat-in kitchen; Open floorplan; Window coverings
- Laundry & utility: Washer; Dryer; Main-level laundry
Neighborhood map
What this means for you Summary
Snapshot
- This is a 2-bed/2.0-bath land listed at $65k.
Deal economics
- At list price, monthly cash flow is $926 ($11k/yr) — positive.
- The deal already cash-flows at list — no discount required.
- Meets the 1% rule at list price ($2k rent vs $65k).
- Recommended offer: $57k (12.0% below list) — sets the bar for market timing.
- Cap rate 23.4% vs local median 2.9% in Loveland — top-decile yield for the area; either an underpriced asset or a hidden risk that comps aren't pricing in. Stress-test before assuming the spread holds.
Location & tenants
- Location reads 73/100 on livability (#52 in CO) — a middle-class / working-renter tenant base. Strengths: housing A+, health & safety A+, amenities A; Watch: crime C-, commute F, cost of living F.
- Thompson School District R-2J (suburban): math 28% / reading 48% proficiency, ranked #28 of 86 in CO (top 33%) — families likely to look elsewhere, expect single-tenant / working-renter base with shorter leases.
- Zoned schools: Laurene Edmondson Elementary School (math 10% / reading 34%, grade F, #651 of 966 statewide, top 68%, 261 students, 56% FRL); Lucile Erwin Middle School (math 18% / reading 35%, grade F, #160 of 270 statewide, top 60%, 712 students, 36% FRL); Loveland High School (math 35% / reading 71%, grade C-, #88 of 381 statewide, top 23%, 1,525 students, 28% FRL).
- Market conditions: Rents rising (+3.1%/yr); 436 active listings in the ZIP; 15 comparable units currently listed for rent nearby; rentals at typical pace (median 23d on market — plan ~3-4 weeks tenant-placement turnaround); solid renter incomes; 1,786 units permitted in Larimer County in 2024 (402 in 5+ unit buildings).
Forward outlook
- Local home prices are declining (-3.0%/yr); year-one equity from $449 of loan paydown is wiped out by about $2k of value loss. Plan a longer hold.
- Larimer County population projected at +51% by 2050 — long-run rental-demand tailwind backs the buy-and-hold thesis.
- At projected returns (-3.0% appreciation + 3.1% rent growth), your $18k cash investment doubles in ~2 years — after that, you're playing with house money.
Negotiation context
- It's been on market 153 days — a 12% lower offer ($57k) is reasonable based on typical stale-listing flexibility.
- 14 sale attempts since 26y ago with the ask held roughly flat each time — persistent listings suggest the price (not the market) is what's stuck; bring a comps-based counter.
Risks & watch-outs
- Climate carrying-cost: major wildfire risk — expect insurance premiums to compound above CPI over the hold.
Questions for the listing agent
- It's been on market 153 days. Have you received any prior offers? Is the seller open to a 12% concession, seller financing, or rate buy-down credit?
- Why hasn't it sold? Are there any deal-killer items the seller is aware of (foundation, flood, title, zoning, code violations)?
- Is there a deadline driving the sale (1031 exchange, divorce, estate, relocation)? That informs how much negotiation room exists.
- What's the average days-on-market for RENTAL listings here right now (not sales)? A rising rental-DOM trend means longer vacancies and softer asking-rent achievability than the comps imply.
- What's the recent tenant-quality profile in this submarket — average credit score on applications, eviction rate, late-payment / NSF rate, and stable-employment percentage? A property-management company in the area should have these aggregated.
- How much new for-sale + rental construction is in the pipeline within 1–3 miles? Heavy new supply typically softens prices + rents 12–24 months out; constrained supply supports both.
Investment metrics
- 1% rule
- 2.68% ✓
- Cap rate
- 23.41%
- Cash-on-cash
- 61.13%
- DSCR
- 3.72
- GRM
- 3.1
CMA / ARV
No comps found within radius.
Projected returns pro-forma
-3.0% appreciation · 3.11% rent growth · sell at horizon
- IRR
- 60.1%
- Equity multiple
- 3.68×
- Total profit
- $48,657
- Equity at exit
- $9,677
- IRR
- 64.8%
- Equity multiple
- 7.56×
- Total profit
- $119,183
- Equity at exit
- $5,611
Cash invested: $18,172 (down + closing). Projections, not guarantees.
Landlord ↔ Tenant lean methodology
- Overall (STATE)
- 38 Tenant-Leaning
- State Colorado
- 38 Tenant-Leaning · D+4
- County
- — inherits STATE
- City
- — inherits STATE
ZIP-level market 80538
- Rents YoY
- 3.1%
- Active inventory
- 436
- Price-to-rent
- 3.1×
Monthly cashflow live
- Estimated rent
- $1,739 high interval (Pro) →
- Mortgage (P&I)
- −$340
- Tax est. 1.5%
- −$81 /mo · $974/yr
- Insurance
- −$27
- HOA
- −$0
- Vacancy / Maint / Mgmt
- −$365
- Net cashflow
- $926
Break-even live
UW: 25.0% down · 7.5% · 30yr · 1.5% tax · 5.0% vac · 8.0% maint · 8.0% mgmt
Financing live
Cash to close
- Down payment
- $16,225
- Closing costs
- $1,947
- Reserves months
- —
- Total cash needed
- —
Loan-product check · same deal, 3 products live
Conventional
25% down · 7.5% · 30yr
- Down + closing
- —
- Monthly P&I
- —
- Monthly cashflow
- —
- DSCR
- —
- Eligible?
- —
Personal DTI + credit; lowest rate.
DSCR
20% down · 8.5% · 30yr
- Down + closing
- —
- Monthly P&I
- —
- Monthly cashflow
- —
- DSCR
- —
- Eligible?
- —
No personal income docs; deal must DSCR.
Hard money
10% down · 12.0% · 12mo
- Down + closing
- —
- Monthly P&I
- —
- Monthly cashflow
- —
- DSCR
- —
- Eligible?
- —
Short-term bridge; refi at stabilization.
Rent comps 15 comps
| Address | Beds | Baths | Sqft | Rent | $/sqft | DOM | Units | Dist |
|---|---|---|---|---|---|---|---|---|
| 171 E 42nd St Loveland, CO | 1.0 | 1.5 | 889 | $1,900 | $2.14 | 23d | 1 | 0.28mi |
| 4830 N Grant Ave Loveland, CO | 1.0–3.0 | 1.0–2.0 | 866 | $1,662 | $1.92 | 23d | 1 | 0.44mi |
| 4832 Basswood Dr Unit 4838 Loveland, CO | 2.0 | 1.0 | 936 | $1,300 | $1.39 | 23d | 1 | 0.47mi |
| 4838 Basswood Dr Loveland, CO | 2.0 | 1.0 | 936 | $1,433 | $1.53 | 23d | 1 | 0.47mi |
| 4885 Basswood Dr Loveland, CO | 2.0 | 2.0 | 894 | $1,595 | $1.78 | 23d | 1 | 0.50mi |
| 3492 Butternut Dr Loveland, CO | 2.0 | 1.0 | 850 | $1,299 | $1.53 | 23d | 1 | 0.52mi |
| 4927 Basswood Dr Loveland, CO | 2.0 | 1.0 | 900 | $1,695 | $1.88 | 13d | 1 | 0.56mi |
| 4952 Basswood Dr Loveland, CO | 2.0 | 1.0 | 930 | $1,619 | $1.74 | 13d | 1 | 0.60mi |
| 4950 Basswood Dr Unit 4952 Loveland, CO | 2.0 | 1.0 | 930 | $1,495 | $1.61 | 13d | 1 | 0.60mi |
| 1375 W 45th St Loveland, CO | 3.0 | 2.0 | 1221 | $2,480 | $2.03 | 23d | 1 | 0.84mi |
| 820 W 30th St Loveland, CO | 3.0 | 1.0 | 1176 | $2,000 | $1.70 | 23d | 1 | 0.95mi |
| 1650 Oak Creek Dr Loveland, CO | 2.0 | 1.5 | 1072 | $1,985 | $1.85 | 13d | 1 | 1.04mi |
| 1404 Caddoa Dr Loveland, CO | 2.0 | 1.0 | 870 | $1,595 | $1.83 | 23d | 1 | 1.04mi |
| 1691 Oak Creek Dr Loveland, CO | 2.0 | 2.5 | 1152 | $1,850 | $1.61 | 21d | 1 | 1.05mi |
| 574 E 23rd St Loveland, CO | 2.0 | 1.0 | 956 | $1,250 | $1.31 | 23d | 5 | 1.47mi |
Listing history 50 events
-
2026-06-18days on market $64,900 Active 153 DOM
-
2026-06-17days on market $64,900 Active 152 DOM
-
2026-06-16days on market $64,900 Active 151 DOM
-
2026-06-15days on market $64,900 Active 150 DOM
-
2026-06-14days on market $64,900 Active 148 DOM
-
2026-06-13days on market $64,900 Active 147 DOM
-
2026-06-10days on market $64,900 Active 145 DOM
-
2026-06-09days on market $64,900 Active 144 DOM
-
2026-06-08days on market $64,900 Active 143 DOM
-
2026-06-07days on market $64,900 Active 142 DOM
-
2026-06-03days on market $64,900 Active 138 DOM
-
2026-06-02days on market $64,900 Active 137 DOM
-
2026-06-01days on market $64,900 Active 136 DOM
-
2026-05-31days on market $64,900 Active 135 DOM
-
2026-05-30days on market $64,900 Active 134 DOM
-
2026-04-02status Pending 370-char remark
Show marketing remark (370 chars)
Welcome to this charming 3-bedroom, 2-bath home in Loveland with an open and airy feel. The spacious kitchen is a standout feature, boasting new countertops and recently installed cabinetry, providing both style and functionality. With a thoughtful layout and comfortable living spaces, this home offers a great opportunity to enjoy easy living in a convenient location.
-
2026-04-01soldstatus $60,000 Closed 370-char remark
Show marketing remark (370 chars)
Welcome to this charming 3-bedroom, 2-bath home in Loveland with an open and airy feel. The spacious kitchen is a standout feature, boasting new countertops and recently installed cabinetry, providing both style and functionality. With a thoughtful layout and comfortable living spaces, this home offers a great opportunity to enjoy easy living in a convenient location.
-
2026-03-15$67,000 Active 370-char remark
Show marketing remark (370 chars)
Welcome to this charming 3-bedroom, 2-bath home in Loveland with an open and airy feel. The spacious kitchen is a standout feature, boasting new countertops and recently installed cabinetry, providing both style and functionality. With a thoughtful layout and comfortable living spaces, this home offers a great opportunity to enjoy easy living in a convenient location.
-
2026-03-11historical
-
2026-02-03price $64,900
-
2026-01-16$69,900 Active
-
2025-09-11price $72,900
-
2025-09-11status Active
-
2025-09-02historical
-
2025-07-25status Active
-
2025-07-24historical
-
2025-07-07price $79,900
-
2025-06-06price $84,900
-
2025-04-07$90,000 Active
-
2024-12-10soldstatus $68,000 Closed
-
2024-11-25status Pending Accepting Backup Offers
-
2024-11-04price $68,000
-
2024-10-12price $84,000
-
2024-09-12$90,000 Active
-
2024-06-03soldstatus $89,900 Closed
-
2024-04-29status Pending Accepting Backup Offers
-
2024-04-19status Active
-
2024-04-11status Pending
-
2024-04-02$84,900 Active
-
2022-02-14historical
-
2021-12-27price $65,000
-
2021-10-29$72,000 Active
-
2021-08-19historical
-
2021-07-08$88,900 Active
-
2006-09-05soldstatus $13,250
-
2006-07-15$15,000
-
2003-04-30historical
-
2002-09-27soldstatus $49,000
-
2002-06-05$53,900
-
2002-04-07$52,900
ⓘ Source: listings_history table (triggers on properties + properties_extension) + one-shot
backfill from property_details.listing_events for pre-trigger history.
Climate risk First Street
- Flood 1/10 Low FEMA zone X (unshaded) · 0% chance over 30 yrs
- Wildfire 7/10 Severe
- Heat 3/10 Moderate 7 d/yr ≥92°F today · 17 d/yr by 30 yrs out
- Wind 1/10 Low
- Air quality 4/10 Moderate 6 unhealthy d/yr today · 8 by 30 yrs out
Nearby sold comps map
Loading sold comps map…
Walkable amenities ~0.75 mi
Loading nearby amenities…
Taxation est. · year 1
- Rental income
- $20,873
- − Mortgage interest
- −$3,635
- − Property taxes
- −$974
- − Insurance
- −$324
- − Repairs & maintenance
- −$1,670
- − Management
- −$1,670
- − Depreciation
- −$1,888
- Taxable income
- $10,712
- Est. tax owed @ 24.0%
- −$2,571
- After-tax cash flow
- $8,537/yr
For passive investors: Depreciation is non-cash, so a rental often shows a tax loss while cash-flowing — sheltering income. Rental losses are passive: they offset passive income freely, and up to $25,000/yr can offset ordinary (W-2) income if you actively participate and your MAGI is under $100k (phasing out to $0 by $150k); unused losses carry forward. On sale, claimed depreciation is recaptured at up to 25%, and gains may owe capital-gains tax (a 1031 exchange can defer both). Figures are a year-1 estimate at your 24.0% rate — not tax advice; consult a CPA.
Schools (NCES district)
- District
- Thompson School District R-2J
- NCES district ID
- 0805400
- Math proficiency
- 28% ▼ -7.00%
- Reading proficiency
- 48% ▬ 0.00%
- Median HH income
- $63,040
- Composite
- 34.01/100
- National rank
- #5313
- State rank
- #28 of 86 in CO
Livability — Loveland
- Score
- 73/100
- State rank
- #52
- US rank
- #5353
Category grades
Schools grade is shown separately in the Schools card above.
Census & demographics
- Census place
- Loveland, CO
- County
- Larimer County · 338,255 people
- City population
- 94,535
- Metro
- Fort Collins, CO
- Population (ZIP)
- 50,110
- Household income
- $86,671
- Rent vs Own
- Severe rent burden
- 1447.0
Population outlook (Larimer County) Hauer SSP2
- Today (2025)
- 415,361 people
- By 2030
- 457,762 · +10.2%
- By 2040
- 542,310 · +30.6%
- By 2050
- 627,048 · +51.0%
- By 2075
- 833,722 · +100.7%
- By 2100
- 952,590 · +129.3%
Race, ethnicity, and origin ACS 2023
- Neighborhood character
- Predominantly White (80%)
- Race & ethnicity
- White 80% Hispanic / Latino 15% Two or more races 10% Black 1%
- Hispanic origin (detail)
- Mexican 12%
- Common ancestry
- Italian 5% Lithuanian 3% Slovak 3%
- Foreign-born
- 4% · Canada, China
- Languages at home
- 93% English-only · Spanish 6%
Political lean MEDSL · Larimer
- 2024 margin
- D (+17.6) · D 57.4% · R 39.8% · Other 2.9%
- 2008→2024 swing
- +7.9pp toward D · 2008: 9.7pp · 2024: 17.6pp
- All cycles
- 2024: D+17.6 2020: D+15.4 2016: D+4.9 2012: D+5.2 2008: D+9.7
Not yet ingested
- Civics
- —
Market trends
- HPI YoY
- ▼ -515.25%
- Current HPI
- 242.9397
- Rent YoY
- ▲ 3.11%
- Metro
- Fort Collins, CO
- State GDP YoY
- ▲ 1.95%
- F500 in state
- 14
Industry mix (Fortune 500 HQ in CO)
| Industry | F500 HQs | Revenue |
|---|---|---|
| Technology Distribution | 1 | $31B |
|
||
| Food / Agriculture | 1 | $18B |
|
||
| Packaging | 1 | $14B |
|
||
| Healthcare | 1 | $13B |
|
||
| Energy | 1 | $10B |
|
||
| Technology | 1 | $4B |
|
||
Price history
+0.8% since first listed37 events — show timeline
- 2026-04-02 Pending — REColorado as Distributed by MLS Grid
- 2026-04-01 Sold (MLS) $60,000 REColorado as Distributed by MLS Grid
- 2026-03-15 Listed $67,000 REColorado as Distributed by MLS Grid
- 2026-03-11 Listing Removed — REColorado as Distributed by MLS Grid
- 2026-02-03 Price Changed $64,900 REColorado as Distributed by MLS Grid
- 2026-01-16 Listed $69,900 REColorado as Distributed by MLS Grid
- 2025-09-11 Price Changed $72,900 REColorado as Distributed by MLS Grid
- 2025-09-11 Relisted — REColorado as Distributed by MLS Grid
- 2025-09-02 Listing Removed — REColorado as Distributed by MLS Grid
- 2025-07-25 Relisted — REColorado as Distributed by MLS Grid
- 2025-07-24 Listing Removed — REColorado as Distributed by MLS Grid
- 2025-07-07 Price Changed $79,900 REColorado as Distributed by MLS Grid
- 2025-06-06 Price Changed $84,900 REColorado as Distributed by MLS Grid
- 2025-04-07 Listed $90,000 REColorado as Distributed by MLS Grid
- 2024-12-10 Sold (MLS) $68,000 REColorado as Distributed by MLS Grid
- 2024-11-25 Pending — REColorado as Distributed by MLS Grid
- 2024-11-04 Price Changed $68,000 REColorado as Distributed by MLS Grid
- 2024-10-12 Price Changed $84,000 REColorado as Distributed by MLS Grid
- 2024-09-12 Listed $90,000 REColorado as Distributed by MLS Grid
- 2024-06-03 Sold (MLS) $89,900 REColorado as Distributed by MLS Grid
- 2024-04-29 Pending — REColorado as Distributed by MLS Grid
- 2024-04-19 Relisted — REColorado as Distributed by MLS Grid
- 2024-04-11 Pending — REColorado as Distributed by MLS Grid
- 2024-04-02 Listed $84,900 REColorado as Distributed by MLS Grid
- 2022-02-14 Listing Removed — REColorado as Distributed by MLS Grid
- 2021-12-27 Price Changed $65,000 REColorado as Distributed by MLS Grid
- 2021-10-29 Listed $72,000 REColorado as Distributed by MLS Grid
- 2021-08-19 Listing Removed — REColorado as Distributed by MLS Grid
- 2021-07-08 Listed $88,900 REColorado as Distributed by MLS Grid
- 2006-09-05 Sold (MLS) $13,250 IRES
- 2006-07-15 Listed $15,000 IRES
- 2003-04-30 Listing Removed — IRES
- 2002-09-27 Sold (MLS) $49,000 IRES
- 2002-06-05 Listed $53,900 IRES
- 2002-04-07 Listed $52,900 IRES
- 2000-07-15 Listing Removed — IRES
- 2000-06-11 Listed $59,500 IRES
Property tax history
+28.7%/yrLatest (2025): $81,450 · +7.8% YoY. Source: county tax records.
Cash-flow waterfall
monthlySold comps — $/sqft
last 12 mo · ≤1 miLoading sold comps…