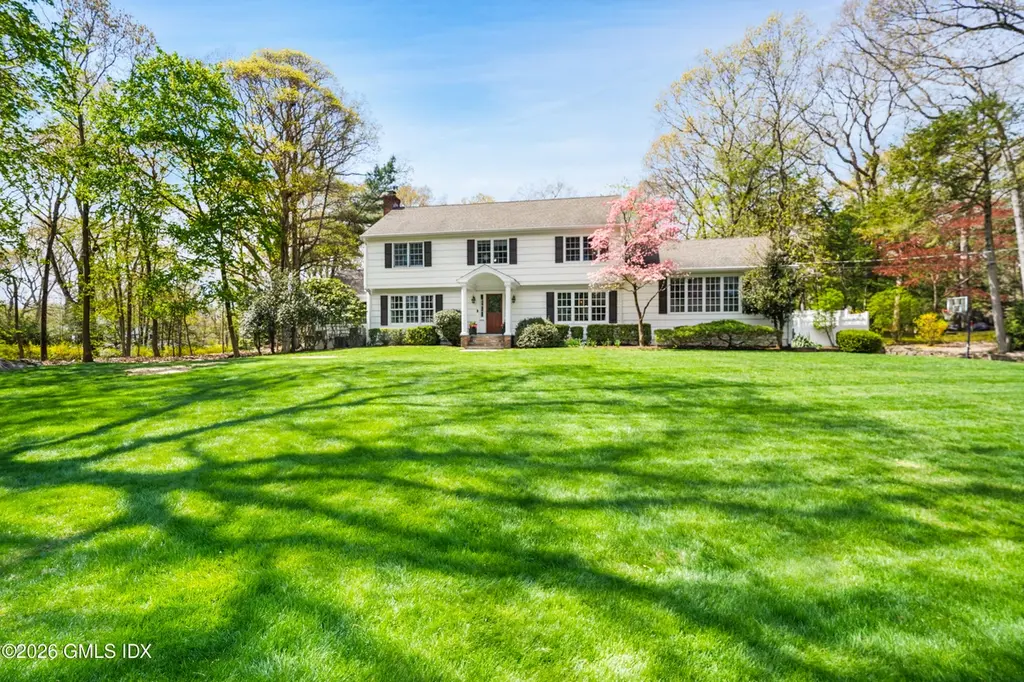
2 Daffodil Ln · Cos Cob, CT
Flood risk 1/10 · Minimal
- FEMA flood zone
- X (unshaded)
- Chance of flooding over 30 yrs
- 0.0%
- Est. flood insurance / yr
- $473 – $860
Fire risk 3/10 · Minor
- Est. fire insurance / yr
- $829 – $1,539
Heat risk 5/10 · Moderate
- Hot days now (above 99°F)
- 7 days/yr
- Hot days in 30 yrs
- 15 days/yr
Wind risk 6/10 · Moderate
- Chance of severe wind over 30 yrs
- 67.0%
Air-quality risk 4/10 · Minor
- Unhealthy air days now
- 5 days/yr
- Unhealthy air days in 30 yrs
- 7 days/yr
Risk factors via First Street. Map © Google.
Why this score? — see what drove the F grade
The composite is a weighted blend of 9 inputs, each scored 0–100. Each bar is that input's sub-score; the figure is the points it added to the 100-point composite (weight × sub-score).
- Appreciation +9.0/10.0
- Schools +6.6/10.0
- ARV discount +6.0/15.0
- Cash flow +4.2/30.0
- Livability +3.7/5.0
- Rent growth +2.5/5.0
- Condition / age +2.5/5.0
- 1% rule +0.0/10.0
- DSCR +0.0/10.0
$3,125,000
🖨 Deal sheet 📄 Offer letter ✓ Due diligence
Listing remarks MLS
TRADITIONAL CNTRHL COLONIAL ON A WONDERFUL LEVEL ACRE W/ POOL. LRG ENTER- TAINING ROOMS ALL OPENING TO A DECK LEADING TO EASY ENTERTAINING. 4 FAMILY BEDROOMS ON THE SECOND FLOOR W/ 2 FULL BATHS. AN ADDITIONAL 5TH BONUS ROOM W/ BATH ON SEPARATE LEVEL W/ SEPARATE ENTRANCE. TOWN SEWER SCHEDULED APPROX YEAR AND HALF. JUNE 1 CLOSING PREFERRED. J-1,3.K-13.
Key facts
- 1.01 acre lot
- 2 garage spots
- Pool
Property features AI
Exterior
- Parking: 2-car garage
- Security: Security system
- Utilities: Public water
- Home design: Single family residence; Built in 1962 (effective year 2003); Asphalt roof; Shingle siding
- Construction: Shingle siding construction; Asphalt roof; Finished in 2003 (effective)
- Exterior features: Deck; Private pool; Level, park-like lot
Interior
- Kitchen: Eat-in kitchen
- Bathrooms: 3 full bathrooms; 2 half bathrooms (5 total bathrooms listed)
- Heating & cooling: Central air conditioning; Natural gas heating; Hot water heating
- Interior features: Eat-in kitchen; Entrance foyer; Finished full basement; One fireplace
Neighborhood map
What this means for you Summary
Snapshot
- This is a 4-bed/3.5-bath single-family listed at $3.12M.
Deal economics
- At list price, monthly cash flow is $-8k ($-101k/yr) — negative.
- To cash-flow at today's rent, offer at most $1.63M (47.8% below list).
- To meet the 1% rule (rent ≥ 1% of price), the offer needs to be $1.31M (58.2% below list).
- Recommended offer: $1.31M (58.2% below list) — sets the bar for 1% rule.
Location & tenants
- Location reads 73/100 on livability (#72 in CT) — a middle-class / working-renter tenant base. Strengths: crime A+, employment A+, health & safety B; Watch: housing D+, amenities F, commute F.
- Greenwich School District (suburban): math 64% / reading 73% proficiency, ranked #12 of 153 in CT (top 8%) — acceptable for families but not a draw, mixed tenant base, ~2y average lease; only 11% free/reduced lunch — higher-income household profile.
- Zoned schools: North Mianus School (math 83% / reading 81%, grade A+, #11 of 553 statewide, top 3%, 492 students, 3% FRL); Eastern Middle School (math 75% / reading 81%, grade A+, #2 of 175 statewide, top 1%, 784 students, 6% FRL).
- Market conditions: 31 active listings in the ZIP; 13 comparable units currently listed for rent nearby; rentals leasing fast (median 12d on market — plan ~1-2 weeks tenant-placement turnaround); 1,151 units permitted in Western Connecticut Planning Region in 2024 (714 in 5+ unit buildings).
Forward outlook
- In year one you build about $269k of equity ($22k loan paydown + $247k appreciation (7.9% local appreciation)).
- By year 2, paydown + projected appreciation supports a ~$430k cash-out refi (75% LTV) — recoverable capital for the next deal without selling this one.
Negotiation context
- Only 11 days on market — expect competitive offers; lowballing is unlikely to land.
- 3 sale attempts since 24y ago with the ask held roughly flat each time — persistent listings suggest the price (not the market) is what's stuck; bring a comps-based counter.
- Current owner paid $1.68M; list at $3.12M implies a 87% gain — meaningful room to come down on a strong offer.
Risks & watch-outs
- Climate carrying-cost: major wind risk, 67% chance of damaging wind over 30y; extreme-heat days projected 7→15/yr by 2055 (HVAC capex compounding) — expect insurance premiums to compound above CPI over the hold.
Questions for the listing agent
- What do current leases actually rent for vs. the listed asking? Can we see a recent rent roll and the last 12 months of T-12 income?
- Built in 1962 — when were the roof, HVAC, electrical panel, plumbing, and water heater last replaced?
- Is there a deadline driving the sale (1031 exchange, divorce, estate, relocation)? That informs how much negotiation room exists.
- Schools are A-rated — typically a magnet for longer-tenancy family renters. What's the average tenant stay here, and is there a school-zone premium baked into asking?
- The area grade is low — what's the realistic commute time and amenity access for the typical tenant pool here? Any planned neighborhood developments (good or bad) we should know about?
- What's the average days-on-market for RENTAL listings here right now (not sales)? A rising rental-DOM trend means longer vacancies and softer asking-rent achievability than the comps imply.
- What's the recent tenant-quality profile in this submarket — average credit score on applications, eviction rate, late-payment / NSF rate, and stable-employment percentage? A property-management company in the area should have these aggregated.
- How much new for-sale + rental construction is in the pipeline within 1–3 miles? Heavy new supply typically softens prices + rents 12–24 months out; constrained supply supports both.
Investment metrics
- 1% rule
- 0.42% ✗
- Cap rate
- 3.05%
- Cash-on-cash
- -11.59%
- DSCR
- 0.48
- GRM
- 19.9
CMA / ARV
- ARV (median comp)
- $3,023,762
- List price
- $3,125,000
- Delta
- 3.35%
- Verdict
- FAIR
- Comps
- 20 within 1.0 mi
Show comp detail 9 sales within ~0.75 mi
| Address | Dist | Beds/Ba | Sqft | Sold | Price | $/sf | Match |
|---|---|---|---|---|---|---|---|
| 42 Mimosa Dr | 0.30mi | 4/2.5 | 2,751 (-6%) | 12mo | $2,200,000 | $800 | 62 |
| 472 Westover Rd | 0.70mi | 4/3.5 | 2,980 (+2%) | 12mo | $799,000 | $268 | 54 |
| 6 Windsor Ln | 0.60mi | 4/2.5 | 3,003 (+3%) | 14mo | $1,803,000 | $600 | 52 |
| 29 W Bank Ln | 0.57mi | 4/3.5 | 3,196 (+10%) | 17mo | $912,500 | $286 | 44 |
| 656 Westover Rd | 0.68mi | 4/2.5 | 3,193 (+10%) | 9mo | $1,196,000 | $375 | 41 |
| 483 Westover Rd | 0.74mi | 3/3.0 (-1) | 2,932 (+0%) | 22mo | $1,000,000 | $341 | 40 |
| 174 Cat Rock Rd | 0.57mi | 4/3.0 | 2,575 (-12%) | 24mo | $1,950,000 | $757 | 32 |
| 92 Hillcrest Park Rd | 0.73mi | 5/3.5 (+1) | 3,339 (+14%) | 6mo | $2,950,000 | $883 | 31 |
| 51 Westover Ln | 0.67mi | 4/3.5 | 3,295 (+13%) | 22mo | $1,287,500 | $391 | 28 |
Match score weights: distance 35% · size 25% · config 20% · recency 20%. Top-matched comps best support the ARV.
Projected returns pro-forma
7.9% appreciation · 3.0% rent growth · sell at horizon
- IRR
- 11.1%
- Equity multiple
- 1.83×
- Total profit
- $728,548
- Equity at exit
- $2,353,810
- IRR
- 11.9%
- Equity multiple
- 3.87×
- Total profit
- $2,509,819
- Equity at exit
- $4,653,024
Cash invested: $875,000 (down + closing). Projections, not guarantees.
Landlord ↔ Tenant lean methodology
- Overall (STATE)
- 27 Tenant-Leaning
- State Connecticut
- 27 Tenant-Leaning · D+7
- County
- — inherits STATE
- City
- — inherits STATE
ZIP-level market 06807
- Home prices YoY
- 4.3%
- Active inventory
- 31
- Price-to-rent
- 19.9×
Monthly cashflow live
- Estimated rent
- $13,065 high interval (Pro) →
- Mortgage (P&I)
- −$16,388
- Tax from tax record
- −$1,080 /mo · $12,965/yr
- Insurance
- −$1,302
- HOA
- −$0
- Vacancy / Maint / Mgmt
- −$2,744
- Net cashflow
- $-8,449
Break-even live
UW: 25.0% down · 7.5% · 30yr · 1.5% tax · 5.0% vac · 8.0% maint · 8.0% mgmt
Financing live
Cash to close
- Down payment
- $781,250
- Closing costs
- $93,750
- Reserves months
- —
- Total cash needed
- —
Loan-product check · same deal, 3 products live
Conventional
25% down · 7.5% · 30yr
- Down + closing
- —
- Monthly P&I
- —
- Monthly cashflow
- —
- DSCR
- —
- Eligible?
- —
Personal DTI + credit; lowest rate.
DSCR
20% down · 8.5% · 30yr
- Down + closing
- —
- Monthly P&I
- —
- Monthly cashflow
- —
- DSCR
- —
- Eligible?
- —
No personal income docs; deal must DSCR.
Hard money
10% down · 12.0% · 12mo
- Down + closing
- —
- Monthly P&I
- —
- Monthly cashflow
- —
- DSCR
- —
- Eligible?
- —
Short-term bridge; refi at stabilization.
Rent comps 13 comps
| Address | Beds | Baths | Sqft | Rent | $/sqft | DOM | Units | Dist |
|---|---|---|---|---|---|---|---|---|
| 424 Cognewaugh Rd Cos Cob, CT | 5.0 | 4.0 | 3580 | $11,500 | $3.21 | 10d | 1 | 0.74mi |
| 507 River Rd Cos Cob, CT | 5.0 | 4.5 | 4100 | $16,000 | $3.90 | 3d | 1 | 0.96mi |
| 488 Cognewaugh Rd Cos Cob, CT | 3.0 | 2.5 | 3116 | $12,000 | $3.85 | 2d | 1 | 0.96mi |
| 12 Norton Ln Old Greenwich, CT | 4.0 | 3.5 | 3285 | $15,000 | $4.57 | 21d | 1 | 1.00mi |
| 40 Mianus View Ter Cos Cob, CT | 5.0 | 3.5 | 2895 | $14,500 | $5.01 | 3d | 1 | 1.20mi |
| 40 Mianus View Ter Cos Cob, CT | 4.0 | 3.5 | 2895 | $14,500 | $5.01 | 11d | 1 | 1.20mi |
| 26 Revere Rd Riverside, CT | 4.0 | 2.5 | 2383 | $13,900 | $5.83 | 11d | 1 | 1.20mi |
| 26 Revere Rd Riverside, CT | 4.0 | 2.5 | 2383 | $13,900 | $5.83 | 10d | 1 | 1.20mi |
| 163 Macgregor Dr Stamford, CT | 4.0 | 2.5 | 3070 | $7,500 | $2.44 | 23d | 1 | 1.28mi |
| 15 Lancer Rd Riverside, CT | 4.0 | 2.5 | 3031 | $8,889 | $2.93 | 23d | 1 | 1.29mi |
| 14 Rainbow Dr Riverside, CT | 5.0 | 3.5 | 3510 | $16,000 | $4.56 | 23d | 1 | 1.31mi |
| 1 Crawford Ter Riverside, CT | 4.0 | 4.0 | 2819 | $18,000 | $6.39 | 21d | 1 | 1.35mi |
| 57 Drum Hill Ln Stamford, CT | 4.0 | 3.5 | 2995 | $8,750 | $2.92 | 19d | 1 | 1.49mi |
Listing history 11 events
-
2026-05-11status Pending 786-char remark
-
2026-04-30$3,125,000 Active 786-char remark
-
2026-04-27historical $3,125,000 786-char remark
-
2023-08-24historical
-
2017-06-11historical
-
2010-07-12soldstatus $1,675,000
-
2010-07-01soldstatus $1,675,000
-
2009-03-24$1,775,000
-
2002-06-03soldstatus $1,220,000
-
2002-05-31soldstatus $1,220,000
Show marketing remark (352 chars)
TRADITIONAL CNTRHL COLONIAL ON A WONDERFUL LEVEL ACRE W/ POOL. LRG ENTER- TAINING ROOMS ALL OPENING TO A DECK LEADING TO EASY ENTERTAINING. 4 FAMILY BEDROOMS ON THE SECOND FLOOR W/ 2 FULL BATHS. AN ADDITIONAL 5TH BONUS ROOM W/ BATH ON SEPARATE LEVEL W/ SEPARATE ENTRANCE. TOWN SEWER SCHEDULED APPROX YEAR AND HALF. JUNE 1 CLOSING PREFERRED. J-1,3.K-13.
-
2002-01-28$1,395,000
Show marketing remark (352 chars)
TRADITIONAL CNTRHL COLONIAL ON A WONDERFUL LEVEL ACRE W/ POOL. LRG ENTER- TAINING ROOMS ALL OPENING TO A DECK LEADING TO EASY ENTERTAINING. 4 FAMILY BEDROOMS ON THE SECOND FLOOR W/ 2 FULL BATHS. AN ADDITIONAL 5TH BONUS ROOM W/ BATH ON SEPARATE LEVEL W/ SEPARATE ENTRANCE. TOWN SEWER SCHEDULED APPROX YEAR AND HALF. JUNE 1 CLOSING PREFERRED. J-1,3.K-13.
ⓘ Source: listings_history table (triggers on properties + properties_extension) + one-shot
backfill from property_details.listing_events for pre-trigger history.
Tax reassessment forecast CT · Partial reset (capped growth)
- Current annual tax
- $12,965 · $1,080/mo
- Projected year-2 tax
- $39,920 · $3,327/mo
- Expected delta
- +$26,955/yr (+$2,246/mo · 207.9%)
ⓘ Screening estimate from a state-policy table — verify with the county assessor before closing.
Climate risk First Street
- Flood 1/10 Low FEMA zone X (unshaded) · 0% chance over 30 yrs
- Wildfire 3/10 Moderate
- Heat 5/10 Major 7 d/yr ≥99°F today · 15 d/yr by 30 yrs out
- Wind 6/10 Major 67% chance of damaging wind over 30 yrs
- Air quality 4/10 Moderate 5 unhealthy d/yr today · 7 by 30 yrs out
Nearby sold comps map
Loading sold comps map…
Walkable amenities ~0.75 mi
Loading nearby amenities…
Taxation est. · year 1
- Rental income
- $156,780
- − Mortgage interest
- −$175,049
- − Property taxes
- −$12,965
- − Insurance
- −$15,625
- − Repairs & maintenance
- −$12,542
- − Management
- −$12,542
- − Depreciation
- −$90,909
- Taxable loss
- −$162,852
- Est. tax savings @ 24.0%
- +$39,084
- After-tax cash flow
- $-62,303/yr
For passive investors: Depreciation is non-cash, so a rental often shows a tax loss while cash-flowing — sheltering income. Rental losses are passive: they offset passive income freely, and up to $25,000/yr can offset ordinary (W-2) income if you actively participate and your MAGI is under $100k (phasing out to $0 by $150k); unused losses carry forward. On sale, claimed depreciation is recaptured at up to 25%, and gains may owe capital-gains tax (a 1031 exchange can defer both). Figures are a year-1 estimate at your 24.0% rate — not tax advice; consult a CPA.
Schools (NCES district)
- District
- Greenwich School District
- NCES district ID
- 0901710
- Math proficiency
- 64% ▼ -7.00%
- Reading proficiency
- 73% ▼ -5.00%
- Median HH income
- $129,257
- Composite
- 65.67/100
- National rank
- #461
- State rank
- #12 of 153 in CT
Livability — Cos Cob
- Score
- 73/100
- State rank
- #72
- US rank
- #5178
Category grades
Schools grade is shown separately in the Schools card above.
Census & demographics
- City population
- 7,667
- Population (ZIP)
- 7,667
Population outlook (Western Connecticut County) Hauer SSP2
- By 2040
- 685,031
Race, ethnicity, and origin ACS 2023
- Neighborhood character
- Diverse neighborhood (Simpson 0.58)
- Race & ethnicity
- White 63% Two or more races 15% Hispanic / Latino 13% Asian 7% Black 4%
- Hispanic origin (detail)
- Puerto Rican 6% Dominican 1%
- Common ancestry
- Romanian 4% Estonian 4% Italian 3%
- Foreign-born
- 24% · Canada, China, Jamaica
- Languages at home
- 76% English-only · Other Indo-European 9% Spanish 6% Other Asian/Pacific 5%
Political lean MEDSL · Western Connecticut
- 2024 margin
- D (+19.1) · D 58.8% · R 39.7% · Other 1.6%
- All cycles
- 2024: D+19.1
Not yet ingested
- Civics
- —
Market trends
- HPI YoY
- ▲ 7.90%
- Current HPI
- 191.0957
- Rent YoY
- —
- Metro
- —
- State GDP YoY
- ▲ 1.06%
- F500 in state
- 38
Industry mix (Fortune 500 HQ in CT)
| Industry | F500 HQs | Revenue |
|---|---|---|
| Industrial Machinery | 4 | $38B |
|
||
| Insurance | 3 | $71B |
|
||
| Financial Services | 2 | $25B |
|
||
| Transportation / Logistics | 2 | $18B |
|
||
| Healthcare | 1 | $247B |
|
||
| Telecommunications | 1 | $55B |
|
||
Price history
+124.0% since first listed11 events — show timeline
- 2026-05-11 Pending — GMLS
- 2026-04-30 Listed $3,125,000 GMLS
- 2026-04-27 Coming Soon $3,125,000 GMLS
- 2023-08-24 Rental Removed — SMARTMLS
- 2017-06-11 Delisted — GMLS
- 2010-07-12 Sold (Public Records) $1,675,000 Public Records
- 2010-07-01 Sold (Public Records) $1,675,000 Public Records
- 2009-03-24 Listed $1,775,000 GMLS
- 2002-06-03 Sold (Public Records) $1,220,000 Public Records
- 2002-05-31 Sold (MLS) $1,220,000 GMLS
- 2002-01-28 Listed $1,395,000 GMLS
Property tax history
+0.6%/yrLatest (2023): $12,965 · +0.9% YoY. Source: county tax records.
Cash-flow waterfall
monthlySold comps — $/sqft
last 12 mo · ≤1 miLoading sold comps…