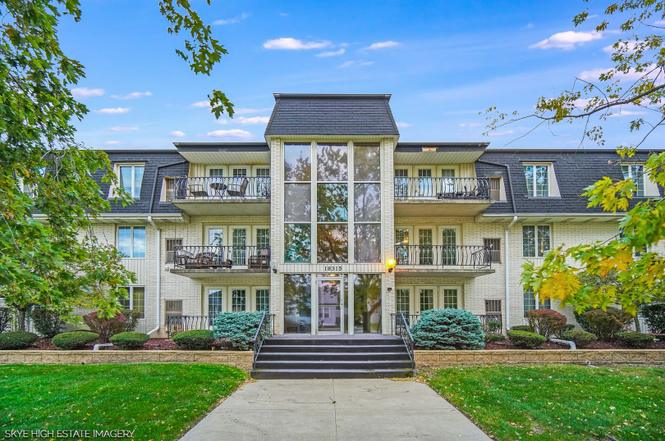
18315 Burnham Ave #204 · Lansing, IL
Flood risk 1/10 · Minimal
- FEMA flood zone
- X (unshaded)
- Chance of flooding over 30 yrs
- 0.0%
- Est. flood insurance / yr
- $507 – $1,088
Fire risk 3/10 · Minor
- Est. fire insurance / yr
- $804 – $1,492
Heat risk 3/10 · Minor
- Hot days now (above 102°F)
- 7 days/yr
- Hot days in 30 yrs
- 15 days/yr
Wind risk 2/10 · Minimal
- Chance of severe wind over 30 yrs
- 0.0%
Air-quality risk 4/10 · Minor
- Unhealthy air days now
- 5 days/yr
- Unhealthy air days in 30 yrs
- 6 days/yr
Risk factors via First Street. Map © Google.
Why this score? — see what drove the C grade
The composite is a weighted blend of 9 inputs, each scored 0–100. Each bar is that input's sub-score; the figure is the points it added to the 100-point composite (weight × sub-score).
- Cash flow +25.5/30.0
- DSCR +8.5/10.0
- 1% rule +7.7/10.0
- ARV discount +7.5/15.0
- Livability +3.7/5.0
- Rent growth +2.5/5.0
- Condition / age +2.5/5.0
- Schools +1.0/10.0
- Appreciation +0.0/10.0
$129,900
🖨 Deal sheet 📄 Offer letter ✓ Due diligence
Listing remarks
Outstanding value in this 2nd level luxurious 2 bedroom with 2 full bathroom condo. This an impressive, well maintained elevator building is 55 year old or older community. Open layout connecting living, dining and kitchen with new laminate wood flooring. Updated kitchen with newer appliances including dishwasher, garbage disposal and fridge. Balcony with sliding door of the living room. Primary bedroom has four (4) closets including walk-ins and exclusive bathroom with walk in shower. Laundry hook up for side-by-side washer and dryer in the unit (please note unit does not come with washer & dryer). Two (2) indoor heated garage parking spaces. Easy access to nearby shopping, recreatio
Key facts
- Exclusive bathroom
- Balcony
- Open layout
Tags
Property features AI
Finance
- Other: Taxes and specific financial amounts excluded
- HOA & community: Monthly association fee ($208); Association includes water, insurance, exterior maintenance, lawn care, scavenger, and snow removal; Association amenities: Elevator(s), storage, receiving room; Pets not allowed
Exterior
- Parking: 2 parking spaces total; Attached garage (heated, owned) with garage door opener; Side driveway; Asphalt surfaces
- Utilities: Public water; Public sewer; Electric with circuit breakers (100 amp service)
- Home design: Attached single condo; Entry level: 2; 18-unit building; Estimated living area; Facing not specified
- Construction: Built approximately 31–40 years ago; Brick construction; Asphalt roof; Concrete perimeter foundation
- Exterior features: Balcony; Common grounds; Landscaped
Interior
- Kitchen: Range; Microwave; Dishwasher; Refrigerator; Disposal; Eating area / table space
- Bedrooms: 2 bedrooms total (both on main level); Master bedroom on main level with full bath
- Flooring: Laminate flooring; Carpet
- Bathrooms: 2 full bathrooms; Soaking tub
- Heating & cooling: Natural gas forced air heating; Central air conditioning
- Interior features: First-floor bedroom; First-floor full bath; Storage; Built-in features; Walk-in closet(s); Open floorplan; Dining area combined with living room; Flexicore construction
- Laundry & utility: In-unit laundry with washer hookup on main level; Washer; Dryer
Neighborhood map
What this means for you Summary
Snapshot
- This is a 2-bed/2.0-bath condo listed at $130k.
Deal economics
- At list price, monthly cash flow is $305 ($4k/yr) — positive.
- The deal already cash-flows at list — no discount required.
- Meets the 1% rule at list price ($2k rent vs $130k).
- Recommended offer: $118k (9.0% below list) — sets the bar for market timing.
- Cap rate 9.1% vs local median 5.8% in Lansing — top-decile yield for the area; either an underpriced asset or a hidden risk that comps aren't pricing in. Stress-test before assuming the spread holds.
Location & tenants
- Location reads 73/100 on livability (#296 in IL) — a middle-class / working-renter tenant base. Strengths: commute A+, cost of living A+, housing A+; Watch: schools D+, crime D+, health & safety D+.
- Thornton Fractional Twp Hsd 215 (suburban): math 9% / reading 13% proficiency, ranked #563 of 620 in IL (top 91%) — low school quality limits family demand, transient renter base, plan for 1-2y turnover.
- Market conditions: 132 active listings in the ZIP; 13 comparable units currently listed for rent nearby; rentals leasing fast (median 12d on market — plan ~1-2 weeks tenant-placement turnaround); solid renter incomes; 6,272 units permitted in Cook County in 2024 (4,658 in 5+ unit buildings).
Forward outlook
- Local home prices are declining (-3.0%/yr); year-one equity from $898 of loan paydown is wiped out by about $4k of value loss. Plan a longer hold.
Negotiation context
- It's been on market 106 days — a 9% lower offer ($118k) is reasonable based on typical stale-listing flexibility.
- 6 sale attempts since 21y ago with the ask held roughly flat each time — persistent listings suggest the price (not the market) is what's stuck; bring a comps-based counter.
- Current owner paid $50k; list at $130k implies a 160% gain — meaningful room to come down on a strong offer.
Questions for the listing agent
- It's been on market 106 days. Have you received any prior offers? Is the seller open to a 9% concession, seller financing, or rate buy-down credit?
- What does the HOA fee cover, when was the last increase, and are there any pending special assessments or reserve-fund shortfalls?
- Any open or pending special assessments — roof, HVAC, plumbing, elevator, façade? What's the per-unit balance and payoff schedule, and is the seller paying it off at close or rolling it to the buyer?
- Why hasn't it sold? Are there any deal-killer items the seller is aware of (foundation, flood, title, zoning, code violations)?
- Is there a deadline driving the sale (1031 exchange, divorce, estate, relocation)? That informs how much negotiation room exists.
- Schools are D-rated, which usually means shorter tenancies and higher turnover. Who's the typical renter profile here, and what's been the actual vacancy rate?
- Crime grade is D in this area — have there been break-ins, vandalism, or insurance claims at this property in the last 3 years? What carrier currently insures it and at what premium?
- What's the average days-on-market for RENTAL listings here right now (not sales)? A rising rental-DOM trend means longer vacancies and softer asking-rent achievability than the comps imply.
- What's the recent tenant-quality profile in this submarket — average credit score on applications, eviction rate, late-payment / NSF rate, and stable-employment percentage? A property-management company in the area should have these aggregated.
- How much new apartment / multifamily construction is in the pipeline within 1–3 miles? Heavy new supply (>2% of stock underway) typically softens rents 12–24 months out; light construction supports rent growth.
Investment metrics
- 1% rule
- 1.27% ✓
- Cap rate
- 9.11%
- Cash-on-cash
- 10.05%
- DSCR
- 1.45
- GRM
- 6.6
CMA / ARV
No comps found within radius.
Projected returns pro-forma
-3.0% appreciation · 3.0% rent growth · sell at horizon
- IRR
- -1.1%
- Equity multiple
- 0.96×
- Total profit
- $-1,560
- Equity at exit
- $19,369
- IRR
- 8.6%
- Equity multiple
- 1.66×
- Total profit
- $23,973
- Equity at exit
- $11,231
Cash invested: $36,372 (down + closing). Projections, not guarantees.
Landlord ↔ Tenant lean methodology
- Overall (STATE)
- 43 Moderately Tenant-Leaning
- State Illinois
- 43 Moderately Tenant-Leaning · D+7
- County
- — inherits STATE
- City
- — inherits STATE
ZIP-level market 60438
- Active inventory
- 132
- Price-to-rent
- 6.6×
Monthly cashflow live
- Estimated rent
- $1,645 high interval (Pro) →
- Mortgage (P&I)
- −$681
- Tax from tax record
- −$52 /mo · $620/yr
- Insurance
- −$54
- HOA
- −$208
- Vacancy / Maint / Mgmt
- −$345
- Net cashflow
- $305
Break-even live
UW: 25.0% down · 7.5% · 30yr · 1.5% tax · 5.0% vac · 8.0% maint · 8.0% mgmt
Financing live
Cash to close
- Down payment
- $32,475
- Closing costs
- $3,897
- Reserves months
- —
- Total cash needed
- —
Loan-product check · same deal, 3 products live
Conventional
25% down · 7.5% · 30yr
- Down + closing
- —
- Monthly P&I
- —
- Monthly cashflow
- —
- DSCR
- —
- Eligible?
- —
Personal DTI + credit; lowest rate.
DSCR
20% down · 8.5% · 30yr
- Down + closing
- —
- Monthly P&I
- —
- Monthly cashflow
- —
- DSCR
- —
- Eligible?
- —
No personal income docs; deal must DSCR.
Hard money
10% down · 12.0% · 12mo
- Down + closing
- —
- Monthly P&I
- —
- Monthly cashflow
- —
- DSCR
- —
- Eligible?
- —
Short-term bridge; refi at stabilization.
Rent comps 13 comps
| Address | Beds | Baths | Sqft | Rent | $/sqft | DOM | Units | Dist |
|---|---|---|---|---|---|---|---|---|
| 18335 Sherman St Unit 3 Lansing, IL | 3.0 | 1.0 | 1000 | $1,700 | $1.70 | 1d | 1 | 0.35mi |
| 2824 186th St Lansing, IL | 3.0 | 2.0 | 1400 | $2,900 | $2.07 | 10d | 1 | 0.53mi |
| 3020 178th St Unit C1 Lansing, IL | 2.0 | 1.0 | 900 | $1,550 | $1.72 | 1d | 1 | 0.76mi |
| 3020 178th St Apt C7 Lansing, IL | 2.0 | 1.0 | 900 | $1,550 | $1.72 | 24d | 1 | 0.76mi |
| 18361 Glen Oak Ave Unit 1E Lansing, IL | 2.0 | 1.0 | 900 | $1,400 | $1.56 | 24d | 1 | 0.93mi |
| 17723 Exchange Ave Unit 17723-1N Lansing, IL | 3.0 | 2.0 | 1100 | $1,800 | $1.64 | 1d | 1 | 1.00mi |
| 18381 Torrence Ave Lansing, IL | 2.0 | 1.0 | 900 | $1,300 | $1.44 | 24d | 1 | 1.01mi |
| 18440 Torrence Ave Lansing, IL | 2.0 | 1.0 | 800 | $1,200 | $1.50 | 24d | 1 | 1.06mi |
| 18550 Torrence Ave #25 Lansing, IL | 2.0 | 1.0 | 1000 | $1,300 | $1.30 | 11d | 1 | 1.07mi |
| 3069 Bernice Rd Apt 2N Lansing, IL | 3.0 | 1.0 | 950 | $1,535 | $1.62 | 20d | 1 | 1.19mi |
| 3069 Bernice Rd Apt 2S Lansing, IL | 3.0 | 1.0 | 950 | $1,535 | $1.62 | 2d | 1 | 1.19mi |
| 3023 Bernice Rd Apt 2S Lansing, IL | 3.0 | 1.0 | 1000 | $1,600 | $1.60 | 1d | 1 | 1.20mi |
| 3649 173rd Ct Lansing, IL | 2.0 | 2.0 | 972 | $1,357 | $1.40 | 24d | 1 | 1.36mi |
HOA detail condo
- Monthly dues
- $208 · $2,496/yr
- Likely covers
- trash
- Assessments
- None detected in remarks — confirm with the listing agent.
Listing history 29 events
-
2026-06-18days on market $129,900 Active 106 DOM
-
2026-06-17days on market $129,900 Active 105 DOM
-
2026-06-16days on market $129,900 Active 104 DOM
-
2026-06-15days on market $129,900 Active 103 DOM
-
2026-06-13days on market $129,900 Active 101 DOM
-
2026-06-09days on market $129,900 Active 97 DOM
-
2026-06-08days on market $129,900 Active 96 DOM
-
2026-06-07days on market $129,900 Active 95 DOM
-
2026-06-04days on market $129,900 Active 92 DOM
-
2026-06-03days on market $129,900 Active 91 DOM
-
2026-06-02days on market $129,900 Active 90 DOM
-
2026-06-01days on market $129,900 Active 89 DOM
-
2026-05-31days on market $129,900 Active 88 DOM
-
2026-03-04$129,900 Active
-
2026-03-04historical
-
2026-01-12Active
-
2026-01-12historical
-
2025-11-10Active
-
2015-07-08soldstatus $50,000
-
2015-06-29soldstatus $49,909 Closed Sale
-
2015-04-30historical Contingent
-
2015-04-02$49,909 New
-
2009-07-24soldstatus $120,000
-
2009-07-16soldstatus $120,000 Closed Sale
-
2009-03-25price $129,900
-
2008-06-30$132,900
-
2006-04-12soldstatus $125,000
-
2005-12-02historical
-
2005-09-20$132,900
ⓘ Source: listings_history table (triggers on properties + properties_extension) + one-shot
backfill from property_details.listing_events for pre-trigger history.
Tax reassessment forecast IL · Partial reset (capped growth)
- Current annual tax
- $620 · $52/mo
- Projected year-2 tax
- $1,784 · $149/mo
- Expected delta
- +$1,165/yr (+$97/mo · 187.9%)
ⓘ Screening estimate from a state-policy table — verify with the county assessor before closing.
Climate risk First Street
- Flood 1/10 Low FEMA zone X (unshaded) · 0% chance over 30 yrs
- Wildfire 3/10 Moderate
- Heat 3/10 Moderate 7 d/yr ≥102°F today · 15 d/yr by 30 yrs out
- Wind 2/10 Low 0% chance of damaging wind over 30 yrs
- Air quality 4/10 Moderate 5 unhealthy d/yr today · 6 by 30 yrs out
Nearby sold comps map
Loading sold comps map…
Walkable amenities ~0.75 mi
Loading nearby amenities…
Taxation est. · year 1
- Rental income
- $19,742
- − Mortgage interest
- −$7,276
- − Property taxes
- −$620
- − Insurance
- −$650
- − Repairs & maintenance
- −$1,579
- − Management
- −$1,579
- − HOA
- −$2,496
- − Depreciation
- −$3,779
- Taxable income
- $1,762
- Est. tax owed @ 24.0%
- −$423
- After-tax cash flow
- $3,233/yr
For passive investors: Depreciation is non-cash, so a rental often shows a tax loss while cash-flowing — sheltering income. Rental losses are passive: they offset passive income freely, and up to $25,000/yr can offset ordinary (W-2) income if you actively participate and your MAGI is under $100k (phasing out to $0 by $150k); unused losses carry forward. On sale, claimed depreciation is recaptured at up to 25%, and gains may owe capital-gains tax (a 1031 exchange can defer both). Figures are a year-1 estimate at your 24.0% rate — not tax advice; consult a CPA.
Schools (NCES district)
- District
- Thornton Fractional Twp Hsd 215
- NCES district ID
- 1738940
- Math proficiency
- 9% ▼ -3.00%
- Reading proficiency
- 13% ▼ -3.00%
- Median HH income
- $48,207
- Composite
- 10.27/100
- National rank
- #9793
- State rank
- #563 of 620 in IL
Livability — Lansing
- Score
- 73/100
- State rank
- #296
- US rank
- #5698
Category grades
Schools grade is shown separately in the Schools card above.
Census & demographics
- Census place
- Lansing, IL
- County
- Cook County · 4,486,803 people
- City population
- 28,806
- Metro
- Chicago-Naperville-Elgin, IL-IN-WI
- Population (ZIP)
- 28,806
- Household income
- $75,681
- Rent vs Own
- Severe rent burden
- 830.0
Population outlook (Cook County) Hauer SSP2
- Today (2025)
- 5,347,519 people
- By 2030
- 5,357,703 · +0.2%
- By 2040
- 5,324,924 · -0.4%
- By 2050
- 5,230,762 · -2.2%
- By 2075
- 4,785,735 · -10.5%
- By 2100
- 4,188,836 · -21.7%
Race, ethnicity, and origin ACS 2023
- Neighborhood character
- Diverse neighborhood (Simpson 0.65)
- Race & ethnicity
- Black 51% White 25% Hispanic / Latino 18% Two or more races 7% Asian 2%
- Hispanic origin (detail)
- Mexican 15%
- Common ancestry
- Romanian 5% Iranian 3% Lithuanian 1%
- Foreign-born
- 10% · Canada
- Languages at home
- 83% English-only · Spanish 12% Vietnamese 1% French/Haitian/Cajun 1%
Political lean MEDSL · Cook
- 2024 margin
- Solid D (+42.0) · D 70.4% · R 28.4% · Other 1.2%
- 2008→2024 swing
- -11.4pp toward R · 2008: 53.4pp · 2024: 42.0pp
- All cycles
- 2024: D+42.0 2020: D+50.3 2016: D+53.0 2012: D+49.4 2008: D+53.4
Not yet ingested
- Civics
- —
Market trends
- HPI YoY
- ▼ -151.65%
- Current HPI
- 210.3398
- Rent YoY
- —
- Metro
- Chicago-Naperville-Elgin, IL-IN-WI
- State GDP YoY
- ▲ 1.59%
- F500 in state
- 60
Industry mix (Fortune 500 HQ in IL)
| Industry | F500 HQs | Revenue |
|---|---|---|
| Insurance | 4 | $201B |
|
||
| Consumer Goods | 4 | $87B |
|
||
| Industrial Machinery | 3 | $64B |
|
||
| Healthcare | 2 | $55B |
|
||
| Retail / Pharmacy | 1 | $148B |
|
||
| Agriculture / Food | 1 | $86B |
|
||
Price history
-2.3% since first listed16 events — show timeline
- 2026-03-04 Listing Removed — MRED as Distributed by MLS Grid
- 2026-03-04 Listed $129,900 MRED as Distributed by MLS Grid
- 2026-01-12 Listing Removed — MRED as Distributed by MLS Grid
- 2026-01-12 Listed — MRED as Distributed by MLS Grid
- 2025-11-10 Listed — MRED as Distributed by MLS Grid
- 2015-07-08 Sold (Public Records) $50,000 Public Records
- 2015-06-29 Sold (MLS) $49,909 MRED as Distributed by MLS Grid
- 2015-04-30 Contingent — MRED as Distributed by MLS Grid
- 2015-04-02 Listed $49,909 MRED as Distributed by MLS Grid
- 2009-07-24 Sold (Public Records) $120,000 Public Records
- 2009-07-16 Sold (MLS) $120,000 MRED as Distributed by MLS Grid
- 2009-03-25 Price Changed $129,900 MRED as Distributed by MLS Grid
- 2008-06-30 Listed $132,900 MRED as Distributed by MLS Grid
- 2006-04-12 Sold (Public Records) $125,000 Public Records
- 2005-12-02 Listing Removed — NIRA MLS as Distributed by MLS Grid
- 2005-09-20 Listed $132,900 NIRA MLS as Distributed by MLS Grid
Property tax history
-9.2%/yrLatest (2023): $620 · -27.8% YoY. Source: county tax records.
Cash-flow waterfall
monthlySold comps — $/sqft
last 12 mo · ≤1 miLoading sold comps…