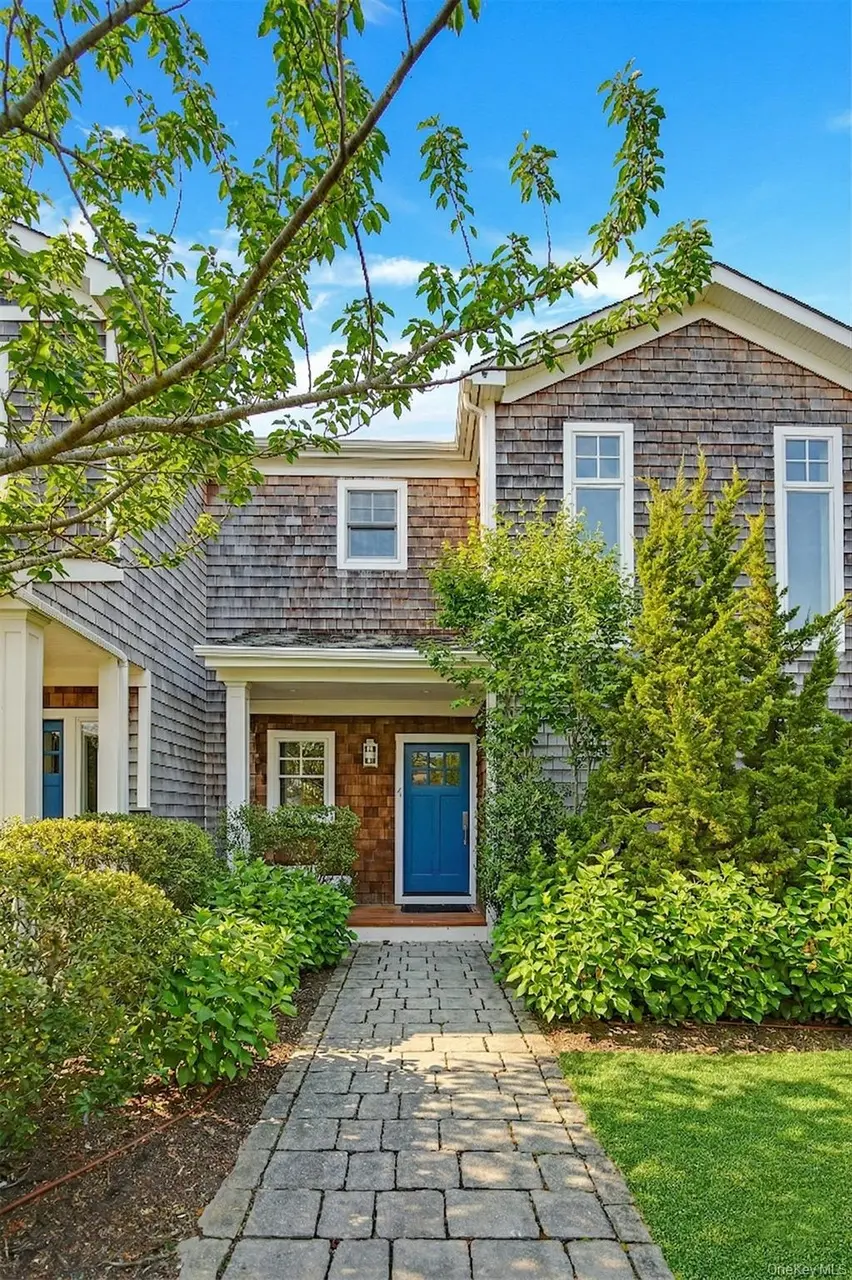
68 Foster Ave #4 · Hampton Bays, NY
Flood risk 6/10 · Moderate
- FEMA flood zone
- X (shaded)
- Chance of flooding over 30 yrs
- 0.55%
- Est. flood insurance / yr
- $473 – $860
Fire risk 1/10 · Minimal
- Est. fire insurance / yr
- $691 – $1,283
Heat risk 4/10 · Minor
- Hot days now (above 90°F)
- 8 days/yr
- Hot days in 30 yrs
- 22 days/yr
Wind risk 8/10 · Major
- Chance of severe wind over 30 yrs
- 80.0%
Air-quality risk 3/10 · Minor
- Unhealthy air days now
- 2 days/yr
- Unhealthy air days in 30 yrs
- 3 days/yr
Risk factors via First Street. Map © Google.
Why this score? — see what drove the C+ grade
The composite is a weighted blend of 9 inputs, each scored 0–100. Each bar is that input's sub-score; the figure is the points it added to the 100-point composite (weight × sub-score).
- Cash flow +20.3/30.0
- ARV discount +15.0/15.0
- DSCR +6.4/10.0
- 1% rule +5.9/10.0
- Rent growth +5.0/5.0
- Schools +4.0/10.0
- Livability +3.4/5.0
- Condition / age +2.5/5.0
- Appreciation +0.0/10.0
$615,000
🖨 Deal sheet 📄 Offer letter ✓ Due diligence
Listing remarks MLS
*** CAN NOT BE OWNER OCCUPIED. MUST RENT ANNUALLY!!! Discover a sophisticated hands-off investment in the heart of Hampton Bays. Completed in 2023, this designer townhome offers the perfect blend of modern luxury and high-demand waterfront appeal. Situated just one mile from Ponquogue Beach, this property is engineered for the discerning investor looking to capitalize on the Hamptons' year-round rental market. The Property Experience Designed to maximize its prime canal-front location, this unit offers breathtaking sunset views from both floors. Main Level: An open-concept living space that flows seamlessly onto a private canal-front deck, perfect for al fresco dining and watching the Sunset. Upper Level: The primary suite serves as a sanctuary, featuring a private waterfront balcony with panoramic views. Amenities: Residents enjoy access to a pristine gunite pool and professionally landscaped grounds within this exclusive development.
Key facts
- Waterfront balcony
- Canal front
- Gunite pool
Tags
Neighborhood map
What this means for you Summary
Snapshot
- This is a 1-bed/1.5-bath single-family listed at $615k.
Deal economics
- At list price, monthly cash flow is $789 ($9k/yr) — positive.
- The deal already cash-flows at list — no discount required.
- Meets the 1% rule at list price ($7k rent vs $615k).
- Recommended offer: $578k (6.0% below list) — sets the bar for market timing.
- Cap rate 7.8% vs local median 6.4% in Hampton Bays — meaningfully above typical; check what's discounted (condition, days-on-market, listing class) to confirm the premium yield is real.
Location & tenants
- Location reads 68/100 on livability (#551 in NY) — a middle-class / working-renter tenant base. Strengths: crime A+, employment A+, health & safety B+; Watch: amenities F, commute F, cost of living F.
- Hampton Bays Union Free School District (suburban): math 45% / reading 44% proficiency, ranked #434 of 590 in NY (top 74%) — families likely to look elsewhere, expect single-tenant / working-renter base with shorter leases.
- Market conditions: Rents rising fast (+16.1%/yr); 172 active listings in the ZIP; 3 comparable units currently listed for rent nearby; rentals at typical pace (median 25d on market — plan ~3-4 weeks tenant-placement turnaround); high-income renter base; 1,366 units permitted in Suffolk County in 2024 (216 in 5+ unit buildings).
- At $6,688/mo this rent would consume 60% of the median local household income ($134k/yr) (locally 199% of renters already pay >50% of income on rent) — very limited rent-growth headroom before tenants either downsize or default.
Forward outlook
- Local home prices are declining (-3.0%/yr); year-one equity from $4k of loan paydown is wiped out by about $18k of value loss. Plan a longer hold.
- Suffolk County population projected to shrink 5% by 2050 — rents likely to lag national; underwrite the cash flow, not the appreciation.
- At projected returns (-3.0% appreciation + 8.0% rent growth), your $172k cash investment doubles in ~9 years — after that, you're playing with house money.
Negotiation context
- It's been on market 76 days — a 6% lower offer ($578k) is reasonable based on typical stale-listing flexibility.
- 5 sale attempts since 12y ago; this cycle's ask has dropped $34k (5%) from the opening price — seller is motivated, your offer sets the floor, not the list.
Risks & watch-outs
- Climate carrying-cost: major flood risk; severe wind risk, 80% chance of damaging wind over 30y — expect insurance premiums to compound above CPI over the hold.
Questions for the listing agent
- It's been on market 76 days. Have you received any prior offers? Is the seller open to a 6% concession, seller financing, or rate buy-down credit?
- What does the HOA fee cover, when was the last increase, and are there any pending special assessments or reserve-fund shortfalls?
- Why hasn't it sold? Are there any deal-killer items the seller is aware of (foundation, flood, title, zoning, code violations)?
- Is there a deadline driving the sale (1031 exchange, divorce, estate, relocation)? That informs how much negotiation room exists.
- Schools are B-rated — typically a magnet for longer-tenancy family renters. What's the average tenant stay here, and is there a school-zone premium baked into asking?
- What's the average days-on-market for RENTAL listings here right now (not sales)? A rising rental-DOM trend means longer vacancies and softer asking-rent achievability than the comps imply.
- What's the recent tenant-quality profile in this submarket — average credit score on applications, eviction rate, late-payment / NSF rate, and stable-employment percentage? A property-management company in the area should have these aggregated.
- How much new for-sale + rental construction is in the pipeline within 1–3 miles? Heavy new supply typically softens prices + rents 12–24 months out; constrained supply supports both.
Investment metrics
- 1% rule
- 1.09% ✓
- Cap rate
- 7.83%
- Cash-on-cash
- 5.50%
- DSCR
- 1.24
- GRM
- 7.7
CMA / ARV
- ARV (median comp)
- $930,575
- List price
- $615,000
- Delta
- -33.91%
- Verdict
- UNDERPRICED
- Comps
- 3 within 1.0 mi
Show comp detail 2 sales within ~0.75 mi
| Address | Dist | Beds/Ba | Sqft | Sold | Price | $/sf | Match |
|---|---|---|---|---|---|---|---|
| 48 Foster Ave | 0.17mi | 1/1.0 | 855 (-13%) | 14mo | $740,000 | $865 | 58 |
| 39 Foster Ave | 0.30mi | 2/2.0 (+1) | 900 (-8%) | 14mo | $700,000 | $778 | 54 |
Match score weights: distance 35% · size 25% · config 20% · recency 20%. Top-matched comps best support the ARV.
Projected returns pro-forma
-3.0% appreciation · 8.0% rent growth · sell at horizon
- IRR
- -2.0%
- Equity multiple
- 0.92×
- Total profit
- $-13,827
- Equity at exit
- $91,698
- IRR
- 12.6%
- Equity multiple
- 2.25×
- Total profit
- $214,538
- Equity at exit
- $53,174
Cash invested: $172,200 (down + closing). Projections, not guarantees.
Landlord ↔ Tenant lean methodology
- Overall (STATE)
- 15 Strongly Tenant-Friendly
- State New York
- 15 Strongly Tenant-Friendly · D+10
- County
- — inherits STATE
- City
- — inherits STATE
ZIP-level market 11946
- Home prices YoY
- -20.3%
- Rents YoY
- 16.1%
- Active inventory
- 172
- Price-to-rent
- 7.7×
Monthly cashflow live
- Estimated rent
- $6,688 medium interval (Pro) →
- Mortgage (P&I)
- −$3,225
- Tax from tax record
- −$192 /mo · $2,301/yr
- Insurance
- −$256
- HOA
- −$822
- Vacancy / Maint / Mgmt
- −$1,405
- Net cashflow
- $789
Break-even live
UW: 25.0% down · 7.5% · 30yr · 1.5% tax · 5.0% vac · 8.0% maint · 8.0% mgmt
Financing live
Cash to close
- Down payment
- $153,750
- Closing costs
- $18,450
- Reserves months
- —
- Total cash needed
- —
Loan-product check · same deal, 3 products live
Conventional
25% down · 7.5% · 30yr
- Down + closing
- —
- Monthly P&I
- —
- Monthly cashflow
- —
- DSCR
- —
- Eligible?
- —
Personal DTI + credit; lowest rate.
DSCR
20% down · 8.5% · 30yr
- Down + closing
- —
- Monthly P&I
- —
- Monthly cashflow
- —
- DSCR
- —
- Eligible?
- —
No personal income docs; deal must DSCR.
Hard money
10% down · 12.0% · 12mo
- Down + closing
- —
- Monthly P&I
- —
- Monthly cashflow
- —
- DSCR
- —
- Eligible?
- —
Short-term bridge; refi at stabilization.
Rent comps 3 comps
| Address | Beds | Baths | Sqft | Rent | $/sqft | DOM | Units | Dist |
|---|---|---|---|---|---|---|---|---|
| 68 Foster Ave #12 Hampton Bays, NY | 2.0 | 1.5 | 1125 | $18,000 | $16.00 | 44d | 1 | 0.03mi |
| 25 Gardners Ln Unit A Hampton Bays, NY | 2.0 | 1.5 | 1000 | $3,750 | $3.75 | 24d | 1 | 0.32mi |
| 94 Bay Ave E Hampton Bays, NY | 2.0 | 2.0 | 1000 | $20,000 | $20.00 | 15d | 1 | 0.65mi |
HOA detail
- Monthly dues
- $822 · $9,864/yr
- Likely covers
- waterlandscapingpool
Listing history 29 events
-
2026-06-18days on market $615,000 Active 76 DOM
-
2026-06-17days on market $615,000 Active 75 DOM
-
2026-06-16days on market $615,000 Active 74 DOM
-
2026-06-15days on market $615,000 Active 73 DOM
-
2026-06-13days on market $615,000 Active 71 DOM
-
2026-06-13days on market $615,000 Active 70 DOM
-
2026-06-09days on market $615,000 Active 67 DOM
-
2026-06-08days on market $615,000 Active 66 DOM
-
2026-06-07days on market $615,000 Active 65 DOM
-
2026-06-04days on market $615,000 Active 62 DOM
-
2026-06-03days on market $615,000 Active 61 DOM
-
2026-06-02days on market $615,000 Active 60 DOM
-
2026-06-01days on market $615,000 Active 59 DOM
-
2026-05-31days on market $615,000 Active 58 DOM
-
2026-04-20price $615,000 949-char remark
Show marketing remark (949 chars)
*** CAN NOT BE OWNER OCCUPIED. MUST RENT ANNUALLY!!! Discover a sophisticated hands-off investment in the heart of Hampton Bays. Completed in 2023, this designer townhome offers the perfect blend of modern luxury and high-demand waterfront appeal. Situated just one mile from Ponquogue Beach, this property is engineered for the discerning investor looking to capitalize on the Hamptons' year-round rental market. The Property Experience Designed to maximize its prime canal-front location, this unit offers breathtaking sunset views from both floors. Main Level: An open-concept living space that flows seamlessly onto a private canal-front deck, perfect for al fresco dining and watching the Sunset. Upper Level: The primary suite serves as a sanctuary, featuring a private waterfront balcony with panoramic views. Amenities: Residents enjoy access to a pristine gunite pool and professionally landscaped grounds within this exclusive development.
-
2026-04-01$649,000 Active 949-char remark
Show marketing remark (949 chars)
*** CAN NOT BE OWNER OCCUPIED. MUST RENT ANNUALLY!!! Discover a sophisticated hands-off investment in the heart of Hampton Bays. Completed in 2023, this designer townhome offers the perfect blend of modern luxury and high-demand waterfront appeal. Situated just one mile from Ponquogue Beach, this property is engineered for the discerning investor looking to capitalize on the Hamptons' year-round rental market. The Property Experience Designed to maximize its prime canal-front location, this unit offers breathtaking sunset views from both floors. Main Level: An open-concept living space that flows seamlessly onto a private canal-front deck, perfect for al fresco dining and watching the Sunset. Upper Level: The primary suite serves as a sanctuary, featuring a private waterfront balcony with panoramic views. Amenities: Residents enjoy access to a pristine gunite pool and professionally landscaped grounds within this exclusive development.
-
2021-06-07soldstatus $17,232,832
-
2018-01-02historical
-
2017-04-14$850,000 New
-
2017-01-03historical
-
2016-04-20$850,000 New
-
2016-04-13historical
-
2015-12-17price $795,000
-
2015-10-26$825,000 New
-
2015-04-25historical
-
2014-08-09$750,000
-
2014-04-22soldstatus $4,100,000
-
2013-10-22soldstatus $2,000,000
-
2013-07-03soldstatus $2,160,000
ⓘ Source: listings_history table (triggers on properties + properties_extension) + one-shot
backfill from property_details.listing_events for pre-trigger history.
Tax reassessment forecast NY · Partial reset (capped growth)
- Current annual tax
- $2,301 · $192/mo
- Projected year-2 tax
- $6,347 · $529/mo
- Expected delta
- +$4,046/yr (+$337/mo · 175.9%)
ⓘ Screening estimate from a state-policy table — verify with the county assessor before closing.
Climate risk First Street
- Flood 6/10 Major FEMA zone X (shaded) · 55% chance over 30 yrs
- Wildfire 1/10 Low
- Heat 4/10 Moderate 8 d/yr ≥90°F today · 22 d/yr by 30 yrs out
- Wind 8/10 Severe 80% chance of damaging wind over 30 yrs
- Air quality 3/10 Moderate 2 unhealthy d/yr today · 3 by 30 yrs out
Nearby sold comps map
Loading sold comps map…
Walkable amenities ~0.75 mi
Loading nearby amenities…
Taxation est. · year 1
- Rental income
- $80,260
- − Mortgage interest
- −$34,450
- − Property taxes
- −$2,301
- − Insurance
- −$3,075
- − Repairs & maintenance
- −$6,421
- − Management
- −$6,421
- − HOA
- −$9,864
- − Depreciation
- −$17,891
- Taxable loss
- −$162
- Est. tax savings @ 24.0%
- +$39
- After-tax cash flow
- $9,503/yr
For passive investors: Depreciation is non-cash, so a rental often shows a tax loss while cash-flowing — sheltering income. Rental losses are passive: they offset passive income freely, and up to $25,000/yr can offset ordinary (W-2) income if you actively participate and your MAGI is under $100k (phasing out to $0 by $150k); unused losses carry forward. On sale, claimed depreciation is recaptured at up to 25%, and gains may owe capital-gains tax (a 1031 exchange can defer both). Figures are a year-1 estimate at your 24.0% rate — not tax advice; consult a CPA.
Schools (NCES district)
- District
- Hampton Bays Union Free School District
- NCES district ID
- 3613530
- Math proficiency
- 45% ▼ -8.00%
- Reading proficiency
- 44% ▼ -1.00%
- Median HH income
- $70,274
- Composite
- 40.18/100
- National rank
- #3788
- State rank
- #434 of 590 in NY
Livability — Hampton Bays
- Score
- 68/100
- State rank
- #551
- US rank
- #9894
Category grades
Schools grade is shown separately in the Schools card above.
Census & demographics
- Census place
- Hampton Bays, NY
- County
- Suffolk County · 679,920 people
- City population
- 15,819
- Metro
- New York-Newark-Jersey City, NY-NJ-PA
- Population (ZIP)
- 15,819
- Household income
- $133,918
- Rent vs Own
- Severe rent burden
- 199.0
Population outlook (Suffolk County) Hauer SSP2
- Today (2025)
- 1,505,262 people
- By 2030
- 1,498,318 · -0.5%
- By 2040
- 1,471,101 · -2.3%
- By 2050
- 1,424,848 · -5.3%
- By 2075
- 1,337,157 · -11.2%
- By 2100
- 1,217,720 · -19.1%
Race, ethnicity, and origin ACS 2023
- Neighborhood character
- Majority White (62%)
- Race & ethnicity
- White 62% Hispanic / Latino 32% Two or more races 13% Asian 3% Black 2%
- Hispanic origin (detail)
- Mexican 6%
- Common ancestry
- Romanian 4% Slovak 2% Portuguese 2%
- Foreign-born
- 26% · Canada, Jamaica, Guatemala
- Languages at home
- 64% English-only · Spanish 29% Other Indo-European 2% French/Haitian/Cajun 2%
Political lean MEDSL · Suffolk
- 2024 margin
- Lean R (+10.0) · D 45.0% · R 55.0%
- 2008→2024 swing
- -16.0pp toward R · 2008: 6.0pp · 2024: -10.0pp
- All cycles
- 2024: R+10.0 2020: R+0.0 2016: R+8.2 2012: D+2.9 2008: D+6.0
Not yet ingested
- Civics
- —
Market trends
- HPI YoY
- ▼ -118.82%
- Current HPI
- 467.2466
- Rent YoY
- ▲ 16.07%
- Metro
- New York-Newark-Jersey City, NY-NJ-PA
- State GDP YoY
- ▲ 2.60%
- F500 in state
- 92
Industry mix (Fortune 500 HQ in NY)
| Industry | F500 HQs | Revenue |
|---|---|---|
| Financial Services | 10 | $950B |
|
||
| Consumer Goods | 9 | $162B |
|
||
| Insurance | 4 | $225B |
|
||
| Telecommunications | 2 | $144B |
|
||
| Pharmaceuticals | 2 | $112B |
|
||
| Media / Entertainment | 2 | $69B |
|
||
Price history
-71.5% since first listed15 events — show timeline
- 2026-04-20 Price Changed $615,000 OneKey® MLS as Distributed by MLS Grid
- 2026-04-01 Listed $649,000 OneKey® MLS as Distributed by MLS Grid
- 2021-06-07 Sold (Public Records) $17,232,832 Public Records
- 2018-01-02 Listing Removed — OneKey® MLS as Distributed by MLS Grid
- 2017-04-14 Listed $850,000 OneKey® MLS as Distributed by MLS Grid
- 2017-01-03 Listing Removed — OneKey® MLS as Distributed by MLS Grid
- 2016-04-20 Listed $850,000 OneKey® MLS as Distributed by MLS Grid
- 2016-04-13 Listing Removed — OneKey® MLS as Distributed by MLS Grid
- 2015-12-17 Price Changed $795,000 OneKey® MLS as Distributed by MLS Grid
- 2015-10-26 Listed $825,000 OneKey® MLS as Distributed by MLS Grid
- 2015-04-25 Listing Removed — OneKey® MLS as Distributed by MLS Grid
- 2014-08-09 Listed $750,000 OneKey® MLS as Distributed by MLS Grid
- 2014-04-22 Sold (Public Records) $4,100,000 Public Records
- 2013-10-22 Sold (Public Records) $2,000,000 Public Records
- 2013-07-03 Sold (Public Records) $2,160,000 Public Records
Property tax history
+17.0%/yrLatest (2022): $2,301 · +0.0% YoY. Source: county tax records.
Cash-flow waterfall
monthlySold comps — $/sqft
last 12 mo · ≤1 miLoading sold comps…