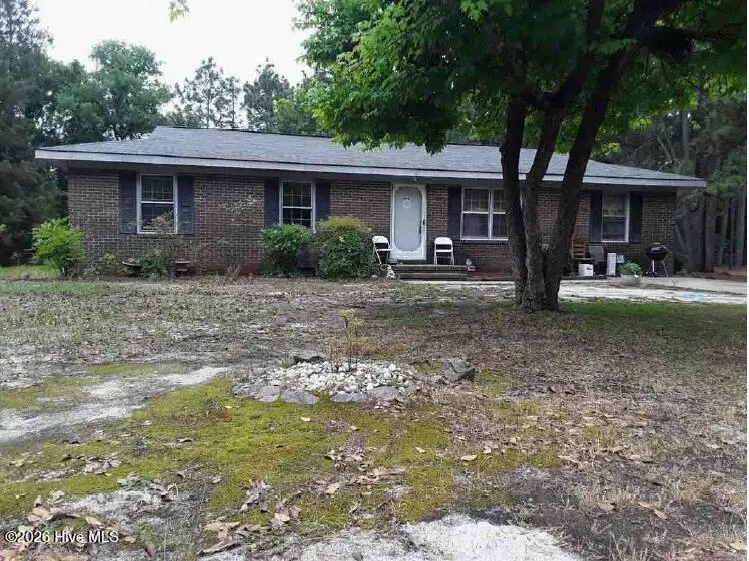
121 Forest Pl · Aberdeen, NC
Flood risk 1/10 · Minimal
- FEMA flood zone
- X (unshaded)
- Chance of flooding over 30 yrs
- 0.0%
- Est. flood insurance / yr
- $507 – $1,088
Fire risk 6/10 · Moderate
- Est. fire insurance / yr
- $906 – $1,684
Heat risk 7/10 · Major
- Hot days now (above 106°F)
- 7 days/yr
- Hot days in 30 yrs
- 16 days/yr
Wind risk 6/10 · Moderate
- Chance of severe wind over 30 yrs
- 61.0%
Air-quality risk 1/10 · Minimal
- Unhealthy air days now
- 0 days/yr
- Unhealthy air days in 30 yrs
- 0 days/yr
Risk factors via First Street. Map © Google.
Why this score? — see what drove the B grade
The composite is a weighted blend of 9 inputs, each scored 0–100. Each bar is that input's sub-score; the figure is the points it added to the 100-point composite (weight × sub-score).
- Cash flow +28.9/30.0
- ARV discount +15.0/15.0
- DSCR +10.0/10.0
- 1% rule +6.9/10.0
- Schools +4.4/10.0
- Livability +3.4/5.0
- Condition / age +2.5/5.0
- Rent growth +1.7/5.0
- Appreciation +0.0/10.0
$156,000
🖨 Deal sheet 📄 Offer letter ✓ Due diligence
Listing remarks
Great opportunity in Sherwood Park, close to all amenities the Southern Pines and Pinehurst area has to offer. Just over 1000sqft brick rancher with three bedrooms and single car(12x24) size laundry and utility and storage area. Ample level lot of almost a half acre with drive-able lot for easy truck and trailer access.
Key facts
- Brick rancher
- Drive-able lot
- Level lot
Tags
Property features AI
Exterior
- Parking: Concrete parking surface
- Utilities: No utilities listed
- Home design: Single-family residence; One level / single story; Entry on level 1; Residential zoning
- Construction: Brick veneer and frame construction; Shingle roof; Built on crawl space
- Exterior features: Front porch; Paved road access; No fencing
Interior
- Bathrooms: 1 full bathroom
- Heating & cooling: Central Air conditioning; Electric heating with heat pump
- Interior features: Crawl space basement; Has a view
Neighborhood map
What this means for you Summary
Snapshot
- This is a 3-bed/1.0-bath single-family listed at $156k.
Deal economics
- At list price, monthly cash flow is $530 ($6k/yr) — positive.
- The deal already cash-flows at list — no discount required.
- Meets the 1% rule at list price ($2k rent vs $156k).
- Cap rate 10.4% vs local median 3.0% in Aberdeen — top-decile yield for the area; either an underpriced asset or a hidden risk that comps aren't pricing in. Stress-test before assuming the spread holds.
Location & tenants
- Location reads 67/100 on livability (#218 in NC) — a middle-class / working-renter tenant base. Strengths: cost of living A+, housing A+, health & safety B+; Watch: crime D+, amenities F, commute F.
- Moore County Schools (rural): math 48% / reading 54% proficiency, ranked #58 of 178 in NC (top 33%) — acceptable for families but not a draw, mixed tenant base, ~2y average lease.
- Zoned schools: Aberdeen Elementary (math 24% / reading 34%, grade F, #1,007 of 1,410 statewide, top 72%, 629 students, 73% FRL); Southern Middle (math 30% / reading 41%, grade F, #279 of 475 statewide, top 60%, 576 students, 53% FRL); Pinecrest High (math 66% / reading 72%, grade B, #131 of 535 statewide, top 25%, 2,221 students, 34% FRL).
- Market conditions: Rents falling (-3.1%/yr); 331 active listings in the ZIP; 2 comparable units currently listed for rent nearby; solid renter incomes; 941 units permitted in Moore County in 2024 (0 in 5+ unit buildings).
Forward outlook
- Local home prices are declining (-3.0%/yr); year-one equity from $1k of loan paydown is wiped out by about $5k of value loss. Plan a longer hold.
- Moore County population projected at +29% by 2050 — long-run rental-demand tailwind backs the buy-and-hold thesis.
Negotiation context
- Only 13 days on market — expect competitive offers; lowballing is unlikely to land.
Risks & watch-outs
- Climate carrying-cost: major wind risk, 61% chance of damaging wind over 30y; major wildfire risk; extreme-heat days projected 7→16/yr by 2055 (HVAC capex compounding) — expect insurance premiums to compound above CPI over the hold.
Questions for the listing agent
- Built in 1979 — when were the roof, HVAC, electrical panel, plumbing, and water heater last replaced?
- Is there a deadline driving the sale (1031 exchange, divorce, estate, relocation)? That informs how much negotiation room exists.
- Schools are D-rated, which usually means shorter tenancies and higher turnover. Who's the typical renter profile here, and what's been the actual vacancy rate?
- Crime grade is D in this area — have there been break-ins, vandalism, or insurance claims at this property in the last 3 years? What carrier currently insures it and at what premium?
- What's the average days-on-market for RENTAL listings here right now (not sales)? A rising rental-DOM trend means longer vacancies and softer asking-rent achievability than the comps imply.
- What's the recent tenant-quality profile in this submarket — average credit score on applications, eviction rate, late-payment / NSF rate, and stable-employment percentage? A property-management company in the area should have these aggregated.
- How much new for-sale + rental construction is in the pipeline within 1–3 miles? Heavy new supply typically softens prices + rents 12–24 months out; constrained supply supports both.
Investment metrics
- 1% rule
- 1.19% ✓
- Cap rate
- 10.37%
- Cash-on-cash
- 14.57%
- DSCR
- 1.65
- GRM
- 7.0
CMA / ARV
- ARV (on-the-fly)
- $309,400
- Comps found
- 2
Show comp detail 2 sales within ~0.75 mi
| Address | Dist | Beds/Ba | Sqft | Sold | Price | $/sf | Match |
|---|---|---|---|---|---|---|---|
| 111 Sherwood Dr | 0.33mi | 3/2.0 | 1,280 (-2%) | 18mo | $304,920 | $238 | 63 |
| 435 Sand Pit Rd | 0.68mi | 3/1.0 | 1,357 (+4%) | 5mo | $282,500 | $208 | 57 |
Match score weights: distance 35% · size 25% · config 20% · recency 20%. Top-matched comps best support the ARV.
Projected returns pro-forma
-3.0% appreciation · 0.0% rent growth · sell at horizon
- IRR
- 1.9%
- Equity multiple
- 1.07×
- Total profit
- $3,006
- Equity at exit
- $23,260
- IRR
- 8.5%
- Equity multiple
- 1.57×
- Total profit
- $24,852
- Equity at exit
- $13,488
Cash invested: $43,680 (down + closing). Projections, not guarantees.
Landlord ↔ Tenant lean methodology
- Overall (STATE)
- 85 Strongly Landlord-Friendly
- State North Carolina
- 85 Strongly Landlord-Friendly · R+3
- County
- — inherits STATE
- City
- — inherits STATE
ZIP-level market 28315
- Home prices YoY
- -31.4%
- Rents YoY
- -3.1%
- Active inventory
- 331
- Price-to-rent
- 7.0×
Monthly cashflow live
- Estimated rent
- $1,857 medium interval (Pro) →
- Mortgage (P&I)
- −$818
- Tax from tax record
- −$53 /mo · $641/yr
- Insurance
- −$65
- HOA
- −$0
- Vacancy / Maint / Mgmt
- −$390
- Net cashflow
- $530
Break-even live
UW: 25.0% down · 7.5% · 30yr · 1.5% tax · 5.0% vac · 8.0% maint · 8.0% mgmt
Financing live
Cash to close
- Down payment
- $39,000
- Closing costs
- $4,680
- Reserves months
- —
- Total cash needed
- —
Loan-product check · same deal, 3 products live
Conventional
25% down · 7.5% · 30yr
- Down + closing
- —
- Monthly P&I
- —
- Monthly cashflow
- —
- DSCR
- —
- Eligible?
- —
Personal DTI + credit; lowest rate.
DSCR
20% down · 8.5% · 30yr
- Down + closing
- —
- Monthly P&I
- —
- Monthly cashflow
- —
- DSCR
- —
- Eligible?
- —
No personal income docs; deal must DSCR.
Hard money
10% down · 12.0% · 12mo
- Down + closing
- —
- Monthly P&I
- —
- Monthly cashflow
- —
- DSCR
- —
- Eligible?
- —
Short-term bridge; refi at stabilization.
Rent comps 2 comps
| Address | Beds | Baths | Sqft | Rent | $/sqft | DOM | Units | Dist |
|---|---|---|---|---|---|---|---|---|
| 315 W Craven Ave Pinebluff, NC | 3.0 | 2.0 | 1610 | $1,900 | $1.18 | 23d | 1 | 1.05mi |
| 735 W Philadelphia Ave Pinebluff, NC | 3.0 | 1.0 | 960 | $1,500 | $1.56 | 23d | 1 | 1.46mi |
Listing history 12 events
-
2026-06-19days on market $156,000 Active 13 DOM
-
2026-06-18days on market $156,000 Active 12 DOM
-
2026-06-17days on market $156,000 Active 11 DOM
-
2026-06-16days on market $156,000 Active 10 DOM
-
2026-06-15days on market $156,000 Active 9 DOM
-
2026-06-14days on market $156,000 Active 7 DOM
-
2026-06-13days on market $156,000 Active 6 DOM
-
2026-06-10days on market $156,000 Active 4 DOM
-
2026-06-09days on market $156,000 Active 3 DOM
-
2026-06-08days on market $156,000 Active 2 DOM
-
2026-06-07remarks 321-char remark
-
2026-06-07$156,000 Active 1 DOM
ⓘ Source: listings_history table (triggers on properties + properties_extension) + one-shot
backfill from property_details.listing_events for pre-trigger history.
Tax reassessment forecast NC · Resets to sale price
- Current annual tax
- $641 · $53/mo
- Projected year-2 tax
- $1,279 · $107/mo
- Expected delta
- +$638/yr (+$53/mo · 99.7%)
ⓘ Screening estimate from a state-policy table — verify with the county assessor before closing.
Climate risk First Street
- Flood 1/10 Low FEMA zone X (unshaded) · 0% chance over 30 yrs
- Wildfire 6/10 Major
- Heat 7/10 Severe 7 d/yr ≥106°F today · 16 d/yr by 30 yrs out
- Wind 6/10 Major 61% chance of damaging wind over 30 yrs
- Air quality 1/10 Low 0 unhealthy d/yr today · 0 by 30 yrs out
Nearby sold comps map
Loading sold comps map…
Walkable amenities ~0.75 mi
Loading nearby amenities…
Taxation est. · year 1
- Rental income
- $22,283
- − Mortgage interest
- −$8,738
- − Property taxes
- −$641
- − Insurance
- −$780
- − Repairs & maintenance
- −$1,783
- − Management
- −$1,783
- − Depreciation
- −$4,538
- Taxable income
- $4,020
- Est. tax owed @ 24.0%
- −$965
- After-tax cash flow
- $5,401/yr
For passive investors: Depreciation is non-cash, so a rental often shows a tax loss while cash-flowing — sheltering income. Rental losses are passive: they offset passive income freely, and up to $25,000/yr can offset ordinary (W-2) income if you actively participate and your MAGI is under $100k (phasing out to $0 by $150k); unused losses carry forward. On sale, claimed depreciation is recaptured at up to 25%, and gains may owe capital-gains tax (a 1031 exchange can defer both). Figures are a year-1 estimate at your 24.0% rate — not tax advice; consult a CPA.
Schools (NCES district)
- District
- Moore County Schools
- NCES district ID
- 3703090
- Math proficiency
- 48% ▲ 5.00%
- Reading proficiency
- 54% ▲ 5.00%
- Median HH income
- $50,333
- Composite
- 43.63/100
- National rank
- #2967
- State rank
- #58 of 178 in NC
Livability — Aberdeen
- Score
- 67/100
- State rank
- #218
- US rank
- #10383
Category grades
Schools grade is shown separately in the Schools card above.
Census & demographics
- County
- Moore County · 75,247 people
- City population
- 14,084
- Metro
- Pinehurst-Southern Pines, NC
- Population (ZIP)
- 14,084
- Household income
- $77,418
- Rent vs Own
- Severe rent burden
- 132.0
Population outlook (Moore County) Hauer SSP2
- Today (2025)
- 106,902 people
- By 2030
- 113,134 · +5.8%
- By 2040
- 125,682 · +17.6%
- By 2050
- 137,811 · +28.9%
- By 2075
- 164,387 · +53.8%
- By 2100
- 175,595 · +64.3%
Race, ethnicity, and origin ACS 2023
- Neighborhood character
- Majority White (65%)
- Race & ethnicity
- White 65% Black 19% Two or more races 6% Hispanic / Latino 3% Asian 3% Native American 2%
- Common ancestry
- Slovak 4% Romanian 3% Iranian 3%
- Foreign-born
- 5% · Vietnam, Canada, Jamaica
- Languages at home
- 93% English-only · Spanish 4% Vietnamese 2% Tagalog/Filipino 1%
Political lean MEDSL · Moore
- 2024 margin
- Strong R (+29.5) · D 34.8% · R 64.3%
- 2008→2024 swing
- -8.1pp toward R · 2008: -21.4pp · 2024: -29.5pp
- All cycles
- 2024: R+29.5 2020: R+27.4 2016: R+29.6 2012: R+28.1 2008: R+21.4
Not yet ingested
- Civics
- —
Market trends
- HPI YoY
- ▼ -90.02%
- Current HPI
- 197.0027
- Rent YoY
- ▼ -3.10%
- Metro
- Pinehurst-Southern Pines, NC
- State GDP YoY
- ▲ 3.28%
- F500 in state
- 26
Industry mix (Fortune 500 HQ in NC)
| Industry | F500 HQs | Revenue |
|---|---|---|
| Financial Services | 2 | $213B |
|
||
| Retail | 2 | $95B |
|
||
| Industrial Conglomerate | 1 | $38B |
|
||
| Metals / Steel | 1 | $35B |
|
||
| Utilities | 1 | $30B |
|
||
| Industrial Machinery | 1 | $19B |
|
||
Price history
-36.3% since first listed2 events — show timeline
- 2026-06-06 Listed $156,000 Hive MLS
- 2017-09-05 Sold (Public Records) $245,000 Public Records
Property tax history
+2.1%/yrLatest (2024): $641 · -4.4% YoY. Source: county tax records.
Cash-flow waterfall
monthlySold comps — $/sqft
last 12 mo · ≤1 miLoading sold comps…