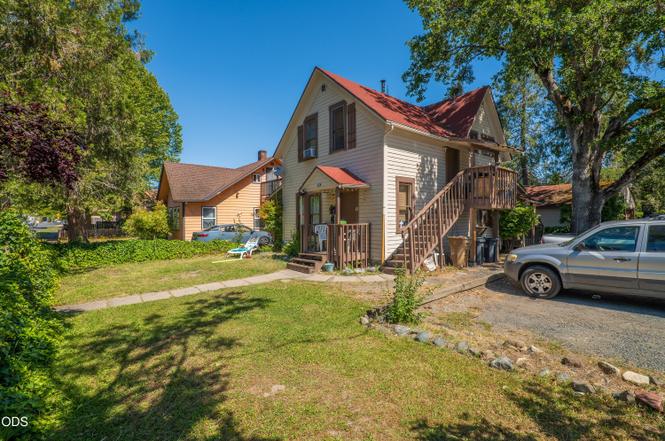
324 NE D St · Grants Pass, OR
Flood risk 1/10 · Minimal
- FEMA flood zone
- X (unshaded)
- Chance of flooding over 30 yrs
- 0.0%
- Est. flood insurance / yr
- $507 – $1,088
Fire risk 8/10 · Major
- Est. fire insurance / yr
- $498 – $926
Heat risk 6/10 · Moderate
- Hot days now (above 98°F)
- 7 days/yr
- Hot days in 30 yrs
- 15 days/yr
Wind risk 1/10 · Minimal
- Chance of severe wind over 30 yrs
- —
Air-quality risk 10/10 · Severe
- Unhealthy air days now
- 28 days/yr
- Unhealthy air days in 30 yrs
- 30 days/yr
Risk factors via First Street. Map © Google.
Why this score? — see what drove the D grade
The composite is a weighted blend of 9 inputs, each scored 0–100. Each bar is that input's sub-score; the figure is the points it added to the 100-point composite (weight × sub-score).
- Cash flow +13.7/30.0
- ARV discount +7.5/15.0
- Schools +4.2/10.0
- DSCR +4.1/10.0
- Livability +3.5/5.0
- 1% rule +3.2/10.0
- Rent growth +3.0/5.0
- Condition / age +2.5/5.0
- Appreciation +0.0/10.0
$270,000
🖨 Deal sheet (PDF) 📄 Offer letter ✓ Due diligence
Listing remarks
Triplex featuring three 1-bedroom, 1-bath units in a convenient location close to downtown amenities, shopping, dining, and services. This property offers excellent potential for investors looking to add value and build equity. With solid rental possibilities and room for your vision and improvements, this is an opportunity to customize and maximize returns. Whether you're expanding your portfolio or looking for your next project, this income-producing property offers plenty of upside potential. Don't miss the chance to unlock the possibilities!
Key facts
- 4,791 sq ft lot
- Parking
- Built 1900
Property features AI
Finance
- Financial info: Three rental units with current monthly rents: Unit 1 $325, Unit 2 $500, Unit 3 $500
- HOA & community: No CCRs
Exterior
- Parking: Alley access; Driveway; Parking lot; Three additional parking spaces
- Utilities: Public water; Public sewer; Electricity connected; Natural gas connected
- Home design: Residential income property (Triplex); Two levels; Shared/2+ common walls
- Construction: Built in 1900; Frame construction; Concrete perimeter foundation
- Exterior features: Composition roof; R-4 zoning
Interior
- Bedrooms: Three separate 1-bedroom units (Unit 1, Unit 2, Unit 3)
- Flooring: Carpet
- Bathrooms: Each unit has 1 full bathroom
- Heating & cooling: Baseboard heating; Electric heating; Natural gas heating; Wall/window cooling units
- Interior features: Carpet flooring
Neighborhood map
What this means for you Summary
Snapshot
- This is a 9-bed/3.0-bath other listed at $270k.
Deal economics
- At list price, monthly cash flow is $21 ($253/yr) — positive.
- The deal already cash-flows at list — no discount required.
- To meet the 1% rule (rent ≥ 1% of price), the offer needs to be $221k (18.2% below list).
- Recommended offer: $221k (18.2% below list) — sets the bar for 1% rule.
- Cap rate 6.4% vs local median 3.2% in Grants Pass — top-decile yield for the area; either an underpriced asset or a hidden risk that comps aren't pricing in. Stress-test before assuming the spread holds.
Location & tenants
- Location reads 70/100 on livability (#137 in OR) — a middle-class / working-renter tenant base. Strengths: amenities A+, health & safety A+, housing A-; Watch: employment D, crime F, commute F.
- Grants Pass SD 7 (urban): math 39% / reading 56% proficiency, ranked #66 of 183 in OR (top 36%) — families likely to look elsewhere, expect single-tenant / working-renter base with shorter leases.
- Zoned schools: Lincoln Elementary School (415 students, 59% FRL); North Middle School (math 75% / reading 75%, grade A, #6 of 128 statewide, top 4%, 710 students, 69% FRL); Grants Pass High School (1,722 students, 68% FRL).
- Zoned-school proficiency averages 75% at this address vs 48% district-wide (+28 pts) — the actual schools serving this property are materially stronger than the Grants Pass SD 7 average implies; a family-tenant draw the district grade alone would hide.
- Market conditions: Rents rising (+2.0%/yr); 163 active listings in the ZIP; 223 units permitted in Josephine County in 2024 (5 in 5+ unit buildings).
- This rent runs 43% of the median local income ($61k/yr) — at the standard rent-burdened threshold; future hikes will face affordability resistance.
Forward outlook
- Local home prices are declining (-3.0%/yr); year-one equity from $2k of loan paydown is wiped out by about $8k of value loss. Plan a longer hold.
- Josephine County population projected at +3% by 2050 — modest demand growth; plan on rents tracking national, not racing it.
Negotiation context
- Only 3 days on market — expect competitive offers; lowballing is unlikely to land.
- Current owner paid $84k; list at $270k implies a 220% gain — meaningful room to come down on a strong offer.
Risks & watch-outs
- Watch-outs: built in 1900 — expect roof / HVAC / electrical / plumbing capex.
- Climate carrying-cost: severe wildfire risk; extreme-heat days projected 7→15/yr by 2055 (HVAC capex compounding) — expect insurance premiums to compound above CPI over the hold.
Questions for the listing agent
- Built in 1900 — when were the roof, HVAC, electrical panel, plumbing, and water heater last replaced?
- Is there a deadline driving the sale (1031 exchange, divorce, estate, relocation)? That informs how much negotiation room exists.
- Schools are D-rated, which usually means shorter tenancies and higher turnover. Who's the typical renter profile here, and what's been the actual vacancy rate?
- Crime grade is F in this area — have there been break-ins, vandalism, or insurance claims at this property in the last 3 years? What carrier currently insures it and at what premium?
- The area grade is low — what's the realistic commute time and amenity access for the typical tenant pool here? Any planned neighborhood developments (good or bad) we should know about?
- What's the average days-on-market for RENTAL listings here right now (not sales)? A rising rental-DOM trend means longer vacancies and softer asking-rent achievability than the comps imply.
- What's the recent tenant-quality profile in this submarket — average credit score on applications, eviction rate, late-payment / NSF rate, and stable-employment percentage? A property-management company in the area should have these aggregated.
- How much new for-sale + rental construction is in the pipeline within 1–3 miles? Heavy new supply typically softens prices + rents 12–24 months out; constrained supply supports both.
Investment metrics
- 1% rule
- 0.82% ✗
- Cap rate
- 6.39%
- Cash-on-cash
- 0.33%
- DSCR
- 1.01
- GRM
- 10.2
CMA / ARV
No comps found within radius.
Projected returns pro-forma
-3.0% appreciation · 2.04% rent growth · sell at horizon
- IRR
- -16.8%
- Equity multiple
- 0.41×
- Total profit
- $-44,578
- Equity at exit
- $40,258
- IRR
- -10.4%
- Equity multiple
- 0.39×
- Total profit
- $-45,814
- Equity at exit
- $23,345
Cash invested: $75,600 (down + closing). Projections, not guarantees.
Landlord ↔ Tenant lean methodology
- Overall (STATE)
- 28 Tenant-Leaning
- State Oregon
- 28 Tenant-Leaning · D+6
- County
- — inherits STATE
- City
- — inherits STATE
ZIP-level market 97526
- Rents YoY
- 2.0%
- Active inventory
- 163
- Price-to-rent
- 10.2×
Monthly cashflow live
- Estimated rent
- $2,208 medium interval (Pro) →
- Mortgage (P&I)
- −$1,416
- Tax from tax record
- −$195 /mo · $2,340/yr
- Insurance
- −$112
- HOA
- −$0
- Lot rent
- −$0
- Vacancy / Maint / Mgmt
- −$464
- Net cashflow
- $21
Break-even live
Sensitivity live
| Price | -10% $174 | -5% $97 | +0% $21 | +5% $-55 | +10% $-132 |
|---|---|---|---|---|---|
| Rent | -10% $-153 | -5% $-66 | +0% $21 | +5% $108 | +10% $196 |
| Rate | -1.0pp $157 | -0.5pp $90 | base $21 | +0.5pp $-49 | +1.0pp $-120 |
UW: 25.0% down · 7.5% · 30yr · 1.5% tax · 5.0% vac · 8.0% maint · 8.0% mgmt
Financing live
Cash to close
- Down payment
- $67,500
- Closing costs
- $8,100
- Reserves months
- —
- Total cash needed
- —
Loan-product check · same deal, 3 products live
Conventional
25% down · 7.5% · 30yr
- Down + closing
- —
- Monthly P&I
- —
- Monthly cashflow
- —
- DSCR
- —
- Eligible?
- —
Personal DTI + credit; lowest rate.
DSCR
20% down · 8.5% · 30yr
- Down + closing
- —
- Monthly P&I
- —
- Monthly cashflow
- —
- DSCR
- —
- Eligible?
- —
No personal income docs; deal must DSCR.
Hard money
10% down · 12.0% · 12mo
- Down + closing
- —
- Monthly P&I
- —
- Monthly cashflow
- —
- DSCR
- —
- Eligible?
- —
Short-term bridge; refi at stabilization.
Listing history 3 events
-
2026-06-21days on market $270,000 Active 3 DOM
-
2026-06-18remarks 551-char remark
-
2026-06-18$270,000 Active 1 DOM
ⓘ Source: listings_history table (triggers on properties + properties_extension) + one-shot
backfill from property_details.listing_events for pre-trigger history.
Tax reassessment forecast OR · Resets to sale price
- Current annual tax
- $2,340 · $195/mo
- Projected year-2 tax
- $2,619 · $218/mo
- Expected delta
- +$279/yr (+$23/mo · 11.9%)
ⓘ Screening estimate from a state-policy table — verify with the county assessor before closing.
Climate risk First Street
- Flood 1/10 Low FEMA zone X (unshaded) · 0% chance over 30 yrs
- Wildfire 8/10 Severe
- Heat 6/10 Major 7 d/yr ≥98°F today · 15 d/yr by 30 yrs out
- Wind 1/10 Low
- Air quality 10/10 Extreme 28 unhealthy d/yr today · 30 by 30 yrs out
Nearby sold comps map
Loading sold comps map…
Walkable amenities ~0.75 mi
Loading nearby amenities…
Taxation est. · year 1
- Rental income
- $26,498
- − Mortgage interest
- −$15,124
- − Property taxes
- −$2,340
- − Insurance
- −$1,350
- − Repairs & maintenance
- −$2,120
- − Management
- −$2,120
- − Depreciation
- −$7,855
- Taxable loss
- −$4,410
- Est. tax savings @ 24.0%
- +$1,058
- After-tax cash flow
- $1,311/yr
For passive investors: Depreciation is non-cash, so a rental often shows a tax loss while cash-flowing — sheltering income. Rental losses are passive: they offset passive income freely, and up to $25,000/yr can offset ordinary (W-2) income if you actively participate and your MAGI is under $100k (phasing out to $0 by $150k); unused losses carry forward. On sale, claimed depreciation is recaptured at up to 25%, and gains may owe capital-gains tax (a 1031 exchange can defer both). Figures are a year-1 estimate at your 24.0% rate — not tax advice; consult a CPA.
Schools (NCES district)
- District
- Grants Pass SD 7
- NCES district ID
- 4105910
- Math proficiency
- 39% ▲ 1.00%
- Reading proficiency
- 56% ▬ 0.00%
- Median HH income
- $36,433
- Composite
- 41.5/100
- National rank
- #7281
- State rank
- #66 of 183 in OR
Livability — Grants Pass
- Score
- 70/100
- State rank
- #137
- US rank
- #7900
Category grades
Schools grade is shown separately in the Schools card above.
Census & demographics
- Census place
- Grants Pass, OR
- County
- Josephine County · 73,366 people
- City population
- 73,366
- Metro
- Grants Pass, OR
- Population (ZIP)
- 36,036
- Household income
- $61,019
- Rent vs Own
- Severe rent burden
- 1407.0
Population outlook (Josephine County) Hauer SSP2
- Today (2025)
- 87,883 people
- By 2030
- 89,055 · +1.3%
- By 2040
- 90,396 · +2.9%
- By 2050
- 90,801 · +3.3%
- By 2075
- 89,880 · +2.3%
- By 2100
- 81,252 · -7.5%
Race, ethnicity, and origin ACS 2023
- Neighborhood character
- Predominantly White (84%)
- Race & ethnicity
- White 84% Two or more races 8% Hispanic / Latino 8%
- Hispanic origin (detail)
- Mexican 6%
- Common ancestry
- Portuguese 3% Slovak 3% Italian 2%
- Foreign-born
- 3% · Canada
- Languages at home
- 96% English-only · Spanish 2%
Political lean MEDSL · Josephine
- 2024 margin
- Strong R (+29.1) · D 34.2% · R 63.3% · Other 2.5%
- 2008→2024 swing
- -15.8pp toward R · 2008: -13.2pp · 2024: -29.1pp
- All cycles
- 2024: R+29.1 2020: R+25.8 2016: R+31.4 2012: R+21.9 2008: R+13.2
Not yet ingested
- Civics
- —
Market trends
- HPI YoY
- ▼ -257.77%
- Current HPI
- 326.3247
- Rent YoY
- ▲ 2.04%
- Metro
- Grants Pass, OR
- State GDP YoY
- ▲ 2.05%
- F500 in state
- 2
Industry mix (Fortune 500 HQ in OR)
| Industry | F500 HQs | Revenue |
|---|---|---|
| Consumer Goods | 1 | $51B |
|
||
Price history
+219.5% since first listed2 events — show timeline
- 2026-06-18 Listed $270,000 MLSCO
- 1995-10-01 Sold (Public Records) $84,500 Public Records
Property tax history
+3.6%/yrLatest (2025): $2,340 · +6.2% YoY. Source: county tax records.
Cash-flow waterfall
monthlySold comps — $/sqft
last 12 mo · ≤1 miLoading sold comps…