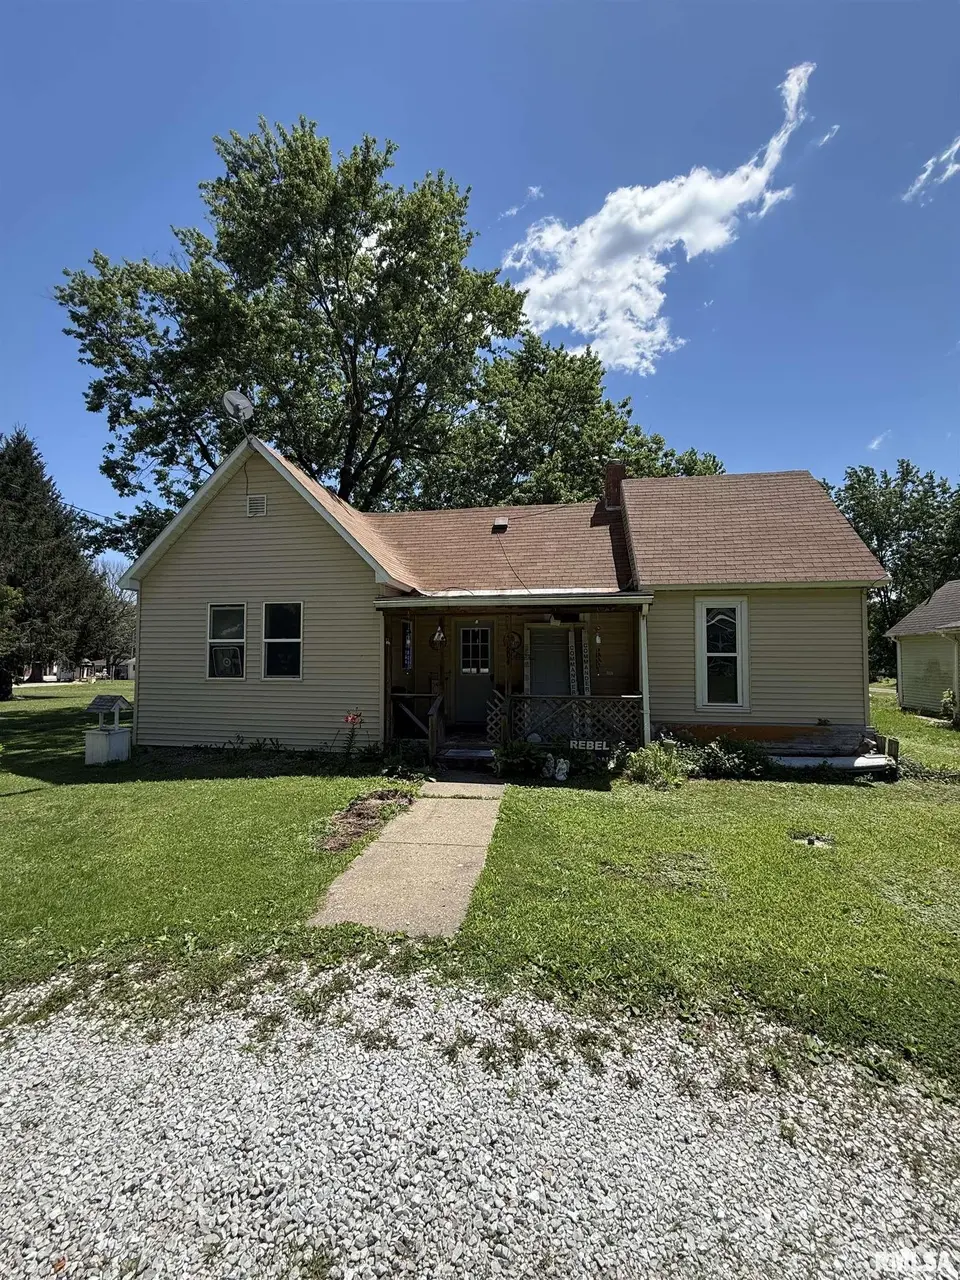
504 N Market St · Astoria, IL
Flood risk 1/10 · Minimal
- FEMA flood zone
- X (unshaded)
- Chance of flooding over 30 yrs
- 0.0%
- Est. flood insurance / yr
- $507 – $1,088
Fire risk 1/10 · Minimal
- Est. fire insurance / yr
- $804 – $1,492
Heat risk 3/10 · Minor
- Hot days now (above 105°F)
- 7 days/yr
- Hot days in 30 yrs
- 18 days/yr
Wind risk 2/10 · Minimal
- Chance of severe wind over 30 yrs
- 1.0%
Air-quality risk 2/10 · Minimal
- Unhealthy air days now
- 1 days/yr
- Unhealthy air days in 30 yrs
- 1 days/yr
Risk factors via First Street. Map © Google.
Why this score? — see what drove the B grade
The composite is a weighted blend of 9 inputs, each scored 0–100. Each bar is that input's sub-score; the figure is the points it added to the 100-point composite (weight × sub-score).
- Cash flow +30.0/30.0
- 1% rule +10.0/10.0
- DSCR +10.0/10.0
- ARV discount +7.5/15.0
- Appreciation +6.4/10.0
- Livability +3.1/5.0
- Rent growth +2.5/5.0
- Condition / age +2.5/5.0
- Schools +1.9/10.0
$49,900
🖨 Deal sheet 📄 Offer letter ✓ Due diligence
Listing remarks MLS
This 2 bedroom ranch is ready for you. Prior owner completely remodeled in 2014 and current owner has added his touches to make this home move-in ready. Stove/oven and refrigerator will stay (not warranted). Heil furnace and electric water heater are located on main floor. Condensation pump located in basement (with basement entry on exterior of home).
Key facts
- Solar panels on roof
- Shed included
- 8,775 sq ft lot
Tags
Property features AI
Finance
- Other: Lot dimensions approximately 65 x 135
- HOA & community: No association fee
Exterior
- Parking: On-street parking; Gravel parking areas
- Utilities: Public water; Public sewer
- Home design: Single family residence; One-story primary living with additional levels including upper, lower and basement
- Construction: Shingle roof; Building area listed as 1072; Year built not available
- Exterior features: Level lot; Shed(s); Paved road access
Interior
- Kitchen: Kitchen with vinyl flooring
- Bedrooms: Two bedrooms on the main level (approx. 14 x 11.9 and 11.3 x 10.2); Additional possible bedroom/storage on main level (approx. 10.9 x 9.11)
- Flooring: Carpet in bedrooms and some rooms; Laminate in living room; Vinyl in kitchen
- Bathrooms: One full bathroom
- Heating & cooling: Forced air heating; Central air conditioning
- Interior features: Partial, unfinished basement; Refrigerator included; No fireplaces
- Laundry & utility: Electric water heater
Neighborhood map
What this means for you Summary
Snapshot
- This is a 2-bed/1.0-bath other listed at $50k.
Deal economics
- At list price, monthly cash flow is $378 ($5k/yr) — positive.
- The deal already cash-flows at list — no discount required.
- Meets the 1% rule at list price ($958 rent vs $50k).
Location & tenants
- Location reads 61/100 on livability (#904 in IL) — a middle-class / working-renter tenant base. Strengths: cost of living A+, crime A, housing A; Watch: amenities F, commute F, employment F.
- Astoria CUSD 1 (rural): math 6% / reading 30% proficiency, ranked #739 of 919 in IL (top 80%) — low school quality limits family demand, transient renter base, plan for 1-2y turnover.
- Zoned schools: Astoria High School (math 10% / reading 30%, grade F, #357 of 693 statewide, top 54%, 73 students, 0% FRL) — zoned schools average 0% FRL vs 45% district-wide (45 pts lower); this property's tenant base skews higher-income than the district average.
- Market conditions: 11 active listings in the ZIP; 14 units permitted in Fulton County in 2024 (0 in 5+ unit buildings).
Forward outlook
- In year one you build about $2k of equity ($345 loan paydown + $1k appreciation (2.7% local appreciation)).
- Fulton County population projected at -20% by 2050 — secular population decline; favor cash flow + early exit over multi-decade hold.
- At projected returns (2.7% appreciation + 3.0% rent growth), your $14k cash investment doubles in ~3 years — after that, you're playing with house money.
Negotiation context
- Only 1 days on market — expect competitive offers; lowballing is unlikely to land.
- 3 sale attempts since 11y ago with the ask held roughly flat each time — persistent listings suggest the price (not the market) is what's stuck; bring a comps-based counter.
Risks & watch-outs
- Watch-outs: built in 1920 — expect roof / HVAC / electrical / plumbing capex.
Questions for the listing agent
- Built in 1920 — when were the roof, HVAC, electrical panel, plumbing, and water heater last replaced?
- Is there a deadline driving the sale (1031 exchange, divorce, estate, relocation)? That informs how much negotiation room exists.
- Schools are F-rated, which usually means shorter tenancies and higher turnover. Who's the typical renter profile here, and what's been the actual vacancy rate?
- What's the average days-on-market for RENTAL listings here right now (not sales)? A rising rental-DOM trend means longer vacancies and softer asking-rent achievability than the comps imply.
- What's the recent tenant-quality profile in this submarket — average credit score on applications, eviction rate, late-payment / NSF rate, and stable-employment percentage? A property-management company in the area should have these aggregated.
- How much new for-sale + rental construction is in the pipeline within 1–3 miles? Heavy new supply typically softens prices + rents 12–24 months out; constrained supply supports both.
Investment metrics
- 1% rule
- 1.92% ✓
- Cap rate
- 15.39%
- Cash-on-cash
- 32.48%
- DSCR
- 2.45
- GRM
- 4.3
CMA / ARV
No comps found within radius.
Projected returns pro-forma
2.73% appreciation · 3.0% rent growth · sell at horizon
- IRR
- 37.8%
- Equity multiple
- 3.11×
- Total profit
- $29,418
- Equity at exit
- $21,679
- IRR
- 38.1%
- Equity multiple
- 6.15×
- Total profit
- $71,925
- Equity at exit
- $32,833
Cash invested: $13,972 (down + closing). Projections, not guarantees.
Landlord ↔ Tenant lean methodology
- Overall (STATE)
- 43 Moderately Tenant-Leaning
- State Illinois
- 43 Moderately Tenant-Leaning · D+7
- County
- — inherits STATE
- City
- — inherits STATE
ZIP-level market 61501
- Home prices YoY
- 2.2%
- Active inventory
- 11
- Price-to-rent
- 4.3×
Monthly cashflow live
- Estimated rent
- $958 medium interval (Pro) →
- Mortgage (P&I)
- −$262
- Tax from tax record
- −$97 /mo · $1,159/yr
- Insurance
- −$21
- HOA
- −$0
- Vacancy / Maint / Mgmt
- −$201
- Net cashflow
- $378
Break-even live
UW: 25.0% down · 7.5% · 30yr · 1.5% tax · 5.0% vac · 8.0% maint · 8.0% mgmt
Financing live
Cash to close
- Down payment
- $12,475
- Closing costs
- $1,497
- Reserves months
- —
- Total cash needed
- —
Loan-product check · same deal, 3 products live
Conventional
25% down · 7.5% · 30yr
- Down + closing
- —
- Monthly P&I
- —
- Monthly cashflow
- —
- DSCR
- —
- Eligible?
- —
Personal DTI + credit; lowest rate.
DSCR
20% down · 8.5% · 30yr
- Down + closing
- —
- Monthly P&I
- —
- Monthly cashflow
- —
- DSCR
- —
- Eligible?
- —
No personal income docs; deal must DSCR.
Hard money
10% down · 12.0% · 12mo
- Down + closing
- —
- Monthly P&I
- —
- Monthly cashflow
- —
- DSCR
- —
- Eligible?
- —
Short-term bridge; refi at stabilization.
Listing history 2 events
-
2026-06-18remarks 265-char remark
-
2026-06-18$49,900 Active 1 DOM
ⓘ Source: listings_history table (triggers on properties + properties_extension) + one-shot
backfill from property_details.listing_events for pre-trigger history.
Tax reassessment forecast IL · Partial reset (capped growth)
- Current annual tax
- $1,159 · $97/mo
- Projected year-2 tax
- $1,159 · $97/mo
- Expected delta
- $0/yr ($0/mo · 0.0%)
ⓘ Screening estimate from a state-policy table — verify with the county assessor before closing.
Climate risk First Street
- Flood 1/10 Low FEMA zone X (unshaded) · 0% chance over 30 yrs
- Wildfire 1/10 Low
- Heat 3/10 Moderate 7 d/yr ≥105°F today · 18 d/yr by 30 yrs out
- Wind 2/10 Low 100% chance of damaging wind over 30 yrs
- Air quality 2/10 Low 1 unhealthy d/yr today · 1 by 30 yrs out
Nearby sold comps map
Loading sold comps map…
Walkable amenities ~0.75 mi
Loading nearby amenities…
Taxation est. · year 1
- Rental income
- $11,502
- − Mortgage interest
- −$2,795
- − Property taxes
- −$1,159
- − Insurance
- −$250
- − Repairs & maintenance
- −$920
- − Management
- −$920
- − Depreciation
- −$1,452
- Taxable income
- $4,006
- Est. tax owed @ 24.0%
- −$961
- After-tax cash flow
- $3,576/yr
For passive investors: Depreciation is non-cash, so a rental often shows a tax loss while cash-flowing — sheltering income. Rental losses are passive: they offset passive income freely, and up to $25,000/yr can offset ordinary (W-2) income if you actively participate and your MAGI is under $100k (phasing out to $0 by $150k); unused losses carry forward. On sale, claimed depreciation is recaptured at up to 25%, and gains may owe capital-gains tax (a 1031 exchange can defer both). Figures are a year-1 estimate at your 24.0% rate — not tax advice; consult a CPA.
Schools (NCES district)
- District
- Astoria CUSD 1
- NCES district ID
- 1704440
- Math proficiency
- 6% ▬ 0.00%
- Reading proficiency
- 30% ▲ 10.00%
- Median HH income
- $41,718
- Composite
- 18.74/100
- National rank
- #14004
- State rank
- #739 of 919 in IL
Livability — Astoria
- Score
- 61/100
- State rank
- #904
- US rank
- #17575
Category grades
Schools grade is shown separately in the Schools card above.
Census & demographics
- Census place
- Astoria, IL
- Population (ZIP)
- 1,612
Population outlook (Fulton County) Hauer SSP2
- Today (2025)
- 33,356 people
- By 2030
- 32,144 · -3.6%
- By 2040
- 29,518 · -11.5%
- By 2050
- 26,775 · -19.7%
- By 2075
- 19,972 · -40.1%
- By 2100
- 13,580 · -59.3%
Race, ethnicity, and origin ACS 2023
- Neighborhood character
- Predominantly White (94%)
- Race & ethnicity
- White 94% Hispanic / Latino 3% Two or more races 2%
- Common ancestry
- Iranian 3% Lithuanian 1% Slovak 1%
- Foreign-born
- 0%
Political lean MEDSL · Fulton
- 2024 margin
- Strong R (+23.8) · D 37.1% · R 60.9% · Other 2.0%
- 2008→2024 swing
- -45.2pp toward R · 2008: 21.3pp · 2024: -23.8pp
- All cycles
- 2024: R+23.8 2020: R+20.1 2016: R+15.1 2012: D+11.1 2008: D+21.3
Not yet ingested
- Civics
- —
Market trends
- HPI YoY
- ▲ 2.73%
- Current HPI
- 128.8523
- Rent YoY
- —
- Metro
- —
- State GDP YoY
- ▲ 1.59%
- F500 in state
- 60
Industry mix (Fortune 500 HQ in IL)
| Industry | F500 HQs | Revenue |
|---|---|---|
| Insurance | 4 | $201B |
|
||
| Consumer Goods | 4 | $87B |
|
||
| Industrial Machinery | 3 | $64B |
|
||
| Healthcare | 2 | $55B |
|
||
| Retail / Pharmacy | 1 | $148B |
|
||
| Agriculture / Food | 1 | $86B |
|
||
Price history
+523.8% since first listed12 events — show timeline
- 2026-06-16 Listed $49,900 RMLSA as Distributed by MLS Grid
- 2022-06-15 Sold (Public Records) $47,500 Public Records
- 2022-06-10 Sold (MLS) $47,500 RMLSA as Distributed by MLS Grid
- 2022-05-12 Contingent — RMLSA as Distributed by MLS Grid
- 2022-05-01 Pending — RMLSA as Distributed by MLS Grid
- 2021-10-28 Listed $49,900 RMLSA as Distributed by MLS Grid
- 2016-05-12 Sold (Public Records) $50,000 Public Records
- 2016-05-11 Sold (MLS) $49,900 RMLSA as Distributed by MLS Grid
- 2015-10-14 Listed $49,900 RMLSA as Distributed by MLS Grid
- 2012-11-05 Sold (Public Records) $5,000 Public Records
- 2012-09-13 Sold (Public Records) $5,000 Public Records
- 2007-06-07 Sold (Public Records) $8,000 Public Records
Property tax history
+10.3%/yrLatest (2024): $1,159 · +0.9% YoY. Source: county tax records.
Cash-flow waterfall
monthlySold comps — $/sqft
last 12 mo · ≤1 miLoading sold comps…