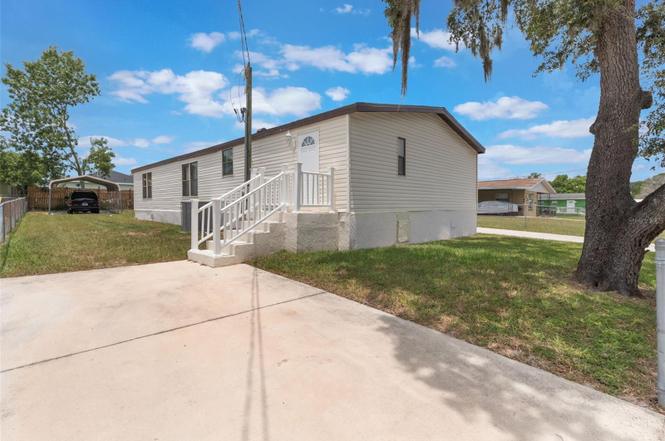
127 E Northside Dr · Lake Wales, FL
Flood risk 1/10 · Minimal
- FEMA flood zone
- X (unshaded)
- Chance of flooding over 30 yrs
- 0.0%
- Est. flood insurance / yr
- $507 – $1,088
Fire risk 5/10 · Moderate
- Est. fire insurance / yr
- $947 – $1,759
Heat risk 8/10 · Major
- Hot days now (above 108°F)
- 7 days/yr
- Hot days in 30 yrs
- 23 days/yr
Wind risk 10/10 · Severe
- Chance of severe wind over 30 yrs
- 99.0%
Air-quality risk 2/10 · Minimal
- Unhealthy air days now
- 0 days/yr
- Unhealthy air days in 30 yrs
- 2 days/yr
Risk factors via First Street. Map © Google.
Why this score? — see what drove the D- grade
The composite is a weighted blend of 9 inputs, each scored 0–100. Each bar is that input's sub-score; the figure is the points it added to the 100-point composite (weight × sub-score).
- Cash flow +13.7/30.0
- ARV discount +7.5/15.0
- DSCR +4.1/10.0
- Schools +3.5/10.0
- Livability +3.4/5.0
- 1% rule +2.7/10.0
- Rent growth +2.5/5.0
- Condition / age +2.5/5.0
- Appreciation +0.0/10.0
$165,000
🖨 Deal sheet (PDF) 📄 Offer letter ✓ Due diligence
Listing remarks
A hidden gem is finally on the market for you to call home. This charming 3 -bedroom, 2-bathroom home has an open floor-plan with clear lines of sight from the living room, dining room, the kitchen which features stainless steel appliances and the large family room with a beautiful fireplace. The primary bedroom is highlighted by a private bathroom, while the secondary and third bedrooms are generously sized and shares the functional hall bathroom. The home offers two separate entrances for added convenience, an oversized backyard with a shed for outdoor storage and a covered carport. You'll also appreciate the home's long driveway affording plenty of guest parking. Recent upgrades include
Key facts
- Large family room
- Open floor-plan
- Private bathroom
Tags
Property features AI
Exterior
- Parking: Carport with 1 space
- Utilities: Public water; Septic sewer; Electricity connected
- Home design: Manufactured double-wide home; One story; Facing east
- Construction: Vinyl siding; Shingle roof; Crawlspace foundation
- Exterior features: Private mailbox; Asphalt road frontage; Lot dimensions approximately 50 x 115
Interior
- Kitchen: Range; Microwave; Dishwasher; Refrigerator
- Bedrooms: 3 bedrooms
- Flooring: Ceramic tile; Laminate
- Bathrooms: 2 full bathrooms
- Heating & cooling: Central heating; Central air conditioning
- Interior features: Ceiling fans; Open floor plan; Split bedroom layout; Living room fireplace
- Laundry & utility: Dedicated laundry room; Washer; Dryer
Neighborhood map
What this means for you Summary
Snapshot
- This is a 3-bed/2.0-bath manufactured listed at $165k.
Deal economics
- At list price, monthly cash flow is $12 ($150/yr) — positive.
- The deal already cash-flows at list — no discount required.
- To meet the 1% rule (rent ≥ 1% of price), the offer needs to be $128k (22.6% below list).
- Recommended offer: $128k (22.6% below list) — sets the bar for 1% rule.
Location & tenants
- Location reads 68/100 on livability (#535 in FL) — a middle-class / working-renter tenant base. Strengths: cost of living A+, housing A+; Watch: employment D+, schools D, amenities F.
- Polk (suburban): math 39% / reading 43% proficiency, ranked #62 of 73 in FL (top 85%) — families likely to look elsewhere, expect single-tenant / working-renter base with shorter leases.
- Market conditions: 182 active listings in the ZIP; 4 comparable units currently listed for rent nearby; rentals at typical pace (median 24d on market — plan ~3-4 weeks tenant-placement turnaround); 10,384 units permitted in Polk County in 2024 (1,716 in 5+ unit buildings).
Forward outlook
- Local home prices are declining (-3.0%/yr); year-one equity from $1k of loan paydown is wiped out by about $5k of value loss. Plan a longer hold.
- Polk County population projected at +33% by 2050 — long-run rental-demand tailwind backs the buy-and-hold thesis.
Negotiation context
- It's been on market 332 days — a 12% lower offer ($145k) is reasonable based on typical stale-listing flexibility.
Risks & watch-outs
- Climate carrying-cost: severe wind risk, 99% chance of damaging wind over 30y; moderate wildfire risk; extreme-heat days projected 7→23/yr by 2055 (HVAC capex compounding) — expect insurance premiums to compound above CPI over the hold.
Questions for the listing agent
- It's been on market 332 days. Have you received any prior offers? Is the seller open to a 23% concession, seller financing, or rate buy-down credit?
- Why hasn't it sold? Are there any deal-killer items the seller is aware of (foundation, flood, title, zoning, code violations)?
- Is there a deadline driving the sale (1031 exchange, divorce, estate, relocation)? That informs how much negotiation room exists.
- Schools are D-rated, which usually means shorter tenancies and higher turnover. Who's the typical renter profile here, and what's been the actual vacancy rate?
- The area grade is low — what's the realistic commute time and amenity access for the typical tenant pool here? Any planned neighborhood developments (good or bad) we should know about?
- What's the average days-on-market for RENTAL listings here right now (not sales)? A rising rental-DOM trend means longer vacancies and softer asking-rent achievability than the comps imply.
- What's the recent tenant-quality profile in this submarket — average credit score on applications, eviction rate, late-payment / NSF rate, and stable-employment percentage? A property-management company in the area should have these aggregated.
- How much new for-sale + rental construction is in the pipeline within 1–3 miles? Heavy new supply typically softens prices + rents 12–24 months out; constrained supply supports both.
Investment metrics
- 1% rule
- 0.77% ✗
- Cap rate
- 6.38%
- Cash-on-cash
- 0.32%
- DSCR
- 1.01
- GRM
- 10.8
CMA / ARV
No comps found within radius.
Projected returns pro-forma
-3.0% appreciation · 3.0% rent growth · sell at horizon
- IRR
- -15.8%
- Equity multiple
- 0.44×
- Total profit
- $-26,011
- Equity at exit
- $24,602
- IRR
- -7.5%
- Equity multiple
- 0.53×
- Total profit
- $-21,909
- Equity at exit
- $14,266
Cash invested: $46,200 (down + closing). Projections, not guarantees.
Landlord ↔ Tenant lean methodology
- Overall (STATE)
- 87 Strongly Landlord-Friendly
- State Florida
- 87 Strongly Landlord-Friendly · R+3
- County
- — inherits STATE
- City
- — inherits STATE
ZIP-level market 33853
- Home prices YoY
- -9.2%
- Active inventory
- 182
- Price-to-rent
- 10.8×
Monthly cashflow live
- Estimated rent
- $1,277 medium interval (Pro) →
- Mortgage (P&I)
- −$865
- Tax from tax record
- −$62 /mo · $744/yr
- Insurance
- −$69
- HOA
- −$0
- Vacancy / Maint / Mgmt
- −$268
- Net cashflow
- $12
Break-even live
Sensitivity live
| Price | -10% $106 | -5% $59 | +0% $12 | +5% $-34 | +10% $-81 |
|---|---|---|---|---|---|
| Rent | -10% $-88 | -5% $-38 | +0% $12 | +5% $63 | +10% $113 |
| Rate | -1.0pp $96 | -0.5pp $54 | base $12 | +0.5pp $-30 | +1.0pp $-74 |
UW: 25.0% down · 7.5% · 30yr · 1.5% tax · 5.0% vac · 8.0% maint · 8.0% mgmt
Financing live
Cash to close
- Down payment
- $41,250
- Closing costs
- $4,950
- Reserves months
- —
- Total cash needed
- —
Loan-product check · same deal, 3 products live
Conventional
25% down · 7.5% · 30yr
- Down + closing
- —
- Monthly P&I
- —
- Monthly cashflow
- —
- DSCR
- —
- Eligible?
- —
Personal DTI + credit; lowest rate.
DSCR
20% down · 8.5% · 30yr
- Down + closing
- —
- Monthly P&I
- —
- Monthly cashflow
- —
- DSCR
- —
- Eligible?
- —
No personal income docs; deal must DSCR.
Hard money
10% down · 12.0% · 12mo
- Down + closing
- —
- Monthly P&I
- —
- Monthly cashflow
- —
- DSCR
- —
- Eligible?
- —
Short-term bridge; refi at stabilization.
Rent comps 4 comps
| Address | Beds | Baths | Sqft | Rent | $/sqft | DOM | Units | Dist |
|---|---|---|---|---|---|---|---|---|
| 114 E Northside Dr #3 Lake Wales, FL | 2.0 | 1.0 | 900 | $1,200 | $1.33 | 24d | 1 | 0.05mi |
| 609 Washington Ave Lake Wales, FL | 3.0 | 2.0 | 1392 | $1,549 | $1.11 | 14d | 1 | 0.80mi |
| 425 F St Unit 2 Lake Wales, FL | 3.0 | 2.0 | 977 | $1,195 | $1.22 | 14d | 1 | 0.86mi |
| 133 W Park Ave Unit B Lake Wales, FL | 3.0 | 2.0 | 1151 | $1,600 | $1.39 | 24d | 1 | 1.20mi |
Listing history 18 events
-
2026-06-18days on market $165,000 Active 332 DOM
-
2026-06-17days on market $165,000 Active 331 DOM
-
2026-06-16statusdays on market $165,000 Active 330 DOM
-
2026-06-13status $165,000 Pending 329 DOM
-
2026-06-10days on market $165,000 Active 329 DOM
-
2026-06-09days on market $165,000 Active 328 DOM
-
2026-06-08days on market $165,000 Active 327 DOM
-
2026-06-07days on market $165,000 Active 326 DOM
-
2026-06-05days on market $165,000 Active 323 DOM
-
2026-06-03days on market $165,000 Active 321 DOM
-
2026-06-01days on market $165,000 Active 320 DOM
-
2026-05-31days on market $165,000 Active 319 DOM
-
2026-05-06price $165,000
-
2026-03-24price $175,000
-
2026-01-09price $210,000
-
2025-09-19price $215,000
-
2025-08-13price $220,000
-
2025-07-16$225,000 Active
ⓘ Source: listings_history table (triggers on properties + properties_extension) + one-shot
backfill from property_details.listing_events for pre-trigger history.
Tax reassessment forecast FL · Resets to sale price
- Current annual tax
- $744 · $62/mo
- Projected year-2 tax
- $1,370 · $114/mo
- Expected delta
- +$625/yr (+$52/mo · 84.1%)
ⓘ Screening estimate from a state-policy table — verify with the county assessor before closing.
Climate risk First Street
- Flood 1/10 Low FEMA zone X (unshaded) · 0% chance over 30 yrs
- Wildfire 5/10 Major
- Heat 8/10 Severe 7 d/yr ≥108°F today · 23 d/yr by 30 yrs out
- Wind 10/10 Extreme 99% chance of damaging wind over 30 yrs
- Air quality 2/10 Low 0 unhealthy d/yr today · 2 by 30 yrs out
Nearby sold comps map
Loading sold comps map…
Walkable amenities ~0.75 mi
Loading nearby amenities…
Taxation est. · year 1
- Rental income
- $15,319
- − Mortgage interest
- −$9,243
- − Property taxes
- −$744
- − Insurance
- −$825
- − Repairs & maintenance
- −$1,226
- − Management
- −$1,226
- − Depreciation
- −$4,800
- Taxable loss
- −$2,743
- Est. tax savings @ 24.0%
- +$658
- After-tax cash flow
- $808/yr
For passive investors: Depreciation is non-cash, so a rental often shows a tax loss while cash-flowing — sheltering income. Rental losses are passive: they offset passive income freely, and up to $25,000/yr can offset ordinary (W-2) income if you actively participate and your MAGI is under $100k (phasing out to $0 by $150k); unused losses carry forward. On sale, claimed depreciation is recaptured at up to 25%, and gains may owe capital-gains tax (a 1031 exchange can defer both). Figures are a year-1 estimate at your 24.0% rate — not tax advice; consult a CPA.
Schools (NCES district)
- District
- Polk
- NCES district ID
- 1201590
- Math proficiency
- 39% ▼ -11.00%
- Reading proficiency
- 43% ▼ -4.00%
- Median HH income
- $43,979
- Composite
- 34.74/100
- National rank
- #5132
- State rank
- #62 of 73 in FL
Livability — Lake Wales
- Score
- 68/100
- State rank
- #535
- US rank
- #10036
Category grades
Schools grade is shown separately in the Schools card above.
Census & demographics
- City population
- 30,351
- Population (ZIP)
- 12,385
Population outlook (Polk County) Hauer SSP2
- Today (2025)
- 752,975 people
- By 2030
- 804,621 · +6.9%
- By 2040
- 906,117 · +20.3%
- By 2050
- 1,000,476 · +32.9%
- By 2075
- 1,197,520 · +59.0%
- By 2100
- 1,271,518 · +68.9%
Race, ethnicity, and origin ACS 2023
- Neighborhood character
- Diverse neighborhood (Simpson 0.65)
- Race & ethnicity
- White 42% Hispanic / Latino 36% Black 19% Two or more races 16%
- Hispanic origin (detail)
- Mexican 10% Puerto Rican 18% Cuban 2% Dominican 1%
- Common ancestry
- Romanian 2% Slovak 1% Lithuanian 1%
- Foreign-born
- 10% · Canada
- Languages at home
- 72% English-only · Spanish 27%
Political lean MEDSL · Polk
- 2024 margin
- Strong R (+20.7) · D 39.2% · R 59.9%
- 2008→2024 swing
- -14.6pp toward R · 2008: -6.1pp · 2024: -20.7pp
- All cycles
- 2024: R+20.7 2020: R+14.4 2016: R+14.1 2012: R+6.8 2008: R+6.1
Not yet ingested
- Civics
- —
Market trends
- HPI YoY
- ▼ -33.98%
- Current HPI
- 333.8292
- Rent YoY
- —
- Metro
- —
- State GDP YoY
- ▲ 3.28%
- F500 in state
- 36
Industry mix (Fortune 500 HQ in FL)
| Industry | F500 HQs | Revenue |
|---|---|---|
| Industrial Technology | 2 | $29B |
|
||
| Insurance | 2 | $17B |
|
||
| Retail | 1 | $60B |
|
||
| Technology Distribution | 1 | $58B |
|
||
| Homebuilding | 1 | $35B |
|
||
| Technology Manufacturing | 1 | $35B |
|
||
Price history
-26.7% since first listed6 events — show timeline
- 2026-05-06 Price Changed $165,000 Stellar MLS as Distributed by MLS Grid
- 2026-03-24 Price Changed $175,000 Stellar MLS as Distributed by MLS Grid
- 2026-01-09 Price Changed $210,000 Stellar MLS as Distributed by MLS Grid
- 2025-09-19 Price Changed $215,000 Stellar MLS as Distributed by MLS Grid
- 2025-08-13 Price Changed $220,000 Stellar MLS as Distributed by MLS Grid
- 2025-07-16 Listed $225,000 Stellar MLS as Distributed by MLS Grid
Property tax history
+22.1%/yrLatest (2025): $744 · +17.1% YoY. Source: county tax records.
Cash-flow waterfall
monthlySold comps — $/sqft
last 12 mo · ≤1 miLoading sold comps…