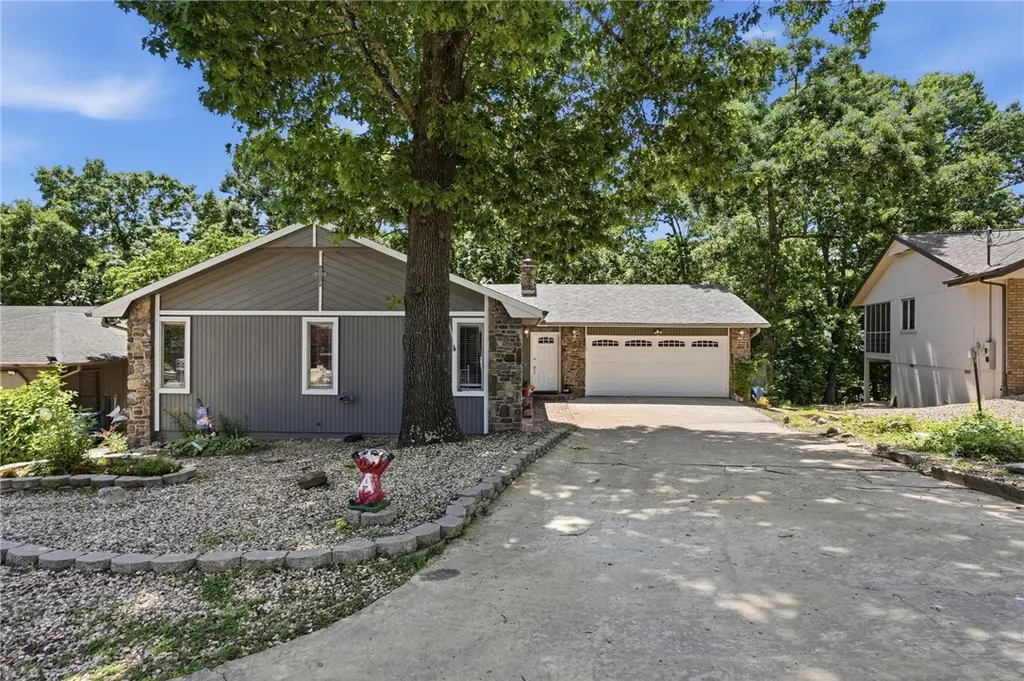
8 Cromer Dr · Bella Vista, AR
Flood risk 1/10 · Minimal
- FEMA flood zone
- X (unshaded)
- Chance of flooding over 30 yrs
- 0.0%
- Est. flood insurance / yr
- $473 – $860
Fire risk 3/10 · Minor
- Est. fire insurance / yr
- $1,499 – $2,785
Heat risk 4/10 · Minor
- Hot days now (above 105°F)
- 7 days/yr
- Hot days in 30 yrs
- 20 days/yr
Wind risk 2/10 · Minimal
- Chance of severe wind over 30 yrs
- 2.0%
Air-quality risk 2/10 · Minimal
- Unhealthy air days now
- 0 days/yr
- Unhealthy air days in 30 yrs
- 1 days/yr
Risk factors via First Street. Map © Google.
Why this score? — see what drove the C- grade
The composite is a weighted blend of 9 inputs, each scored 0–100. Each bar is that input's sub-score; the figure is the points it added to the 100-point composite (weight × sub-score).
- Cash flow +18.2/30.0
- ARV discount +12.4/15.0
- DSCR +5.7/10.0
- Schools +5.2/10.0
- 1% rule +3.8/10.0
- Livability +3.4/5.0
- Rent growth +2.5/5.0
- Condition / age +2.5/5.0
- Appreciation +0.0/10.0
$359,900
🖨 Deal sheet 📄 Offer letter ✓ Due diligence
Listing remarks
Centrally located, close to Lake Avalon, 3 bed 2 bath, 2 level home in Bella Vista. 2 Bedrooms on main floor, large main bedroom downstairs, great for privacy. Come see the extra large kitchen with cabinets galore. Huge counter space sits 7 people with large dining area as well. Perfect home for entertaining. Newer flooring. New roof & gutters 2026. Stone gas log fireplace in family room & woodburning stove downstairs. New front door, new garage door & opener , bluetooth option. Newer water heater. If you like gardening there are raised beds & the flat yard makes it fun. Screened in room off family room for 3 season enjoyment, makes a great reading area with high cei
Key facts
- Huge counter space
- Centrally located
- Close to lake avalon
Tags
Property features AI
Finance
- HOA & community: Bella Vista POA with a $40 monthly fee; Community features include biking, shopping, and trails/paths
Exterior
- Parking: Attached garage with garage door opener; 2 covered parking spaces
- Utilities: Public water; Septic (sewer available via septic tank); Electricity available; Cable available; Phone service available
- Home design: 2-story home; 25+ years old; Faces unspecified
- Construction: Cedar, frame, and rock exterior; Architectural shingle roof; Block foundation
- Exterior features: Concrete driveway; Deck; Screened porch; Back yard fencing; City lot; Level lot; Located in a subdivision; Public/shared road frontage
Interior
- Kitchen: Double oven; Electric oven; Electric range; Self-cleaning oven; Disposal; Refrigerator; Exhaust fan; Plumbed for ice maker; Eat-in kitchen
- Bedrooms: Sunroom listed as a room type
- Flooring: Carpet; Laminate; Tile
- Bathrooms: 2 full bathrooms
- Heating & cooling: Heat pump heating; Heat pump cooling
- Interior features: Blinds; Attic; Ceiling fans; Cathedral ceilings; Eat-in kitchen; Storage; Walk-in closet(s); Window treatments; Sunroom; Wood-burning stove
- Laundry & utility: Washer; Dryer; Electric water heater
Neighborhood map
What this means for you Summary
Snapshot
- This is a 3-bed/2.0-bath single-family listed at $360k.
Deal economics
- At list price, monthly cash flow is $325 ($4k/yr) — positive.
- The deal already cash-flows at list — no discount required.
- To meet the 1% rule (rent ≥ 1% of price), the offer needs to be $317k (11.9% below list).
- Recommended offer: $317k (11.9% below list) — sets the bar for 1% rule.
- Cap rate 7.4% vs local median 3.6% in Bella Vista — top-decile yield for the area; either an underpriced asset or a hidden risk that comps aren't pricing in. Stress-test before assuming the spread holds.
Location & tenants
- Location reads 67/100 on livability (#111 in AR) — a middle-class / working-renter tenant base. Strengths: cost of living A+, housing A+, schools A; Watch: amenities F, commute F, health & safety F.
- Bentonville School District (urban): math 59% / reading 59% proficiency, ranked #3 of 238 in AR (top 1%) — acceptable for families but not a draw, mixed tenant base, ~2y average lease.
- Market conditions: 827 active listings in the ZIP; 5 comparable units currently listed for rent nearby; rentals at typical pace (median 14d on market — plan ~3-4 weeks tenant-placement turnaround); solid renter incomes; 4,359 units permitted in Benton County in 2024 (402 in 5+ unit buildings).
- At $3,170/mo this rent would consume 46% of the median local household income ($82k/yr) (locally 107% of renters already pay >50% of income on rent) — very limited rent-growth headroom before tenants either downsize or default.
Forward outlook
- Local home prices are declining (-3.0%/yr); year-one equity from $2k of loan paydown is wiped out by about $11k of value loss. Plan a longer hold.
- Benton County population projected at +56% by 2050 — long-run rental-demand tailwind backs the buy-and-hold thesis.
Negotiation context
- It's been on market 21 days — a 2% lower offer ($355k) is reasonable based on typical stale-listing flexibility.
- Current owner paid $95k; list at $360k implies a 279% gain — meaningful room to come down on a strong offer.
Questions for the listing agent
- What does the HOA fee cover, when was the last increase, and are there any pending special assessments or reserve-fund shortfalls?
- Is there a deadline driving the sale (1031 exchange, divorce, estate, relocation)? That informs how much negotiation room exists.
- Schools are A-rated — typically a magnet for longer-tenancy family renters. What's the average tenant stay here, and is there a school-zone premium baked into asking?
- What's the average days-on-market for RENTAL listings here right now (not sales)? A rising rental-DOM trend means longer vacancies and softer asking-rent achievability than the comps imply.
- What's the recent tenant-quality profile in this submarket — average credit score on applications, eviction rate, late-payment / NSF rate, and stable-employment percentage? A property-management company in the area should have these aggregated.
- How much new for-sale + rental construction is in the pipeline within 1–3 miles? Heavy new supply typically softens prices + rents 12–24 months out; constrained supply supports both.
Investment metrics
- 1% rule
- 0.88% ✗
- Cap rate
- 7.38%
- Cash-on-cash
- 3.87%
- DSCR
- 1.17
- GRM
- 9.5
CMA / ARV
- ARV (on-the-fly)
- $404,211
- Comps found
- 12
Show comp detail 12 sales within ~0.75 mi
| Address | Dist | Beds/Ba | Sqft | Sold | Price | $/sf | Match |
|---|---|---|---|---|---|---|---|
| 27 Cromer Dr | 0.15mi | 3/2.0 | 1,816 (-10%) | 4mo | $347,500 | $191 | 74 |
| 36 Brentwood Dr | 0.47mi | 3/2.0 | 1,950 (-3%) | 3mo | $535,000 | $274 | 71 |
| 6 Erith Ln | 0.26mi | 4/2.0 (+1) | 2,082 (+4%) | 8mo | $325,000 | $156 | 70 |
| 14 Kirkby Cir | 0.30mi | 3/2.0 | 1,786 (-11%) | 0mo | $330,000 | $185 | 67 |
| 8 Brentwood Dr | 0.28mi | 3/2.0 | 1,736 (-14%) | 0mo | $390,000 | $225 | 64 |
| 21 Swanage Dr | 0.47mi | 3/3.0 | 1,888 (-6%) | 5mo | $360,000 | $191 | 59 |
| 5 Pease Ln | 0.71mi | 2/2.5 (-1) | 2,016 (+0%) | 6mo | $500,000 | $248 | 55 |
| 48 Mayfair Dr | 0.58mi | 3/2.5 | 2,118 (+5%) | 11mo | $426,000 | $201 | 53 |
| 1 Hartlepool Dr | 0.60mi | 2/2.0 (-1) | 1,800 (-10%) | 2mo | $320,000 | $178 | 48 |
| 1 Wimborne Ln | 0.36mi | 2/2.5 (-1) | 2,283 (+14%) | 8mo | $380,000 | $166 | 47 |
| 17 Cheddar Dr | 0.72mi | 3/2.0 | 1,787 (-11%) | 2mo | $375,000 | $210 | 46 |
| 29 Eaton Cir | 0.69mi | 3/3.0 | 2,234 (+11%) | 5mo | $624,400 | $279 | 41 |
Match score weights: distance 35% · size 25% · config 20% · recency 20%. Top-matched comps best support the ARV.
Projected returns pro-forma
-3.0% appreciation · 3.0% rent growth · sell at horizon
- IRR
- -10.3%
- Equity multiple
- 0.63×
- Total profit
- $-37,757
- Equity at exit
- $53,662
- IRR
- -1.0%
- Equity multiple
- 0.93×
- Total profit
- $-6,794
- Equity at exit
- $31,118
Cash invested: $100,772 (down + closing). Projections, not guarantees.
Landlord ↔ Tenant lean methodology
- Overall (STATE)
- 92 Strongly Landlord-Friendly
- State Arkansas
- 92 Strongly Landlord-Friendly · R+14
- County
- — inherits STATE
- City
- — inherits STATE
ZIP-level market 72715
- Home prices YoY
- -6.6%
- Active inventory
- 827
- Price-to-rent
- 9.5×
Monthly cashflow live
- Estimated rent
- $3,170 high interval (Pro) →
- Mortgage (P&I)
- −$1,887
- Tax from tax record
- −$102 /mo · $1,219/yr
- Insurance
- −$150
- HOA
- −$40
- Vacancy / Maint / Mgmt
- −$666
- Net cashflow
- $325
Break-even live
UW: 25.0% down · 7.5% · 30yr · 1.5% tax · 5.0% vac · 8.0% maint · 8.0% mgmt
Financing live
Cash to close
- Down payment
- $89,975
- Closing costs
- $10,797
- Reserves months
- —
- Total cash needed
- —
Loan-product check · same deal, 3 products live
Conventional
25% down · 7.5% · 30yr
- Down + closing
- —
- Monthly P&I
- —
- Monthly cashflow
- —
- DSCR
- —
- Eligible?
- —
Personal DTI + credit; lowest rate.
DSCR
20% down · 8.5% · 30yr
- Down + closing
- —
- Monthly P&I
- —
- Monthly cashflow
- —
- DSCR
- —
- Eligible?
- —
No personal income docs; deal must DSCR.
Hard money
10% down · 12.0% · 12mo
- Down + closing
- —
- Monthly P&I
- —
- Monthly cashflow
- —
- DSCR
- —
- Eligible?
- —
Short-term bridge; refi at stabilization.
Rent comps 5 comps
| Address | Beds | Baths | Sqft | Rent | $/sqft | DOM | Units | Dist |
|---|---|---|---|---|---|---|---|---|
| 6 Erith Ln Unit 1512836P Bella Vista, AR | 4.0 | 2.0 | 2077 | $5,027 | $2.42 | 14d | 1 | 0.29mi |
| 9 Purfleet Dr Unit 1366492P Bella Vista, AR | 3.0 | 2.0 | 1625 | $3,392 | $2.09 | 14d | 1 | 0.42mi |
| 4 Tilbury Ln Bella Vista, AR | 3.0 | 2.5 | 1742 | $1,850 | $1.06 | 14d | 1 | 0.49mi |
| 6 Connie Ln Bella Vista, AR | 3.0 | 2.0 | 1440 | $2,250 | $1.56 | 23d | 1 | 0.98mi |
| 5 Wreston Ln Bella Vista, AR | 3.0 | 3.0 | 2290 | $2,000 | $0.87 | 14d | 1 | 1.11mi |
HOA detail
- Monthly dues
- $40 · $480/yr
- Likely covers
- watergas
Listing history 17 events
-
2026-06-18days on market $359,900 Active 21 DOM
-
2026-06-17days on market $359,900 Active 20 DOM
-
2026-06-16days on market $359,900 Active 19 DOM
-
2026-06-15days on market $359,900 Active 18 DOM
-
2026-06-14days on market $359,900 Active 16 DOM
-
2026-06-10days on market $359,900 Active 13 DOM
-
2026-06-09days on market $359,900 Active 12 DOM
-
2026-06-08days on market $359,900 Active 11 DOM
-
2026-06-07days on market $359,900 Active 10 DOM
-
2026-06-05days on market $359,900 Active 7 DOM
-
2026-06-03days on market $359,900 Active 6 DOM
-
2026-06-02days on market $359,900 Active 5 DOM
-
2026-06-01days on market $359,900 Active 4 DOM
-
2026-05-31days on market $359,900 Active 3 DOM
-
2026-05-31days on market $359,900 Active 2 DOM
-
2026-05-28$359,900 Active
-
2000-06-01soldstatus $95,000
ⓘ Source: listings_history table (triggers on properties + properties_extension) + one-shot
backfill from property_details.listing_events for pre-trigger history.
Tax reassessment forecast AR · Resets to sale price
- Current annual tax
- $1,219 · $102/mo
- Projected year-2 tax
- $2,303 · $192/mo
- Expected delta
- +$1,085/yr (+$90/mo · 89.0%)
ⓘ Screening estimate from a state-policy table — verify with the county assessor before closing.
Climate risk First Street
- Flood 1/10 Low FEMA zone X (unshaded) · 0% chance over 30 yrs
- Wildfire 3/10 Moderate
- Heat 4/10 Moderate 7 d/yr ≥105°F today · 20 d/yr by 30 yrs out
- Wind 2/10 Low 2% chance of damaging wind over 30 yrs
- Air quality 2/10 Low 0 unhealthy d/yr today · 1 by 30 yrs out
Nearby sold comps map
Loading sold comps map…
Walkable amenities ~0.75 mi
Loading nearby amenities…
Taxation est. · year 1
- Rental income
- $38,035
- − Mortgage interest
- −$20,160
- − Property taxes
- −$1,219
- − Insurance
- −$1,800
- − Repairs & maintenance
- −$3,043
- − Management
- −$3,043
- − HOA
- −$480
- − Depreciation
- −$10,470
- Taxable loss
- −$2,179
- Est. tax savings @ 24.0%
- +$523
- After-tax cash flow
- $4,424/yr
For passive investors: Depreciation is non-cash, so a rental often shows a tax loss while cash-flowing — sheltering income. Rental losses are passive: they offset passive income freely, and up to $25,000/yr can offset ordinary (W-2) income if you actively participate and your MAGI is under $100k (phasing out to $0 by $150k); unused losses carry forward. On sale, claimed depreciation is recaptured at up to 25%, and gains may owe capital-gains tax (a 1031 exchange can defer both). Figures are a year-1 estimate at your 24.0% rate — not tax advice; consult a CPA.
Schools (NCES district)
- District
- Bentonville School District
- NCES district ID
- 0503060
- Math proficiency
- 59% ▼ -8.00%
- Reading proficiency
- 59% ▼ -6.00%
- Median HH income
- $66,721
- Composite
- 51.85/100
- National rank
- #1661
- State rank
- #3 of 238 in AR
Livability — Bella Vista
- Score
- 67/100
- State rank
- #111
- US rank
- #11129
Category grades
Schools grade is shown separately in the Schools card above.
Census & demographics
- Census place
- Bella Vista, AR
- County
- Benton County · 259,241 people
- City population
- 31,638
- Metro
- Fayetteville-Springdale-Rogers, AR
- Population (ZIP)
- 17,288
- Household income
- $82,447
- Rent vs Own
- Severe rent burden
- 107.0
Population outlook (Benton County) Hauer SSP2
- Today (2025)
- 318,683 people
- By 2030
- 353,481 · +10.9%
- By 2040
- 425,280 · +33.4%
- By 2050
- 497,239 · +56.0%
- By 2075
- 662,114 · +107.8%
- By 2100
- 776,431 · +143.6%
Race, ethnicity, and origin ACS 2023
- Neighborhood character
- Predominantly White (84%)
- Race & ethnicity
- White 84% Two or more races 12% Hispanic / Latino 6% Asian 1%
- Hispanic origin (detail)
- Mexican 2% Dominican 2%
- Common ancestry
- Lithuanian 4% Slovak 4% Portuguese 2%
- Foreign-born
- 3% · Canada
- Languages at home
- 97% English-only · Spanish 2%
Political lean MEDSL · Benton
- 2024 margin
- Strong R (+27.0) · D 35.2% · R 62.1% · Other 2.7%
- 2008→2024 swing
- +9.6pp toward D · 2008: -36.5pp · 2024: -27.0pp
- All cycles
- 2024: R+27.0 2020: R+26.4 2016: R+34.9 2012: R+40.4 2008: R+36.5
Not yet ingested
- Civics
- —
Market trends
- HPI YoY
- ▼ -21.53%
- Current HPI
- 304.946
- Rent YoY
- —
- Metro
- Fayetteville-Springdale-Rogers, AR
- State GDP YoY
- ▲ 3.80%
- F500 in state
- 10
Industry mix (Fortune 500 HQ in AR)
| Industry | F500 HQs | Revenue |
|---|---|---|
| Retail | 1 | $681B |
|
||
| Food / Agriculture | 1 | $53B |
|
||
| Retail / Energy | 1 | $22B |
|
||
| Transportation / Logistics | 1 | $12B |
|
||
| Energy | 1 | $4B |
|
||
Price history
+278.8% since first listed2 events — show timeline
- 2026-05-28 Listed $359,900 NWARMLS
- 2000-06-01 Sold (Public Records) $95,000 Public Records
Property tax history
+0.3%/yrLatest (2025): $1,219 · -6.8% YoY. Source: county tax records.
Cash-flow waterfall
monthlySold comps — $/sqft
last 12 mo · ≤1 miLoading sold comps…