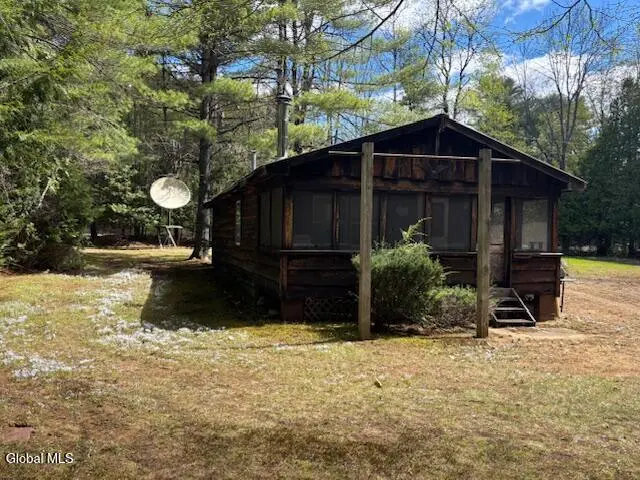
501 Harrington Rd · North Creek, NY
Flood risk 10/10 · Severe
- FEMA flood zone
- X
- Chance of flooding over 30 yrs
- 0.99%
- Est. flood insurance / yr
- $507 – $1,088
Fire risk 3/10 · Minor
- Est. fire insurance / yr
- $691 – $1,283
Heat risk 2/10 · Minimal
- Hot days now (above 90°F)
- 7 days/yr
- Hot days in 30 yrs
- 17 days/yr
Wind risk 2/10 · Minimal
- Chance of severe wind over 30 yrs
- 1.0%
Air-quality risk 1/10 · Minimal
- Unhealthy air days now
- 0 days/yr
- Unhealthy air days in 30 yrs
- 0 days/yr
Risk factors via First Street. Map © Google.
Why this score? — see what drove the D grade
The composite is a weighted blend of 9 inputs, each scored 0–100. Each bar is that input's sub-score; the figure is the points it added to the 100-point composite (weight × sub-score).
- ARV discount +15.0/15.0
- Appreciation +9.1/10.0
- Cash flow +5.4/30.0
- Schools +4.2/10.0
- Livability +3.2/5.0
- Rent growth +2.5/5.0
- Condition / age +2.5/5.0
- 1% rule +0.6/10.0
- DSCR +0.0/10.0
$179,000
🖨 Deal sheet (PDF) 📄 Offer letter ✓ Due diligence
Listing remarks
Simply special waterfront camp. Cookouts, fireside stories, trout fishing, and falling asleep to the sound of waters of Mill Creek. Rustic and functional 2-bedroom 1-bath cottage. Open living, dining and kitchen and screened in porch. Large open yard and 2 sheds. Short distance to North Creek and I87 in Warrensburg. A terrific Adirondack location.
Key facts
- Screened in porch
- Large open yard
- Waterfront camp
Tags
Property features AI
Exterior
- Parking: Off-street parking; Driveway; Total of 4 parking spaces
- Utilities: 100 amp electric service; Holding tank and septic tank for sewer; Seasonal water source
- Home design: Single family residence; Entry level: First floor living spaces noted; Main road frontage approximately 157'
- Construction: Wood siding; Metal roof; Pillar/post/pier foundation; Built with traditional wood construction
- Exterior features: Screened patio/porch; Gas grill; Shed(s); Views; Level, private lot with road frontage; Creek on the property (Mill Creek) - waterfront feature
Interior
- Kitchen: Microwave; Range; Refrigerator
- Bedrooms: Two bedrooms on the first level
- Flooring: Carpet; Linoleum
- Bathrooms: One full bathroom on the first level
- Heating & cooling: Forced air; Oil heating; Wood stove (supplemental heating)
- Interior features: Storm door(s); Wood burning stove; 5 rooms total
- Laundry & utility: Basement utilities include wood stove (basement listed with pillar/post/pier)
Neighborhood map
What this means for you Summary
Snapshot
- This is a 2-bed/1.0-bath single-family listed at $179k.
Deal economics
- At list price, monthly cash flow is $-454 ($-5k/yr) — negative.
- To cash-flow at today's rent, offer at most $99k (44.8% below list).
- To meet the 1% rule (rent ≥ 1% of price), the offer needs to be $99k (44.4% below list).
- Recommended offer: $99k (44.8% below list) — sets the bar for cash-flow.
- Cap rate 3.7% vs local median 2.3% in North Creek — top-decile yield for the area; either an underpriced asset or a hidden risk that comps aren't pricing in. Stress-test before assuming the spread holds.
Location & tenants
- Location reads 65/100 on livability (#683 in NY) — a middle-class / working-renter tenant base. Strengths: housing A+, health & safety A+, cost of living B; Watch: schools D+, crime F, amenities F.
- Johnsburg Central School District (rural): math 50% / reading 45% proficiency, ranked #521 of 755 in NY (top 69%) — families likely to look elsewhere, expect single-tenant / working-renter base with shorter leases.
- Market conditions: 16 active listings in the ZIP; 180 units permitted in Warren County in 2024 (40 in 5+ unit buildings).
Forward outlook
- In year one you build about $16k of equity ($1k loan paydown + $15k appreciation (8.1% local appreciation)).
- Warren County population projected at -19% by 2050 — secular population decline; favor cash flow + early exit over multi-decade hold.
- By year 3, paydown + projected appreciation supports a ~$39k cash-out refi (75% LTV) — recoverable capital for the next deal without selling this one.
Negotiation context
- It's been on market 40 days — a 3% lower offer ($174k) is reasonable based on typical stale-listing flexibility.
- 3 sale attempts since 2y ago; this cycle's ask has dropped $10k (5%) from the opening price — seller is motivated, your offer sets the floor, not the list.
Risks & watch-outs
- Watch-outs: flood insurance adds $66/mo.
- Climate carrying-cost: severe flood risk — expect insurance premiums to compound above CPI over the hold.
Questions for the listing agent
- What do current leases actually rent for vs. the listed asking? Can we see a recent rent roll and the last 12 months of T-12 income?
- It's been on market 40 days. Have you received any prior offers? Is the seller open to a 45% concession, seller financing, or rate buy-down credit?
- Built in 1960 — when were the roof, HVAC, electrical panel, plumbing, and water heater last replaced?
- What's the actual annual flood-insurance premium (NFIP or private), and is the property in a SFHA with mandatory coverage?
- Is there a deadline driving the sale (1031 exchange, divorce, estate, relocation)? That informs how much negotiation room exists.
- Schools are D-rated, which usually means shorter tenancies and higher turnover. Who's the typical renter profile here, and what's been the actual vacancy rate?
- Crime grade is F in this area — have there been break-ins, vandalism, or insurance claims at this property in the last 3 years? What carrier currently insures it and at what premium?
- The area grade is low — what's the realistic commute time and amenity access for the typical tenant pool here? Any planned neighborhood developments (good or bad) we should know about?
- What's the average days-on-market for RENTAL listings here right now (not sales)? A rising rental-DOM trend means longer vacancies and softer asking-rent achievability than the comps imply.
- What's the recent tenant-quality profile in this submarket — average credit score on applications, eviction rate, late-payment / NSF rate, and stable-employment percentage? A property-management company in the area should have these aggregated.
- How much new for-sale + rental construction is in the pipeline within 1–3 miles? Heavy new supply typically softens prices + rents 12–24 months out; constrained supply supports both.
Investment metrics
- 1% rule
- 0.56% ✗
- Cap rate
- 3.69%
- Cash-on-cash
- -9.29%
- DSCR
- 0.59
- GRM
- 15.0
CMA / ARV
- ARV (median comp)
- $274,101
- List price
- $179,000
- Delta
- -34.70%
- Verdict
- UNDERPRICED
- Comps
- 1 within 2.0 mi
Projected returns pro-forma
8.11% appreciation · 3.0% rent growth · sell at horizon
- IRR
- 12.2%
- Equity multiple
- 1.92×
- Total profit
- $46,036
- Equity at exit
- $137,283
- IRR
- 12.6%
- Equity multiple
- 4.10×
- Total profit
- $155,148
- Equity at exit
- $273,746
Cash invested: $50,120 (down + closing). Projections, not guarantees.
Landlord ↔ Tenant lean methodology
- Overall (STATE)
- 15 Strongly Tenant-Friendly
- State New York
- 15 Strongly Tenant-Friendly · D+10
- County
- — inherits STATE
- City
- — inherits STATE
ZIP-level market 12886
- Home prices YoY
- 3.0%
- Active inventory
- 16
- Price-to-rent
- 15.0×
Monthly cashflow live
- Estimated rent
- $995 medium interval (Pro) →
- Mortgage (P&I)
- −$939
- Tax from tax record
- −$160 /mo · $1,924/yr
- Insurance
- −$75
- Flood insurance flood zone
- −$66 /mo · $798/yr
- HOA
- −$0
- Vacancy / Maint / Mgmt
- −$209
- Net cashflow
- $-454
Break-even live
Sensitivity live
| Price | -10% $-353 | -5% $-404 | +0% $-454 | +5% $-505 | +10% $-556 |
|---|---|---|---|---|---|
| Rent | -10% $-533 | -5% $-494 | +0% $-454 | +5% $-415 | +10% $-376 |
| Rate | -1.0pp $-364 | -0.5pp $-409 | base $-454 | +0.5pp $-501 | +1.0pp $-548 |
UW: 25.0% down · 7.5% · 30yr · 1.5% tax · 5.0% vac · 8.0% maint · 8.0% mgmt
Financing live
Cash to close
- Down payment
- $44,750
- Closing costs
- $5,370
- Reserves months
- —
- Total cash needed
- —
Loan-product check · same deal, 3 products live
Conventional
25% down · 7.5% · 30yr
- Down + closing
- —
- Monthly P&I
- —
- Monthly cashflow
- —
- DSCR
- —
- Eligible?
- —
Personal DTI + credit; lowest rate.
DSCR
20% down · 8.5% · 30yr
- Down + closing
- —
- Monthly P&I
- —
- Monthly cashflow
- —
- DSCR
- —
- Eligible?
- —
No personal income docs; deal must DSCR.
Hard money
10% down · 12.0% · 12mo
- Down + closing
- —
- Monthly P&I
- —
- Monthly cashflow
- —
- DSCR
- —
- Eligible?
- —
Short-term bridge; refi at stabilization.
Listing history 22 events
-
2026-06-21days on market $179,000 Active 40 DOM
-
2026-06-21days on market $179,000 Active 39 DOM
-
2026-06-18days on market $179,000 Active 37 DOM
-
2026-06-17days on market $179,000 Active 36 DOM
-
2026-06-16days on market $179,000 Active 35 DOM
-
2026-06-15days on market $179,000 Active 34 DOM
-
2026-06-13days on market $179,000 Active 32 DOM
-
2026-06-12days on market $179,000 Active 31 DOM
-
2026-06-09days on market $179,000 Active 28 DOM
-
2026-06-08days on market $179,000 Active 27 DOM
-
2026-06-07days on market $179,000 Active 26 DOM
-
2026-06-05days on market $179,000 Active 24 DOM
-
2026-06-04days on market $179,000 Active 22 DOM
-
2026-06-02days on market $179,000 Active 21 DOM
-
2026-06-01days on market $179,000 Active 20 DOM
-
2026-05-31days on market $179,000 Active 19 DOM
-
2026-05-12$189,000 Active 350-char remark
-
2026-04-22historical
-
2025-07-28price $212,000
-
2025-05-21$219,000 Active
-
2024-12-27historical
-
2024-06-27$219,900 Active
ⓘ Source: listings_history table (triggers on properties + properties_extension) + one-shot
backfill from property_details.listing_events for pre-trigger history.
Tax reassessment forecast NY · Partial reset (capped growth)
- Current annual tax
- $1,924 · $160/mo
- Projected year-2 tax
- $2,475 · $206/mo
- Expected delta
- +$551/yr (+$46/mo · 28.6%)
ⓘ Screening estimate from a state-policy table — verify with the county assessor before closing.
Climate risk First Street
- Flood 10/10 Extreme FEMA zone X · 99% chance over 30 yrs
- Wildfire 3/10 Moderate
- Heat 2/10 Low 7 d/yr ≥90°F today · 17 d/yr by 30 yrs out
- Wind 2/10 Low 100% chance of damaging wind over 30 yrs
- Air quality 1/10 Low 0 unhealthy d/yr today · 0 by 30 yrs out
Nearby sold comps map
Loading sold comps map…
Walkable amenities ~0.75 mi
Loading nearby amenities…
Taxation est. · year 1
- Rental income
- $11,936
- − Mortgage interest
- −$10,027
- − Property taxes
- −$1,924
- − Insurance
- −$1,692
- − Repairs & maintenance
- −$955
- − Management
- −$955
- − Depreciation
- −$5,207
- Taxable loss
- −$8,824
- Est. tax savings @ 24.0%
- +$2,118
- After-tax cash flow
- $-3,334/yr
For passive investors: Depreciation is non-cash, so a rental often shows a tax loss while cash-flowing — sheltering income. Rental losses are passive: they offset passive income freely, and up to $25,000/yr can offset ordinary (W-2) income if you actively participate and your MAGI is under $100k (phasing out to $0 by $150k); unused losses carry forward. On sale, claimed depreciation is recaptured at up to 25%, and gains may owe capital-gains tax (a 1031 exchange can defer both). Figures are a year-1 estimate at your 24.0% rate — not tax advice; consult a CPA.
Schools (NCES district)
- District
- Johnsburg Central School District
- NCES district ID
- 3615870
- Math proficiency
- 50% ▬ 0.00%
- Reading proficiency
- 45% ▼ -5.00%
- Median HH income
- $45,308
- Composite
- 42.4/100
- National rank
- #6915
- State rank
- #521 of 755 in NY
Livability — North Creek
- Score
- 65/100
- State rank
- #683
- US rank
- #12939
Category grades
Schools grade is shown separately in the Schools card above.
Census & demographics
- Population (ZIP)
- 199
Population outlook (Warren County) Hauer SSP2
- Today (2025)
- 62,372 people
- By 2030
- 60,491 · -3.0%
- By 2040
- 55,616 · -10.8%
- By 2050
- 50,437 · -19.1%
- By 2075
- 40,843 · -34.5%
- By 2100
- 31,159 · -50.0%
Race, ethnicity, and origin ACS 2023
- Neighborhood character
- Predominantly White (81%)
- Race & ethnicity
- White 81% Two or more races 13% Black 7% Hispanic / Latino 2%
- Common ancestry
- Iranian 14% Slovak 5%
Political lean MEDSL · Warren
- 2024 margin
- Toss-up / Even · D 47.9% · R 52.1%
- 2008→2024 swing
- -6.9pp toward R · 2008: 2.6pp · 2024: -4.2pp
- All cycles
- 2024: R+4.2 2020: R+0.2 2016: R+10.6 2012: D+2.1 2008: D+2.6
Not yet ingested
- Civics
- —
Market trends
- HPI YoY
- ▲ 8.11%
- Current HPI
- 279.7862
- Rent YoY
- —
- Metro
- —
- State GDP YoY
- ▲ 2.60%
- F500 in state
- 92
Industry mix (Fortune 500 HQ in NY)
| Industry | F500 HQs | Revenue |
|---|---|---|
| Financial Services | 10 | $950B |
|
||
| Consumer Goods | 9 | $162B |
|
||
| Insurance | 4 | $225B |
|
||
| Telecommunications | 2 | $144B |
|
||
| Pharmaceuticals | 2 | $112B |
|
||
| Media / Entertainment | 2 | $69B |
|
||
Price history
-18.6% since first listed7 events — show timeline
- 2026-05-29 Price Changed $179,000 Global MLS
- 2026-05-12 Listed $189,000 Global MLS
- 2026-04-22 Listing Removed — Global MLS
- 2025-07-28 Price Changed $212,000 Global MLS
- 2025-05-21 Listed $219,000 Global MLS
- 2024-12-27 Listing Removed — Global MLS
- 2024-06-27 Listed $219,900 Global MLS
Property tax history
+5.9%/yrLatest (2025): $1,924 · +96.3% YoY. Source: county tax records.
Cash-flow waterfall
monthlySold comps — $/sqft
last 12 mo · ≤1 miLoading sold comps…