 🏗️ New Construction
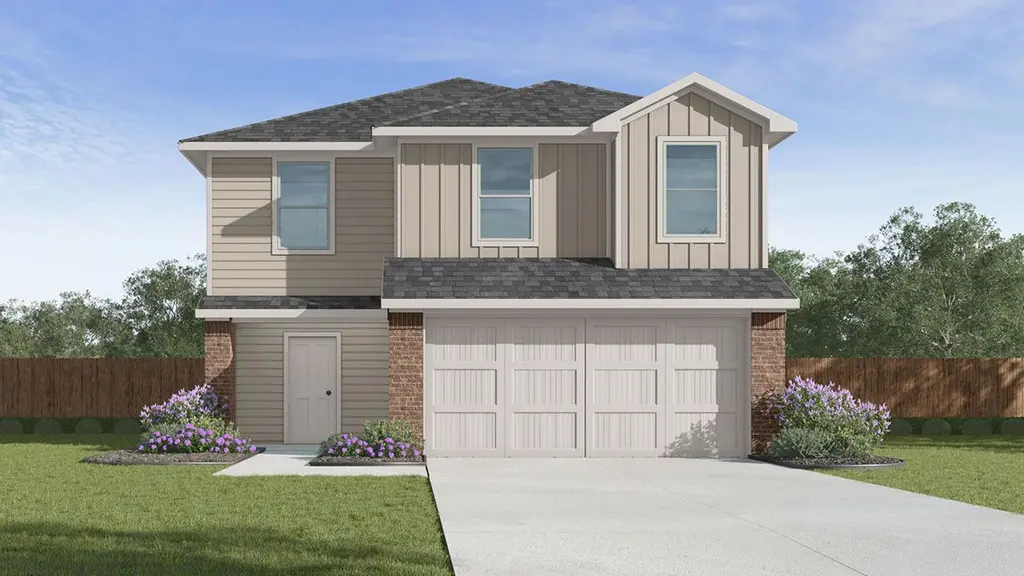
The Franklin Plan · Lytle, TX
Flood risk No data
- FEMA flood zone
- —
- Chance of flooding over 30 yrs
- —
- Est. flood insurance / yr
- —
Fire risk No data
- Est. fire insurance / yr
- —
Heat risk No data
- Hot days now (above threshold)
- —
- Hot days in 30 yrs
- —
Wind risk No data
- Chance of severe wind over 30 yrs
- —
Air-quality risk No data
- Unhealthy air days now
- —
- Unhealthy air days in 30 yrs
- —
Risk factors via First Street. Map © Google.
Why this score? — see what drove the D grade
The composite is a weighted blend of 9 inputs, each scored 0–100. Each bar is that input's sub-score; the figure is the points it added to the 100-point composite (weight × sub-score).
- Appreciation +8.1/10.0
- Cash flow +7.9/30.0
- ARV discount +7.5/15.0
- Condition / age +4.0/5.0
- Livability +3.5/5.0
- Rent growth +2.5/5.0
- 1% rule +2.4/10.0
- Schools +2.3/10.0
- DSCR +1.9/10.0
$274,000
🖨 Deal sheet 📄 Offer letter ✓ Due diligence
Listing remarks
The Franklin plan is one of our two-story homes featured in Saddle Ridge Estates in Lytle, TX. This new home layout offers 2 classic front exteriors, 5 bedrooms or 4 bedrooms with a loft space, 2.5 baths, 2 car-garage and 1891 square feet of comfortable living. Step inside The Franklin to find an elongated foyer opening to an open concept living room, kitchen, and dining area. The gourmet kitchen faces the living area so you don't miss a thing while cooking and includes quartz counter tops, stainless steel appliances and shaker style cabinetry. The main bedroom is located toward the front of the home on the second story and features an attractive attached bathroom with a walk-in shower, qua
Key facts
- Gourmet kitchen
- Walk-in shower
- Grand walk-in closet
Tags
Property features AI
Finance
- Financial info: List price $274,000
Exterior
- Parking: 2 total parking spaces; 2-car garage
- Home design: Single-family plan named The Franklin
- Exterior features: Living area approximately 1,892
Interior
- Bedrooms: 5 bedrooms
- Bathrooms: 2 full bathrooms and 1 half bathroom (2.5 total)
- Interior features: Active listing — The Franklin plan (new construction)
Neighborhood map
What this means for you Summary
Snapshot
- This is a 5-bed/2.5-bath single-family listed at $274k. Condition is rated good.
Deal economics
- At list price, monthly cash flow is $-386 ($-5k/yr) — negative.
- The deal already cash-flows at list — no discount required.
- To meet the 1% rule (rent ≥ 1% of price), the offer needs to be $264k (3.6% below list).
- Recommended offer: $264k (3.6% below list) — sets the bar for 1% rule.
- Cap rate 5.0% vs local median 3.8% in Lytle — top-decile yield for the area; either an underpriced asset or a hidden risk that comps aren't pricing in. Stress-test before assuming the spread holds.
Location & tenants
- Location reads 69/100 on livability (#404 in TX) — a middle-class / working-renter tenant base. Strengths: cost of living A+, housing A+, crime B+; Watch: schools F, amenities F, commute F.
- Lytle ISD (rural): math 24% / reading 27% proficiency, ranked #690 of 826 in TX (top 84%) — low school quality limits family demand, transient renter base, plan for 1-2y turnover; 63% free/reduced lunch — lower-income household profile, screen leases tightly.
- Market conditions: 107 active listings in the ZIP; 1 comparable units currently listed for rent nearby; 224 units permitted in Atascosa County in 2024 (0 in 5+ unit buildings).
Forward outlook
- In year one you build about $25k of equity ($2k loan paydown + $22k appreciation (6.2% local appreciation)).
- Atascosa County population projected at +41% by 2050 — long-run rental-demand tailwind backs the buy-and-hold thesis.
- By year 2, paydown + projected appreciation supports a ~$40k cash-out refi (75% LTV) — recoverable capital for the next deal without selling this one.
Negotiation context
- Only 9 days on market — expect competitive offers; lowballing is unlikely to land.
Questions for the listing agent
- What do current leases actually rent for vs. the listed asking? Can we see a recent rent roll and the last 12 months of T-12 income?
- Is there a deadline driving the sale (1031 exchange, divorce, estate, relocation)? That informs how much negotiation room exists.
- Schools are F-rated, which usually means shorter tenancies and higher turnover. Who's the typical renter profile here, and what's been the actual vacancy rate?
- The area grade is low — what's the realistic commute time and amenity access for the typical tenant pool here? Any planned neighborhood developments (good or bad) we should know about?
- What's the average days-on-market for RENTAL listings here right now (not sales)? A rising rental-DOM trend means longer vacancies and softer asking-rent achievability than the comps imply.
- What's the recent tenant-quality profile in this submarket — average credit score on applications, eviction rate, late-payment / NSF rate, and stable-employment percentage? A property-management company in the area should have these aggregated.
- How much new for-sale + rental construction is in the pipeline within 1–3 miles? Heavy new supply typically softens prices + rents 12–24 months out; constrained supply supports both.
Investment metrics
- 1% rule
- 0.74% ✗
- Cap rate
- 5.00%
- Cash-on-cash
- -4.62%
- DSCR
- 0.79
- GRM
- 11.3
CMA / ARV
- ARV (on-the-fly)
- $357,588
- Comps found
- 12
Show comp detail 12 sales within ~0.75 mi
| Address | Dist | Beds/Ba | Sqft | Sold | Price | $/sf | Match |
|---|---|---|---|---|---|---|---|
| 16036 Stratford Cv | 0.48mi | 5/2.5 | 2,118 (+12%) | 3mo | $370,900 | $175 | 55 |
| 16020 Stratford Cv | 0.52mi | 5/2.5 | 2,118 (+12%) | 3mo | $370,900 | $175 | 54 |
| 16001 Cabana Dr | 0.56mi | 5/2.5 | 2,118 (+12%) | 8mo | $366,900 | $173 | 48 |
| 16021 Stratford Cv | 0.48mi | 4/2.0 (-1) | 1,626 (-14%) | 3mo | $319,900 | $197 | 45 |
| 16021 Delgado Hls | 0.62mi | 5/2.5 | 2,118 (+12%) | 8mo | $360,900 | $170 | 45 |
| 16004 Stratford Cv | 0.52mi | 4/2.0 (-1) | 1,626 (-14%) | 1mo | $313,900 | $193 | 44 |
| 16024 Stratford Cv | 0.51mi | 4/2.0 (-1) | 1,626 (-14%) | 4mo | $319,900 | $197 | 43 |
| 16032 Stratford Cv | 0.50mi | 4/2.0 (-1) | 1,626 (-14%) | 6mo | $318,900 | $196 | 41 |
| 16009 Cabana Dr | 0.54mi | 4/2.0 (-1) | 1,626 (-14%) | 9mo | $307,900 | $189 | 37 |
| 16037 Delgado Hls | 0.62mi | 4/2.0 (-1) | 1,626 (-14%) | 9mo | $301,900 | $186 | 33 |
| 16000 Windview Ct | 0.68mi | 4/2.0 (-1) | 1,626 (-14%) | 7mo | $294,000 | $181 | 32 |
| 16005 Delgado Hls | 0.65mi | 4/2.0 (-1) | 1,626 (-14%) | 9mo | $315,900 | $194 | 32 |
Match score weights: distance 35% · size 25% · config 20% · recency 20%. Top-matched comps best support the ARV.
Projected returns pro-forma
6.25% appreciation · 3.0% rent growth · sell at horizon
- IRR
- 12.3%
- Equity multiple
- 1.84×
- Total profit
- $84,040
- Equity at exit
- $230,450
- IRR
- 13.0%
- Equity multiple
- 3.65×
- Total profit
- $265,173
- Equity at exit
- $422,880
Cash invested: $100,125 (down + closing). Projections, not guarantees.
Landlord ↔ Tenant lean methodology
- Overall (STATE)
- 87 Strongly Landlord-Friendly
- State Texas
- 87 Strongly Landlord-Friendly · R+5
- County
- — inherits STATE
- City
- — inherits STATE
ZIP-level market 78052
- Home prices YoY
- 2.9%
- Active inventory
- 107
- Price-to-rent
- 8.6×
Monthly cashflow live
- Estimated rent
- $2,640 medium interval (Pro) →
- Mortgage (P&I)
- −$1,875
- Tax est. 1.5%
- −$447 /mo · $5,364/yr
- Insurance
- −$149
- HOA
- −$0
- Vacancy / Maint / Mgmt
- −$554
- Net cashflow
- $-386
Break-even live
UW: 25.0% down · 7.5% · 30yr · 1.5% tax · 5.0% vac · 8.0% maint · 8.0% mgmt
Financing live
Cash to close
- Down payment
- $89,397
- Closing costs
- $10,728
- Reserves months
- —
- Total cash needed
- —
Loan-product check · same deal, 3 products live
Conventional
25% down · 7.5% · 30yr
- Down + closing
- —
- Monthly P&I
- —
- Monthly cashflow
- —
- DSCR
- —
- Eligible?
- —
Personal DTI + credit; lowest rate.
DSCR
20% down · 8.5% · 30yr
- Down + closing
- —
- Monthly P&I
- —
- Monthly cashflow
- —
- DSCR
- —
- Eligible?
- —
No personal income docs; deal must DSCR.
Hard money
10% down · 12.0% · 12mo
- Down + closing
- —
- Monthly P&I
- —
- Monthly cashflow
- —
- DSCR
- —
- Eligible?
- —
Short-term bridge; refi at stabilization.
Rent comps 1 comps
| Address | Beds | Baths | Sqft | Rent | $/sqft | DOM | Units | Dist |
|---|---|---|---|---|---|---|---|---|
| 16004 Tassel Br Lytle, TX | 2.0–5.0 | 2.0–2.5 | 1558 | $2,640 | $1.69 | 1d | 1 | 0.69mi |
Listing history 9 events
-
2026-06-18days on market $274,000 Active 9 DOM
-
2026-06-17days on market $274,000 Active 8 DOM
-
2026-06-16days on market $274,000 Active 7 DOM
-
2026-06-15days on market $274,000 Active 6 DOM
-
2026-06-15days on market $274,000 Active 5 DOM
-
2026-06-13days on market $274,000 Active 4 DOM
-
2026-06-12days on market $274,000 Active 3 DOM
-
2026-06-10remarks 699-char remark
-
2026-06-10$274,000 Active 1 DOM
ⓘ Source: listings_history table (triggers on properties + properties_extension) + one-shot
backfill from property_details.listing_events for pre-trigger history.
Nearby sold comps map
Loading sold comps map…
Walkable amenities ~0.75 mi
Loading nearby amenities…
Taxation est. · year 1
- Rental income
- $31,680
- − Mortgage interest
- −$20,030
- − Property taxes
- −$5,364
- − Insurance
- −$1,788
- − Repairs & maintenance
- −$2,534
- − Management
- −$2,534
- − Depreciation
- −$10,403
- Taxable loss
- −$10,974
- Est. tax savings @ 24.0%
- +$2,634
- After-tax cash flow
- $-1,994/yr
For passive investors: Depreciation is non-cash, so a rental often shows a tax loss while cash-flowing — sheltering income. Rental losses are passive: they offset passive income freely, and up to $25,000/yr can offset ordinary (W-2) income if you actively participate and your MAGI is under $100k (phasing out to $0 by $150k); unused losses carry forward. On sale, claimed depreciation is recaptured at up to 25%, and gains may owe capital-gains tax (a 1031 exchange can defer both). Figures are a year-1 estimate at your 24.0% rate — not tax advice; consult a CPA.
Condition & rehab AI · 6 photos
This two-story home in Lytle, TX is in excellent condition with a good condition score of 80. It features a well-maintained exterior, good kitchen and bathroom, and hardwood floors. The home is move-in ready with minor cosmetic updates that could further enhance its value.
Value-add opportunities
- Both Paint exterior siding — Enhances curb appeal and value
- Resale Replace countertops with granite — Improves kitchen aesthetics and value
- Both Install smart home devices — Enhances home's modern appeal and marketability
Renovation cost estimate screening
Value-add ROI direction
- Both Paint exterior siding — Enhances curb appeal and value ↑
- Resale Replace countertops with granite — Improves kitchen aesthetics and value ↑
- Both Install smart home devices — Enhances home's modern appeal and marketability ↑
ⓘ Cost ranges are severity-bucket heuristics (US national rule-of-thumb). Get contractor quotes + a written scope before underwriting a rehab budget.
Schools (NCES district)
- District
- Lytle ISD
- NCES district ID
- 4828650
- Math proficiency
- 24% ▼ -7.00%
- Reading proficiency
- 27% ▼ -3.00%
- Median HH income
- $54,478
- Composite
- 22.9/100
- National rank
- #8004
- State rank
- #690 of 826 in TX
Livability — Lytle
- Score
- 69/100
- State rank
- #404
- US rank
- #8374
Category grades
Schools grade is shown separately in the Schools card above.
Census & demographics
- Census place
- Lytle, TX
- Population (ZIP)
- 6,221
Population outlook (Atascosa County) Hauer SSP2
- Today (2025)
- 57,233 people
- By 2030
- 61,729 · +7.9%
- By 2040
- 71,122 · +24.3%
- By 2050
- 80,906 · +41.4%
- By 2075
- 106,134 · +85.4%
- By 2100
- 122,415 · +113.9%
Race, ethnicity, and origin ACS 2023
- Neighborhood character
- Predominantly Hispanic (66%)
- Race & ethnicity
- Hispanic / Latino 66% White 32% Two or more races 22% Native American 2%
- Hispanic origin (detail)
- Mexican 58%
- Common ancestry
- Lithuanian 3% Greek 2% Iranian 1%
- Foreign-born
- 11% · Canada
- Languages at home
- 54% English-only · Spanish 44% German/W. Germanic 1% Other Indo-European 1%
Political lean MEDSL · Atascosa
- 2024 margin
- Solid R (+43.3) · D 27.9% · R 71.3%
- 2008→2024 swing
- -32.8pp toward R · 2008: -10.5pp · 2024: -43.3pp
- All cycles
- 2024: R+43.3 2020: R+34.0 2016: R+29.1 2012: R+18.3 2008: R+10.5
Not yet ingested
- Civics
- —
Market trends
- HPI YoY
- ▲ 6.25%
- Current HPI
- 221.8201
- Rent YoY
- —
- Metro
- —
- State GDP YoY
- ▲ 3.95%
- F500 in state
- 110
Industry mix (Fortune 500 HQ in TX)
| Industry | F500 HQs | Revenue |
|---|---|---|
| Energy | 16 | $1,198B |
|
||
| Technology | 5 | $198B |
|
||
| Engineering / Construction | 4 | $72B |
|
||
| Energy Services | 3 | $60B |
|
||
| Utilities | 3 | $41B |
|
||
| Healthcare | 2 | $330B |
|
||
Cash-flow waterfall
monthlySold comps — $/sqft
last 12 mo · ≤1 miLoading sold comps…