5352 Merritt Dr · Chincoteague, VA
Flood risk 10/10 · Severe
- FEMA flood zone
- AE
- Chance of flooding over 30 yrs
- 0.99%
- Est. flood insurance / yr
- $1,737 – $8,500
Fire risk 3/10 · Minor
- Est. fire insurance / yr
- $666 – $1,236
Heat risk 9/10 · Severe
- Hot days now (above 99°F)
- 7 days/yr
- Hot days in 30 yrs
- 18 days/yr
Wind risk 8/10 · Major
- Chance of severe wind over 30 yrs
- 80.0%
Air-quality risk 2/10 · Minimal
- Unhealthy air days now
- 0 days/yr
- Unhealthy air days in 30 yrs
- 1 days/yr
Risk factors via First Street. Map © Google.
Why this score? — see what drove the C- grade
The composite is a weighted blend of 9 inputs, each scored 0–100. Each bar is that input's sub-score; the figure is the points it added to the 100-point composite (weight × sub-score).
- Cash flow +20.3/30.0
- ARV discount +7.5/15.0
- DSCR +6.4/10.0
- 1% rule +5.4/10.0
- Schools +4.3/10.0
- Livability +3.2/5.0
- Rent growth +2.5/5.0
- Condition / age +2.5/5.0
- Appreciation +0.0/10.0
$150,000
🖨 Deal sheet 📄 Offer letter ✓ Due diligence
Listing remarks MLS
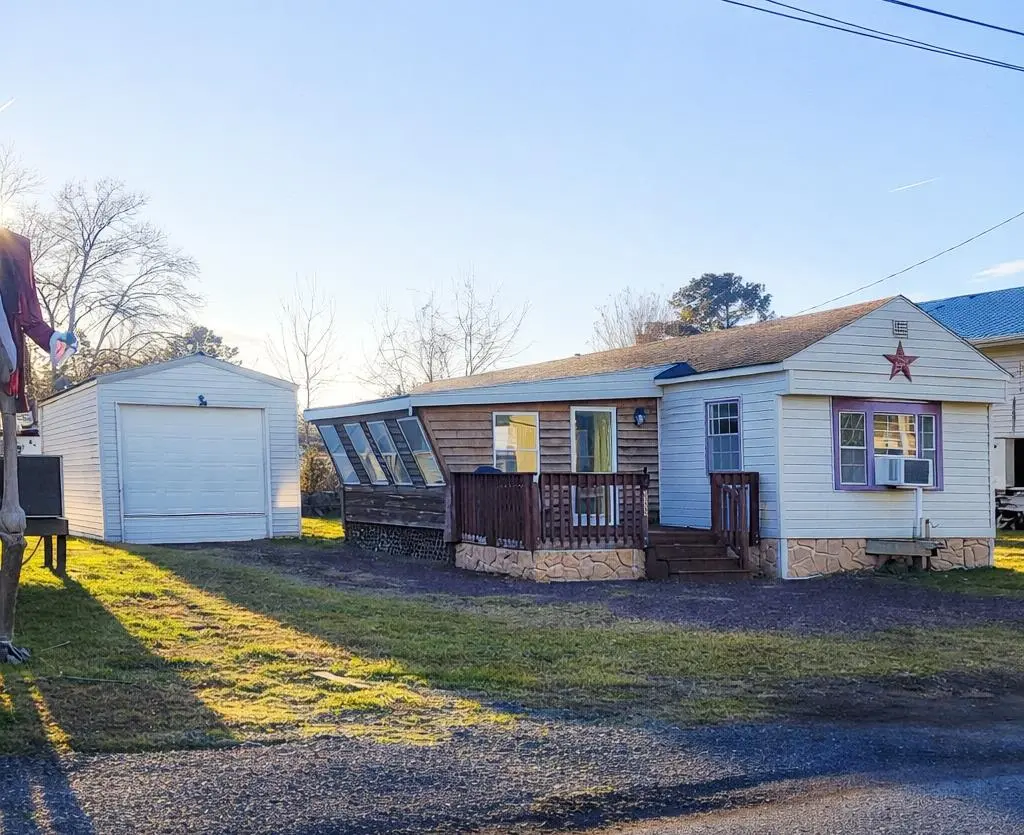
Affordable Chincoteague Opportunity! This 3 bedroom, 1 bath mobile home at 5352 Merritt offers an excellent chance to own on Chincoteague at an affordable price point. Ideal for investment, long-term rental or personal island use, this property delivers a practical layout, comfortable living space, sunroom, detached garage and a HOT TUB. This home is just minutes from downtown Chincoteague and local shops, restaurants and the beaches of Assateague Island.
Key facts
- Hot tub
- Sunroom
- Restaurants
Tags
Neighborhood map
What this means for you Summary
Snapshot
- This is a 3-bed/1.0-bath single-family listed at $150k.
Deal economics
- At list price, monthly cash flow is $-235 ($-3k/yr) — negative.
- To cash-flow at today's rent, offer at most $116k (22.7% below list).
- Meets the 1% rule at list price ($2k rent vs $150k).
- Recommended offer: $116k (22.7% below list) — sets the bar for cash-flow.
- Cap rate 7.8% vs local median 1.3% in Chincoteague — top-decile yield for the area; either an underpriced asset or a hidden risk that comps aren't pricing in. Stress-test before assuming the spread holds.
Location & tenants
- Location reads 64/100 on livability (#350 in VA) — a middle-class / working-renter tenant base. Strengths: schools A, crime A, housing A-; Watch: employment D+, cost of living D+, amenities F.
- Accomack County Public School District (rural): math 44% / reading 59% proficiency, ranked #99 of 131 in VA (top 76%) — acceptable for families but not a draw, mixed tenant base, ~2y average lease; 63% free/reduced lunch — lower-income household profile, screen leases tightly.
- Market conditions: 158 active listings in the ZIP; 181 units permitted in Accomack County in 2024 (0 in 5+ unit buildings).
Forward outlook
- Local home prices are declining (-3.0%/yr); year-one equity from $1k of loan paydown is wiped out by about $4k of value loss. Plan a longer hold.
- Accomack County population projected at -14% by 2050 — secular population decline; favor cash flow + early exit over multi-decade hold.
Negotiation context
- It's been on market 142 days — a 12% lower offer ($132k) is reasonable based on typical stale-listing flexibility.
Risks & watch-outs
- Watch-outs: flood insurance adds $427/mo.
- Climate carrying-cost: in FEMA flood zone AE (mandatory federal flood insurance); severe wind risk, 80% chance of damaging wind over 30y; extreme-heat days projected 7→18/yr by 2055 (HVAC capex compounding) — expect insurance premiums to compound above CPI over the hold.
Questions for the listing agent
- What do current leases actually rent for vs. the listed asking? Can we see a recent rent roll and the last 12 months of T-12 income?
- It's been on market 142 days. Have you received any prior offers? Is the seller open to a 23% concession, seller financing, or rate buy-down credit?
- Built in 1973 — when were the roof, HVAC, electrical panel, plumbing, and water heater last replaced?
- What's the actual annual flood-insurance premium (NFIP or private), and is the property in a SFHA with mandatory coverage?
- Why hasn't it sold? Are there any deal-killer items the seller is aware of (foundation, flood, title, zoning, code violations)?
- Is there a deadline driving the sale (1031 exchange, divorce, estate, relocation)? That informs how much negotiation room exists.
- Schools are A-rated — typically a magnet for longer-tenancy family renters. What's the average tenant stay here, and is there a school-zone premium baked into asking?
- What's the average days-on-market for RENTAL listings here right now (not sales)? A rising rental-DOM trend means longer vacancies and softer asking-rent achievability than the comps imply.
- What's the recent tenant-quality profile in this submarket — average credit score on applications, eviction rate, late-payment / NSF rate, and stable-employment percentage? A property-management company in the area should have these aggregated.
- How much new for-sale + rental construction is in the pipeline within 1–3 miles? Heavy new supply typically softens prices + rents 12–24 months out; constrained supply supports both.
Investment metrics
- 1% rule
- 1.04% ✓
- Cap rate
- 7.82%
- Cash-on-cash
- 5.46%
- DSCR
- 1.24
- GRM
- 8.0
CMA / ARV
- ARV (median comp)
- $340,903
- List price
- $150,000
- Delta
- -56.00%
- Verdict
- UNDERPRICED
- Comps
- 20 within 1.0 mi
Show comp detail 9 sales within ~0.75 mi
| Address | Dist | Beds/Ba | Sqft | Sold | Price | $/sf | Match |
|---|---|---|---|---|---|---|---|
| 6033 Lewis St | 0.47mi | 3/1.0 | 1,106 (+0%) | 2mo | $295,000 | $267 | 76 |
| 5032 Main St | 0.11mi | 3/1.5 | 1,120 (+2%) | 20mo | $500,000 | $446 | 73 |
| 4670 Main St | 0.15mi | 2/1.0 (-1) | 1,086 (-1%) | 20mo | $369,000 | $340 | 70 |
| 5186 Main St | 0.35mi | 2/2.0 (-1) | 1,058 (-4%) | 3mo | $424,000 | $401 | 65 |
| 5250 Pine Tree Way | 0.53mi | 2/2.0 (-1) | 1,120 (+2%) | 13mo | $392,000 | $350 | 52 |
| 4496 Main St | 0.44mi | 3/2.0 | 1,184 (+8%) | 15mo | $598,500 | $505 | 50 |
| 6029 Daisy St | 0.43mi | 2/1.0 (-1) | 982 (-11%) | 9mo | $281,000 | $286 | 49 |
| 4475 Deep Hole Rd | 0.67mi | 3/3.5 | 1,240 (+13%) | 2mo | $375,000 | $302 | 36 |
| 5376 Pearl Dr | 0.62mi | 2/2.0 (-1) | 1,254 (+14%) | 19mo | $320,000 | $255 | 23 |
Match score weights: distance 35% · size 25% · config 20% · recency 20%. Top-matched comps best support the ARV.
Projected returns pro-forma
-3.0% appreciation · 3.0% rent growth · sell at horizon
- IRR
- -27.6%
- Equity multiple
- 0.07×
- Total profit
- $-39,006
- Equity at exit
- $22,365
- IRR
- -25.1%
- Equity multiple
- -0.24×
- Total profit
- $-52,101
- Equity at exit
- $12,969
Cash invested: $42,000 (down + closing). Projections, not guarantees.
Landlord ↔ Tenant lean methodology
- Overall (STATE)
- 55 Moderately Landlord-Leaning
- State Virginia
- 55 Moderately Landlord-Leaning · D+2
- County
- — inherits STATE
- City
- — inherits STATE
ZIP-level market 23336
- Active inventory
- 158
- Price-to-rent
- 8.0×
Monthly cashflow live
- Estimated rent
- $1,554 medium interval (Pro) →
- Mortgage (P&I)
- −$787
- Tax est. 1.5%
- −$188 /mo · $2,250/yr
- Insurance
- −$62
- Flood insurance flood zone
- −$427 /mo · $5,118/yr
- HOA
- −$0
- Vacancy / Maint / Mgmt
- −$326
- Net cashflow
- $-235
Break-even live
UW: 25.0% down · 7.5% · 30yr · 1.5% tax · 5.0% vac · 8.0% maint · 8.0% mgmt
Financing live
Cash to close
- Down payment
- $37,500
- Closing costs
- $4,500
- Reserves months
- —
- Total cash needed
- —
Loan-product check · same deal, 3 products live
Conventional
25% down · 7.5% · 30yr
- Down + closing
- —
- Monthly P&I
- —
- Monthly cashflow
- —
- DSCR
- —
- Eligible?
- —
Personal DTI + credit; lowest rate.
DSCR
20% down · 8.5% · 30yr
- Down + closing
- —
- Monthly P&I
- —
- Monthly cashflow
- —
- DSCR
- —
- Eligible?
- —
No personal income docs; deal must DSCR.
Hard money
10% down · 12.0% · 12mo
- Down + closing
- —
- Monthly P&I
- —
- Monthly cashflow
- —
- DSCR
- —
- Eligible?
- —
Short-term bridge; refi at stabilization.
Listing history 5 events
-
2026-06-03days on market $150,000 Active 142 DOM
-
2026-06-02days on market $150,000 Active 141 DOM
-
2026-06-01days on market $150,000 Active 140 DOM
-
2026-05-31days on market $150,000 Active 139 DOM
-
2026-01-13$160,000 Active 459-char remark
Show marketing remark (459 chars)
Affordable Chincoteague Opportunity! This 3 bedroom, 1 bath mobile home at 5352 Merritt offers an excellent chance to own on Chincoteague at an affordable price point. Ideal for investment, long-term rental or personal island use, this property delivers a practical layout, comfortable living space, sunroom, detached garage and a HOT TUB. This home is just minutes from downtown Chincoteague and local shops, restaurants and the beaches of Assateague Island.
ⓘ Source: listings_history table (triggers on properties + properties_extension) + one-shot
backfill from property_details.listing_events for pre-trigger history.
Climate risk First Street
- Flood 10/10 Extreme FEMA zone AE · 99% chance over 30 yrs
- Wildfire 3/10 Moderate
- Heat 9/10 Extreme 7 d/yr ≥99°F today · 18 d/yr by 30 yrs out
- Wind 8/10 Severe 80% chance of damaging wind over 30 yrs
- Air quality 2/10 Low 0 unhealthy d/yr today · 1 by 30 yrs out
Nearby sold comps map
Loading sold comps map…
Walkable amenities ~0.75 mi
Loading nearby amenities…
Taxation est. · year 1
- Rental income
- $18,651
- − Mortgage interest
- −$8,402
- − Property taxes
- −$2,250
- − Insurance
- −$5,868
- − Repairs & maintenance
- −$1,492
- − Management
- −$1,492
- − Depreciation
- −$4,364
- Taxable loss
- −$5,217
- Est. tax savings @ 24.0%
- +$1,252
- After-tax cash flow
- $-1,571/yr
For passive investors: Depreciation is non-cash, so a rental often shows a tax loss while cash-flowing — sheltering income. Rental losses are passive: they offset passive income freely, and up to $25,000/yr can offset ordinary (W-2) income if you actively participate and your MAGI is under $100k (phasing out to $0 by $150k); unused losses carry forward. On sale, claimed depreciation is recaptured at up to 25%, and gains may owe capital-gains tax (a 1031 exchange can defer both). Figures are a year-1 estimate at your 24.0% rate — not tax advice; consult a CPA.
Schools (NCES district)
- District
- Accomack County Public School District
- NCES district ID
- 5100060
- Math proficiency
- 44% ▼ -36.00%
- Reading proficiency
- 59% ▼ -10.00%
- Median HH income
- $40,348
- Composite
- 43.05/100
- National rank
- #3096
- State rank
- #99 of 131 in VA
Livability — Chincoteague
- Score
- 64/100
- State rank
- #350
- US rank
- #13891
Category grades
Schools grade is shown separately in the Schools card above.
Census & demographics
- Census place
- Chincoteague, VA
- City population
- 3,323
- Population (ZIP)
- 3,323
Population outlook (Accomack County) Hauer SSP2
- Today (2025)
- 32,072 people
- By 2030
- 31,425 · -2.0%
- By 2040
- 29,685 · -7.4%
- By 2050
- 27,748 · -13.5%
- By 2075
- 23,396 · -27.1%
- By 2100
- 18,774 · -41.5%
Race, ethnicity, and origin ACS 2023
- Neighborhood character
- Predominantly White (93%)
- Race & ethnicity
- White 93% Two or more races 5% Hispanic / Latino 2%
- Common ancestry
- Romanian 3% Portuguese 2% Iranian 2%
- Foreign-born
- 4% · Canada
- Languages at home
- 97% English-only · Arabic 2% Spanish 2%
Political lean MEDSL · Accomack
- 2024 margin
- R (+13.3) · D 43.0% · R 56.3%
- 2008→2024 swing
- -11.9pp toward R · 2008: -1.4pp · 2024: -13.3pp
- All cycles
- 2024: R+13.3 2020: R+9.4 2016: R+11.7 2012: R+3.5 2008: R+1.4
Not yet ingested
- Civics
- —
Market trends
- HPI YoY
- ▼ -162.07%
- Current HPI
- 202.7427
- Rent YoY
- —
- Metro
- —
- State GDP YoY
- ▲ 2.40%
- F500 in state
- 50
Industry mix (Fortune 500 HQ in VA)
| Industry | F500 HQs | Revenue |
|---|---|---|
| Aerospace / Defense | 4 | $236B |
|
||
| Technology / Defense | 3 | $32B |
|
||
| Financial Services | 2 | $176B |
|
||
| Utilities | 2 | $27B |
|
||
| Insurance | 2 | $25B |
|
||
| Technology | 2 | $15B |
|
||
Price history
1 event — show timeline
- 2026-01-13 Listed $160,000 ESAR
Property tax history
-1.2%/yrLatest (2025): $247 · +0.0% YoY. Source: county tax records.
Cash-flow waterfall
monthlySold comps — $/sqft
last 12 mo · ≤1 miLoading sold comps…