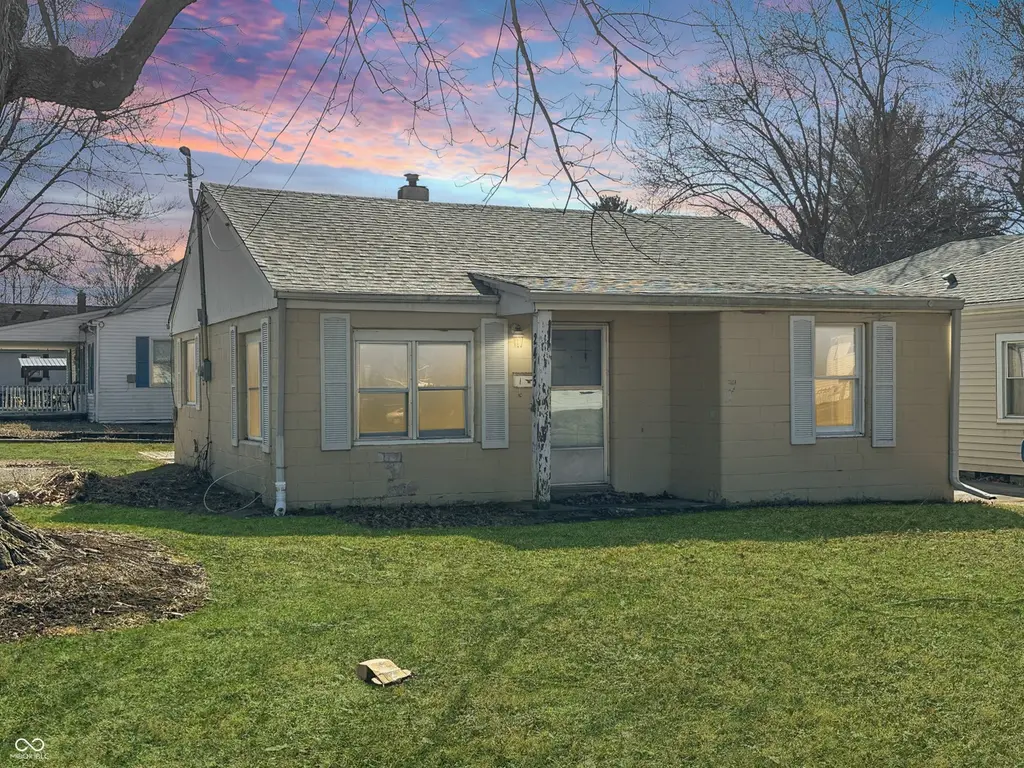
2415 E 9th St · Anderson, IN
Flood risk 1/10 · Minimal
- FEMA flood zone
- X (unshaded)
- Chance of flooding over 30 yrs
- 0.0%
- Est. flood insurance / yr
- $507 – $1,088
Fire risk 1/10 · Minimal
- Est. fire insurance / yr
- $717 – $1,331
Heat risk 3/10 · Minor
- Hot days now (above 100°F)
- 7 days/yr
- Hot days in 30 yrs
- 18 days/yr
Wind risk 2/10 · Minimal
- Chance of severe wind over 30 yrs
- 0.0%
Air-quality risk 2/10 · Minimal
- Unhealthy air days now
- 1 days/yr
- Unhealthy air days in 30 yrs
- 2 days/yr
Risk factors via First Street. Map © Google.
Why this score? — see what drove the B grade
The composite is a weighted blend of 9 inputs, each scored 0–100. Each bar is that input's sub-score; the figure is the points it added to the 100-point composite (weight × sub-score).
- Cash flow +28.9/30.0
- ARV discount +15.0/15.0
- DSCR +10.0/10.0
- 1% rule +8.5/10.0
- Rent growth +3.0/5.0
- Livability +3.0/5.0
- Condition / age +2.5/5.0
- Schools +1.6/10.0
- Appreciation +0.0/10.0
$72,500
🖨 Deal sheet 📄 Offer letter ✓ Due diligence
Listing remarks MLS
Cute 2 bedroom bungalow on Anderson's east side. Freshly painted and new flooring throughout. New kitchen countertops and kitchen appliances. House would make a great starter home or an investment property.
Key facts
- New flooring
- Freshly painted
- 4,680 sq ft lot
Tags
Neighborhood map
What this means for you Summary
Snapshot
- This is a 2-bed/1.0-bath single-family listed at $72k.
Deal economics
- At list price, monthly cash flow is $246 ($3k/yr) — positive.
- The deal already cash-flows at list — no discount required.
- Meets the 1% rule at list price ($979 rent vs $72k).
- Recommended offer: $68k (6.0% below list) — sets the bar for market timing.
- Cap rate 10.4% vs local median 6.5% in Anderson — top-decile yield for the area; either an underpriced asset or a hidden risk that comps aren't pricing in. Stress-test before assuming the spread holds.
Location & tenants
- Location reads 60/100 on livability (#521 in IN) — a middle-class / working-renter tenant base. Strengths: cost of living A+, housing A+; Watch: schools F, crime D-, amenities F.
- Anderson Community School Corporation (urban): math 15% / reading 23% proficiency, ranked #280 of 301 in IN (top 93%) — low school quality limits family demand, transient renter base, plan for 1-2y turnover; 70% free/reduced lunch — lower-income household profile, screen leases tightly.
- Market conditions: Rents rising (+1.8%/yr); 159 active listings in the ZIP; 18 comparable units currently listed for rent nearby; rentals lingering (median 44d on market — plan ~5-8 weeks vacancy on turnover, expect pricing pressure); 50% of comp listings sitting > 30 days — soft ceiling on asking rent; 184 units permitted in Madison County in 2024 (0 in 5+ unit buildings).
Forward outlook
- Local home prices are declining (-3.0%/yr); year-one equity from $501 of loan paydown is wiped out by about $2k of value loss. Plan a longer hold.
- Madison County population projected at -14% by 2050 — secular population decline; favor cash flow + early exit over multi-decade hold.
- At projected returns (-3.0% appreciation + 1.8% rent growth), your $20k cash investment doubles in ~10 years — after that, you're playing with house money.
Negotiation context
- It's been on market 87 days — a 6% lower offer ($68k) is reasonable based on typical stale-listing flexibility.
- 2 sale attempts since 26y ago with the ask held roughly flat each time — persistent listings suggest the price (not the market) is what's stuck; bring a comps-based counter.
- Current owner paid $40k; list at $72k implies a 82% gain — meaningful room to come down on a strong offer.
Risks & watch-outs
- Watch-outs: built in 1950 — expect roof / HVAC / electrical / plumbing capex.
Questions for the listing agent
- It's been on market 87 days. Have you received any prior offers? Is the seller open to a 6% concession, seller financing, or rate buy-down credit?
- Built in 1950 — when were the roof, HVAC, electrical panel, plumbing, and water heater last replaced?
- Why hasn't it sold? Are there any deal-killer items the seller is aware of (foundation, flood, title, zoning, code violations)?
- Is there a deadline driving the sale (1031 exchange, divorce, estate, relocation)? That informs how much negotiation room exists.
- Schools are F-rated, which usually means shorter tenancies and higher turnover. Who's the typical renter profile here, and what's been the actual vacancy rate?
- Crime grade is D in this area — have there been break-ins, vandalism, or insurance claims at this property in the last 3 years? What carrier currently insures it and at what premium?
- What's the average days-on-market for RENTAL listings here right now (not sales)? A rising rental-DOM trend means longer vacancies and softer asking-rent achievability than the comps imply.
- What's the recent tenant-quality profile in this submarket — average credit score on applications, eviction rate, late-payment / NSF rate, and stable-employment percentage? A property-management company in the area should have these aggregated.
- How much new for-sale + rental construction is in the pipeline within 1–3 miles? Heavy new supply typically softens prices + rents 12–24 months out; constrained supply supports both.
Investment metrics
- 1% rule
- 1.35% ✓
- Cap rate
- 10.36%
- Cash-on-cash
- 14.54%
- DSCR
- 1.65
- GRM
- 6.2
CMA / ARV
- ARV (median comp)
- $105,381
- List price
- $72,500
- Delta
- -31.20%
- Verdict
- UNDERPRICED
- Comps
- 20 within 1.0 mi
Show comp detail 12 sales within ~0.75 mi
| Address | Dist | Beds/Ba | Sqft | Sold | Price | $/sf | Match |
|---|---|---|---|---|---|---|---|
| 2415 E 9th St | 0.00mi | 2/1.0 | 773 (0%) | 0mo | $75,000 | $97 | 100 |
| 830 Chester St | 0.07mi | 2/1.0 | 800 (+4%) | 2mo | $130,000 | $163 | 89 |
| 2524 E 5th St | 0.33mi | 2/1.0 | 780 (+1%) | 2mo | $27,000 | $35 | 82 |
| 2614 E 8th St | 0.20mi | 2/1.0 | 741 (-4%) | 12mo | $98,900 | $133 | 74 |
| 817 Alhambra Dr | 0.38mi | 2/1.0 | 792 (+2%) | 9mo | $70,000 | $88 | 71 |
| 2612 Fowler St | 0.31mi | 2/1.0 | 693 (-10%) | 1mo | $117,900 | $170 | 68 |
| 614 Harrison St | 0.30mi | 2/1.0 | 866 (+12%) | 0mo | $145,000 | $167 | 66 |
| 630 Chester St | 0.16mi | 2/1.0 | 882 (+14%) | 6mo | $130,000 | $147 | 64 |
| 2508 E 4th St | 0.38mi | 2/1.0 | 676 (-12%) | 14mo | $89,900 | $133 | 50 |
| 2317 E 3rd St | 0.43mi | 3/1.0 (+1) | 888 (+15%) | 2mo | $142,000 | $160 | 48 |
| 2315 E 3rd St | 0.43mi | 2/1.0 | 888 (+15%) | 10mo | $60,000 | $68 | 47 |
| 1739 E 18th St | 0.70mi | 2/1.0 | 869 (+12%) | 10mo | $30,000 | $35 | 38 |
Match score weights: distance 35% · size 25% · config 20% · recency 20%. Top-matched comps best support the ARV.
Projected returns pro-forma
-3.0% appreciation · 1.82% rent growth · sell at horizon
- IRR
- 3.6%
- Equity multiple
- 1.14×
- Total profit
- $2,803
- Equity at exit
- $10,810
- IRR
- 12.0%
- Equity multiple
- 1.89×
- Total profit
- $18,141
- Equity at exit
- $6,268
Cash invested: $20,300 (down + closing). Projections, not guarantees.
Landlord ↔ Tenant lean methodology
- Overall (STATE)
- 90 Strongly Landlord-Friendly
- State Indiana
- 90 Strongly Landlord-Friendly · R+11
- County
- — inherits STATE
- City
- — inherits STATE
ZIP-level market 46012
- Home prices YoY
- -18.6%
- Rents YoY
- 1.8%
- Active inventory
- 159
- Price-to-rent
- 6.2×
Monthly cashflow live
- Estimated rent
- $979 high interval (Pro) →
- Mortgage (P&I)
- −$380
- Tax from tax record
- −$117 /mo · $1,400/yr
- Insurance
- −$30
- HOA
- −$0
- Vacancy / Maint / Mgmt
- −$206
- Net cashflow
- $246
Break-even live
UW: 25.0% down · 7.5% · 30yr · 1.5% tax · 5.0% vac · 8.0% maint · 8.0% mgmt
Financing live
Cash to close
- Down payment
- $18,125
- Closing costs
- $2,175
- Reserves months
- —
- Total cash needed
- —
Loan-product check · same deal, 3 products live
Conventional
25% down · 7.5% · 30yr
- Down + closing
- —
- Monthly P&I
- —
- Monthly cashflow
- —
- DSCR
- —
- Eligible?
- —
Personal DTI + credit; lowest rate.
DSCR
20% down · 8.5% · 30yr
- Down + closing
- —
- Monthly P&I
- —
- Monthly cashflow
- —
- DSCR
- —
- Eligible?
- —
No personal income docs; deal must DSCR.
Hard money
10% down · 12.0% · 12mo
- Down + closing
- —
- Monthly P&I
- —
- Monthly cashflow
- —
- DSCR
- —
- Eligible?
- —
Short-term bridge; refi at stabilization.
Rent comps 18 comps
| Address | Beds | Baths | Sqft | Rent | $/sqft | DOM | Units | Dist |
|---|---|---|---|---|---|---|---|---|
| 2412 E 7th St Anderson, IN | 2.0 | 1.0 | 600 | $895 | $1.49 | 2d | 1 | 0.14mi |
| 2505 E 10th St Anderson, IN | 1.0–2.0 | 1.0 | 850 | $949 | $1.12 | 44d | 2 | 0.14mi |
| 530 Alhambra Dr Anderson, IN | 1.0–2.0 | 1.0 | 879 | $1,100 | $1.25 | 44d | 1 | 0.40mi |
| 608 Ellenhurst Dr Anderson, IN | 2.0 | 1.0 | 686 | $1,100 | $1.60 | 23d | 1 | 0.40mi |
| 1045 Alhambra Dr Unit 6 Anderson, IN | 2.0 | 1.5 | 900 | $975 | $1.08 | 23d | 1 | 0.41mi |
| 1829 E 8th St Anderson, IN | 1.0–3.0 | 1.0 | 810 | $1,025 | $1.27 | 23d | 9 | 0.43mi |
| 2625 Lindberg Rd Anderson, IN | 1.0–2.0 | 1.0 | 756 | $1,385 | $1.83 | 44d | 1 | 0.88mi |
| 917 E 8th St Unit 2 Anderson, IN | 2.0 | 1.0 | 550 | $825 | $1.50 | 7d | 1 | 1.04mi |
| 919 E 6th St Apt 2 Anderson, IN | 1.0 | 1.0 | 700 | $625 | $0.89 | 23d | 1 | 1.05mi |
| 1719 Johnson Ave Anderson, IN | 1.0 | 1.0 | 616 | $824 | $1.34 | 44d | 1 | 1.06mi |
| 915 High St Unit 915 1/2 Anderson, IN | 1.0 | 1.0 | 600 | $650 | $1.08 | 44d | 1 | 1.16mi |
| 1411 Home Ave Anderson, IN | 3.0 | 1.0 | 810 | $1,295 | $1.60 | 23d | 1 | 1.29mi |
| 1710 Jefferson St Apt 2 Anderson, IN | 2.0 | 1.0 | 550 | $950 | $1.73 | 44d | 1 | 1.31mi |
| 2233 E Lynn St Anderson, IN | 1.0 | 1.0 | 700 | $695 | $0.99 | 2d | 1 | 1.32mi |
| 414 Wheeler Ave Apt B Anderson, IN | 1.0 | 1.0 | 600 | $650 | $1.08 | 44d | 1 | 1.37mi |
| 2002 Jefferson St Unit 3 Anderson, IN | 1.0 | 2.0 | 725 | $600 | $0.83 | 44d | 1 | 1.39mi |
| 1726-1728 Walnut St Anderson, IN | 2.0 | 2.0 | 900 | $995 | $1.11 | 2d | 1 | 1.43mi |
| 223 E 11th St Anderson, IN | 2.0 | 1.0 | 800 | $900 | $1.12 | 44d | 1 | 1.48mi |
Listing history 4 events
-
2026-03-26price $72,500 206-char remark
Show marketing remark (206 chars)
Cute 2 bedroom bungalow on Anderson's east side. Freshly painted and new flooring throughout. New kitchen countertops and kitchen appliances. House would make a great starter home or an investment property.
-
2026-02-25$75,000 Active 206-char remark
Show marketing remark (206 chars)
Cute 2 bedroom bungalow on Anderson's east side. Freshly painted and new flooring throughout. New kitchen countertops and kitchen appliances. House would make a great starter home or an investment property.
-
2000-05-31soldstatus $39,900 78-char remark
Show marketing remark (78 chars)
PC465 NEWER ROOF/FURNANCE/CENTRAL AIR/WATER HEATER. IMMEDIATE POSSESSION!!!!!!
-
2000-03-27$41,500 78-char remark
Show marketing remark (78 chars)
PC465 NEWER ROOF/FURNANCE/CENTRAL AIR/WATER HEATER. IMMEDIATE POSSESSION!!!!!!
ⓘ Source: listings_history table (triggers on properties + properties_extension) + one-shot
backfill from property_details.listing_events for pre-trigger history.
Tax reassessment forecast IN · Partial reset (capped growth)
- Current annual tax
- $1,400 · $117/mo
- Projected year-2 tax
- $1,400 · $117/mo
- Expected delta
- $0/yr ($0/mo · 0.0%)
ⓘ Screening estimate from a state-policy table — verify with the county assessor before closing.
Climate risk First Street
- Flood 1/10 Low FEMA zone X (unshaded) · 0% chance over 30 yrs
- Wildfire 1/10 Low
- Heat 3/10 Moderate 7 d/yr ≥100°F today · 18 d/yr by 30 yrs out
- Wind 2/10 Low 0% chance of damaging wind over 30 yrs
- Air quality 2/10 Low 1 unhealthy d/yr today · 2 by 30 yrs out
Nearby sold comps map
Loading sold comps map…
Walkable amenities ~0.75 mi
Loading nearby amenities…
Taxation est. · year 1
- Rental income
- $11,743
- − Mortgage interest
- −$4,061
- − Property taxes
- −$1,400
- − Insurance
- −$362
- − Repairs & maintenance
- −$939
- − Management
- −$939
- − Depreciation
- −$2,109
- Taxable income
- $1,932
- Est. tax owed @ 24.0%
- −$464
- After-tax cash flow
- $2,489/yr
For passive investors: Depreciation is non-cash, so a rental often shows a tax loss while cash-flowing — sheltering income. Rental losses are passive: they offset passive income freely, and up to $25,000/yr can offset ordinary (W-2) income if you actively participate and your MAGI is under $100k (phasing out to $0 by $150k); unused losses carry forward. On sale, claimed depreciation is recaptured at up to 25%, and gains may owe capital-gains tax (a 1031 exchange can defer both). Figures are a year-1 estimate at your 24.0% rate — not tax advice; consult a CPA.
Schools (NCES district)
- District
- Anderson Community School Corporation
- NCES district ID
- 1800150
- Math proficiency
- 15% ▼ -14.00%
- Reading proficiency
- 23% ▼ -7.00%
- Median HH income
- $38,208
- Composite
- 15.93/100
- National rank
- #9250
- State rank
- #280 of 301 in IN
Livability — Anderson
- Score
- 60/100
- State rank
- #521
- US rank
- #18709
Category grades
Schools grade is shown separately in the Schools card above.
Census & demographics
- Census place
- Anderson, IN
- County
- Madison County · 69,445 people
- City population
- 57,762
- Metro
- Indianapolis-Carmel-Anderson, IN
- Population (ZIP)
- 20,855
- Household income
- $58,041
- Rent vs Own
- Severe rent burden
- 987.0
Population outlook (Madison County) Hauer SSP2
- Today (2025)
- 125,800 people
- By 2030
- 122,640 · -2.5%
- By 2040
- 115,420 · -8.3%
- By 2050
- 108,148 · -14.0%
- By 2075
- 91,838 · -27.0%
- By 2100
- 75,670 · -39.8%
Race, ethnicity, and origin ACS 2023
- Neighborhood character
- Predominantly White (85%)
- Race & ethnicity
- White 85% Hispanic / Latino 5% Two or more races 4% Black 4%
- Hispanic origin (detail)
- Mexican 4%
- Common ancestry
- Slovak 3% Serbian 2% Italian 1%
- Foreign-born
- 2% · Canada, Vietnam
- Languages at home
- 96% English-only · Spanish 3%
Political lean MEDSL · Madison
- 2024 margin
- Strong R (+26.9) · D 35.6% · R 62.5% · Other 1.9%
- 2008→2024 swing
- -33.5pp toward R · 2008: 6.5pp · 2024: -26.9pp
- All cycles
- 2024: R+26.9 2020: R+22.6 2016: R+25.7 2012: R+4.5 2008: D+6.5
Not yet ingested
- Civics
- —
Market trends
- HPI YoY
- ▼ -61.16%
- Current HPI
- 266.9819
- Rent YoY
- ▲ 1.82%
- Metro
- Indianapolis-Carmel-Anderson, IN
- State GDP YoY
- ▲ 2.90%
- F500 in state
- 18
Industry mix (Fortune 500 HQ in IN)
| Industry | F500 HQs | Revenue |
|---|---|---|
| Industrial Machinery | 2 | $37B |
|
||
| Healthcare | 1 | $177B |
|
||
| Pharmaceuticals | 1 | $45B |
|
||
| Metals / Steel | 1 | $18B |
|
||
| Agriculture | 1 | $17B |
|
||
| Packaging | 1 | $12B |
|
||
Price history
+74.7% since first listed4 events — show timeline
- 2026-03-26 Price Changed $72,500 MIBOR as Distributed by MLS Grid
- 2026-02-25 Listed $75,000 MIBOR as Distributed by MLS Grid
- 2000-05-31 Sold (MLS) $39,900 MIBOR as Distributed by MLS Grid
- 2000-03-27 Listed $41,500 MIBOR as Distributed by MLS Grid
Property tax history
+8.8%/yrLatest (2024): $1,400 · +9.0% YoY. Source: county tax records.
Cash-flow waterfall
monthlySold comps — $/sqft
last 12 mo · ≤1 miLoading sold comps…