200 Brookwood Dr · Callender Lake, TX
Flood risk No data
- FEMA flood zone
- —
- Chance of flooding over 30 yrs
- —
- Est. flood insurance / yr
- —
Fire risk No data
- Est. fire insurance / yr
- —
Heat risk No data
- Hot days now (above threshold)
- —
- Hot days in 30 yrs
- —
Wind risk No data
- Chance of severe wind over 30 yrs
- —
Air-quality risk No data
- Unhealthy air days now
- —
- Unhealthy air days in 30 yrs
- —
Risk factors via First Street. Map © Google.
Why this score? — see what drove the B- grade
The composite is a weighted blend of 9 inputs, each scored 0–100. Each bar is that input's sub-score; the figure is the points it added to the 100-point composite (weight × sub-score).
- Cash flow +26.9/30.0
- DSCR +9.3/10.0
- ARV discount +7.5/15.0
- Appreciation +7.3/10.0
- 1% rule +7.0/10.0
- Schools +3.7/10.0
- Livability +2.6/5.0
- Rent growth +2.5/5.0
- Condition / age +2.5/5.0
$109,900
🖨 Deal sheet 📄 Offer letter ✓ Due diligence
Listing remarks MLS
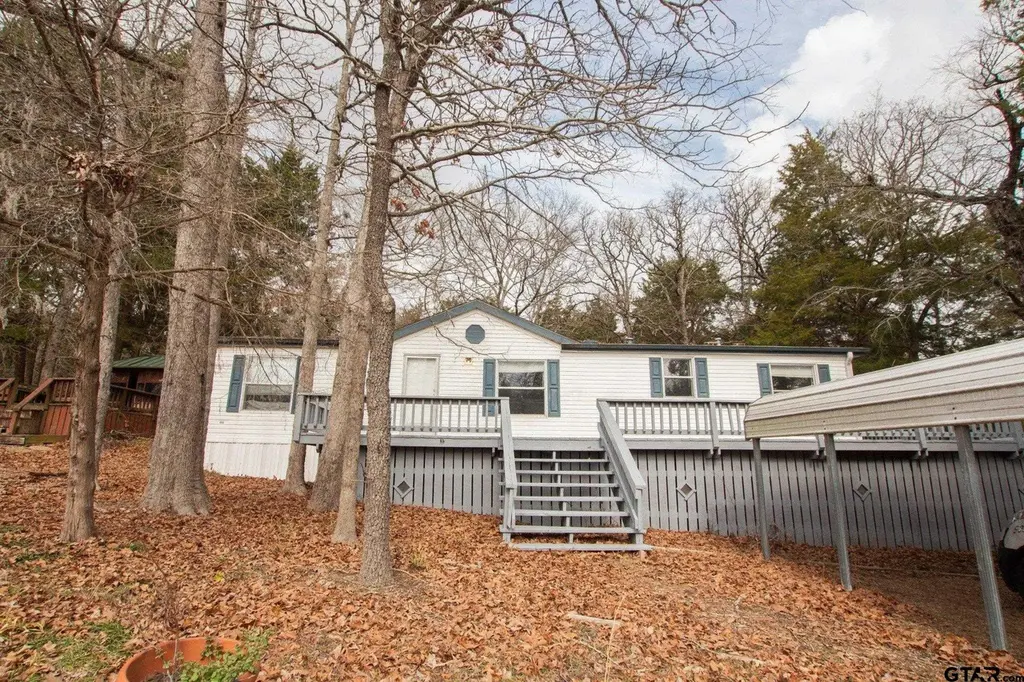
Discover the perfect getaway in this charming waterview vacation home, ideally located within a private, gated community. Set on two spacious lots, this 3-bedroom, 2-bath retreat offers a rare blend of privacy, comfort, and scenic surroundings—ideal for relaxing weekends or memorable gatherings with family and friends. The thoughtfully designed layout features light-filled living spaces that flow effortlessly, creating a welcoming atmosphere throughout. Outdoor space provides endless opportunities for entertaining, recreation, or future enhancements. Whether you’re seeking a serene second home, a vacation rental opportunity, or a full-time residence, this property delivers exceptional versatility in a community setting. A unique opportunity to own a waterview escape where every day feels like a retreat.
Key facts
- Two spacious lots
- Outdoor space
- 0.36 acre lot
Tags
Neighborhood map
What this means for you Summary
Snapshot
- This is a 3-bed/2.0-bath manufactured listed at $110k.
Deal economics
- At list price, monthly cash flow is $304 ($4k/yr) — positive.
- The deal already cash-flows at list — no discount required.
- Meets the 1% rule at list price ($1k rent vs $110k).
- Recommended offer: $97k (12.0% below list) — sets the bar for market timing.
- Cap rate 9.6% vs local median 3.2% in Callender Lake — top-decile yield for the area; either an underpriced asset or a hidden risk that comps aren't pricing in. Stress-test before assuming the spread holds.
Location & tenants
- Location reads 52/100 on livability (#1,447 in TX) — a working-class tenant base; expect higher turnover. Strengths: cost of living A+, crime A; Watch: schools F, amenities F, commute F.
- Brownsboro ISD (rural): math 42% / reading 46% proficiency, ranked #290 of 826 in TX (top 35%) — families likely to look elsewhere, expect single-tenant / working-renter base with shorter leases.
- Market conditions: 109 active listings in the ZIP; 54 units permitted in Van Zandt County in 2024 (0 in 5+ unit buildings).
Forward outlook
- In year one you build about $6k of equity ($760 loan paydown + $5k appreciation (4.6% local appreciation)).
- Van Zandt County population projected at +4% by 2050 — modest demand growth; plan on rents tracking national, not racing it.
- At projected returns (4.6% appreciation + 3.0% rent growth), your $31k cash investment doubles in ~4 years — after that, you're playing with house money.
- By year 6, paydown + projected appreciation supports a ~$31k cash-out refi (75% LTV) — recoverable capital for the next deal without selling this one.
Negotiation context
- It's been on market 130 days — a 12% lower offer ($97k) is reasonable based on typical stale-listing flexibility.
- 3 sale attempts since 9y ago; this cycle's ask has dropped $10k (8%) from the opening price — seller is motivated, your offer sets the floor, not the list.
Questions for the listing agent
- It's been on market 130 days. Have you received any prior offers? Is the seller open to a 12% concession, seller financing, or rate buy-down credit?
- What does the HOA fee cover, when was the last increase, and are there any pending special assessments or reserve-fund shortfalls?
- Why hasn't it sold? Are there any deal-killer items the seller is aware of (foundation, flood, title, zoning, code violations)?
- Is there a deadline driving the sale (1031 exchange, divorce, estate, relocation)? That informs how much negotiation room exists.
- Schools are F-rated, which usually means shorter tenancies and higher turnover. Who's the typical renter profile here, and what's been the actual vacancy rate?
- What's the average days-on-market for RENTAL listings here right now (not sales)? A rising rental-DOM trend means longer vacancies and softer asking-rent achievability than the comps imply.
- What's the recent tenant-quality profile in this submarket — average credit score on applications, eviction rate, late-payment / NSF rate, and stable-employment percentage? A property-management company in the area should have these aggregated.
- How much new for-sale + rental construction is in the pipeline within 1–3 miles? Heavy new supply typically softens prices + rents 12–24 months out; constrained supply supports both.
Investment metrics
- 1% rule
- 1.20% ✓
- Cap rate
- 9.61%
- Cash-on-cash
- 11.86%
- DSCR
- 1.53
- GRM
- 7.0
CMA / ARV
- ARV (median comp)
- $249,457
- List price
- $109,900
- Delta
- -55.94%
- Verdict
- UNDERPRICED
- Comps
- 2 within 1.0 mi
Show comp detail 4 sales within ~0.75 mi
| Address | Dist | Beds/Ba | Sqft | Sold | Price | $/sf | Match |
|---|---|---|---|---|---|---|---|
| 180 Sweetgum Trl | 0.19mi | 3/2.0 | 1,440 (-1%) | 22mo | $245,000 | $170 | 71 |
| 782 Dogwood Trl | 0.25mi | 3/2.0 | 1,288 (-12%) | 11mo | $260,000 | $202 | 60 |
| 1185 Hickory Hills Dr | 0.19mi | 4/2.0 (+1) | 1,664 (+14%) | 21mo | $140,000 | $84 | 45 |
| 253 E Walnut Trl | 0.64mi | 3/2.0 | 1,344 (-8%) | 22mo | $84,000 | $63 | 39 |
Match score weights: distance 35% · size 25% · config 20% · recency 20%. Top-matched comps best support the ARV.
Projected returns pro-forma
4.59% appreciation · 3.0% rent growth · sell at horizon
- IRR
- 22.2%
- Equity multiple
- 2.37×
- Total profit
- $42,157
- Equity at exit
- $59,561
- IRR
- 22.0%
- Equity multiple
- 4.64×
- Total profit
- $111,988
- Equity at exit
- $100,614
Cash invested: $30,772 (down + closing). Projections, not guarantees.
Landlord ↔ Tenant lean methodology
- Overall (STATE)
- 87 Strongly Landlord-Friendly
- State Texas
- 87 Strongly Landlord-Friendly · R+5
- County
- — inherits STATE
- City
- — inherits STATE
ZIP-level market 75778
- Home prices YoY
- 2.2%
- Active inventory
- 109
- Price-to-rent
- 7.0×
Monthly cashflow live
- Estimated rent
- $1,317 medium interval (Pro) →
- Mortgage (P&I)
- −$576
- Tax from tax record
- −$56 /mo · $673/yr
- Insurance
- −$46
- HOA
- −$58
- Vacancy / Maint / Mgmt
- −$277
- Net cashflow
- $304
Break-even live
UW: 25.0% down · 7.5% · 30yr · 1.5% tax · 5.0% vac · 8.0% maint · 8.0% mgmt
Financing live
Cash to close
- Down payment
- $27,475
- Closing costs
- $3,297
- Reserves months
- —
- Total cash needed
- —
Loan-product check · same deal, 3 products live
Conventional
25% down · 7.5% · 30yr
- Down + closing
- —
- Monthly P&I
- —
- Monthly cashflow
- —
- DSCR
- —
- Eligible?
- —
Personal DTI + credit; lowest rate.
DSCR
20% down · 8.5% · 30yr
- Down + closing
- —
- Monthly P&I
- —
- Monthly cashflow
- —
- DSCR
- —
- Eligible?
- —
No personal income docs; deal must DSCR.
Hard money
10% down · 12.0% · 12mo
- Down + closing
- —
- Monthly P&I
- —
- Monthly cashflow
- —
- DSCR
- —
- Eligible?
- —
Short-term bridge; refi at stabilization.
HOA detail
- Monthly dues
- $58 · $696/yr
- Likely covers
- watersecurity
Listing history 21 events
-
2026-06-19days on market $109,900 Active 130 DOM
-
2026-06-18days on market $109,900 Active 129 DOM
-
2026-06-17days on market $109,900 Active 128 DOM
-
2026-06-16days on market $109,900 Active 127 DOM
-
2026-06-15days on market $109,900 Active 126 DOM
-
2026-06-14days on market $109,900 Active 124 DOM
-
2026-06-13days on market $109,900 Active 123 DOM
-
2026-06-10days on market $109,900 Active 121 DOM
-
2026-06-09days on market $109,900 Active 120 DOM
-
2026-06-08days on market $109,900 Active 119 DOM
-
2026-06-07days on market $109,900 Active 118 DOM
-
2026-06-02days on market $109,900 Active 113 DOM
-
2026-06-01days on market $109,900 Active 112 DOM
-
2026-05-31days on market $109,900 Active 111 DOM
-
2026-05-30days on market $109,900 Active 110 DOM
-
2026-05-13price $109,900 826-char remark
Show marketing remark (826 chars)
Discover the perfect getaway in this charming waterview vacation home, ideally located within a private, gated community. Set on two spacious lots, this 3-bedroom, 2-bath retreat offers a rare blend of privacy, comfort, and scenic surroundings—ideal for relaxing weekends or memorable gatherings with family and friends. The thoughtfully designed layout features light-filled living spaces that flow effortlessly, creating a welcoming atmosphere throughout. Outdoor space provides endless opportunities for entertaining, recreation, or future enhancements. Whether you’re seeking a serene second home, a vacation rental opportunity, or a full-time residence, this property delivers exceptional versatility in a community setting. A unique opportunity to own a waterview escape where every day feels like a retreat.
-
2026-02-09$119,900 Active 826-char remark
Show marketing remark (826 chars)
Discover the perfect getaway in this charming waterview vacation home, ideally located within a private, gated community. Set on two spacious lots, this 3-bedroom, 2-bath retreat offers a rare blend of privacy, comfort, and scenic surroundings—ideal for relaxing weekends or memorable gatherings with family and friends. The thoughtfully designed layout features light-filled living spaces that flow effortlessly, creating a welcoming atmosphere throughout. Outdoor space provides endless opportunities for entertaining, recreation, or future enhancements. Whether you’re seeking a serene second home, a vacation rental opportunity, or a full-time residence, this property delivers exceptional versatility in a community setting. A unique opportunity to own a waterview escape where every day feels like a retreat.
-
2018-11-19soldstatus 382-char remark
Show marketing remark (382 chars)
Nice 1998 Manufactured home with 3 bedrooms and 2 baths affixed permanently to two lots that have lake view. Home also comes with a hot tub located in nice building at side of house. The home would be perfect for a full time residence or weekend getaway. Home also has 80 sq. ft storage building for your use. Home is in gated community with great fishing, swimming, & boating.
-
2018-11-19soldstatus
Show marketing remark (382 chars)
Nice 1998 Manufactured home with 3 bedrooms and 2 baths affixed permanently to two lots that have lake view. Home also comes with a hot tub located in nice building at side of house. The home would be perfect for a full time residence or weekend getaway. Home also has 80 sq. ft storage building for your use. Home is in gated community with great fishing, swimming, & boating.
-
2018-10-29$79,500
-
2017-12-03$79,500 382-char remark
Show marketing remark (382 chars)
Nice 1998 Manufactured home with 3 bedrooms and 2 baths affixed permanently to two lots that have lake view. Home also comes with a hot tub located in nice building at side of house. The home would be perfect for a full time residence or weekend getaway. Home also has 80 sq. ft storage building for your use. Home is in gated community with great fishing, swimming, & boating.
ⓘ Source: listings_history table (triggers on properties + properties_extension) + one-shot
backfill from property_details.listing_events for pre-trigger history.
Tax reassessment forecast TX · Resets to sale price
- Current annual tax
- $673 · $56/mo
- Projected year-2 tax
- $2,011 · $168/mo
- Expected delta
- +$1,338/yr (+$111/mo · 198.7%)
ⓘ Screening estimate from a state-policy table — verify with the county assessor before closing.
Nearby sold comps map
Loading sold comps map…
Walkable amenities ~0.75 mi
Loading nearby amenities…
Taxation est. · year 1
- Rental income
- $15,804
- − Mortgage interest
- −$6,156
- − Property taxes
- −$673
- − Insurance
- −$550
- − Repairs & maintenance
- −$1,264
- − Management
- −$1,264
- − HOA
- −$696
- − Depreciation
- −$3,197
- Taxable income
- $2,004
- Est. tax owed @ 24.0%
- −$481
- After-tax cash flow
- $3,170/yr
For passive investors: Depreciation is non-cash, so a rental often shows a tax loss while cash-flowing — sheltering income. Rental losses are passive: they offset passive income freely, and up to $25,000/yr can offset ordinary (W-2) income if you actively participate and your MAGI is under $100k (phasing out to $0 by $150k); unused losses carry forward. On sale, claimed depreciation is recaptured at up to 25%, and gains may owe capital-gains tax (a 1031 exchange can defer both). Figures are a year-1 estimate at your 24.0% rate — not tax advice; consult a CPA.
Schools (NCES district)
- District
- Brownsboro ISD
- NCES district ID
- 4811640
- Math proficiency
- 42% ▼ -5.00%
- Reading proficiency
- 46% ▬ 0.00%
- Median HH income
- $45,624
- Composite
- 37.38/100
- National rank
- #4429
- State rank
- #290 of 826 in TX
Livability — Callender Lake
- Score
- 52/100
- State rank
- #1447
- US rank
- #24766
Category grades
Schools grade is shown separately in the Schools card above.
Census & demographics
- Census place
- Callender Lake, TX
- Population (ZIP)
- 2,987
Population outlook (Van Zandt County) Hauer SSP2
- Today (2025)
- 55,634 people
- By 2030
- 56,479 · +1.5%
- By 2040
- 57,672 · +3.7%
- By 2050
- 57,913 · +4.1%
- By 2075
- 57,544 · +3.4%
- By 2100
- 52,659 · -5.3%
Race, ethnicity, and origin ACS 2023
- Neighborhood character
- Predominantly White (80%)
- Race & ethnicity
- White 80% Black 9% Two or more races 8% Hispanic / Latino 4%
- Common ancestry
- Slovak 2% Portuguese 1% Serbian 1%
- Foreign-born
- 2% · Canada
- Languages at home
- 97% English-only · Spanish 3%
Political lean MEDSL · Van Zandt
- 2024 margin
- Solid R (+74.8) · D 12.3% · R 87.2%
- 2008→2024 swing
- -19.8pp toward R · 2008: -55.1pp · 2024: -74.8pp
- All cycles
- 2024: R+74.8 2020: R+72.1 2016: R+72.1 2012: R+66.6 2008: R+55.1
Not yet ingested
- Civics
- —
Market trends
- HPI YoY
- ▲ 4.59%
- Current HPI
- 216.4151
- Rent YoY
- —
- Metro
- —
- State GDP YoY
- ▲ 3.95%
- F500 in state
- 110
Industry mix (Fortune 500 HQ in TX)
| Industry | F500 HQs | Revenue |
|---|---|---|
| Energy | 16 | $1,198B |
|
||
| Technology | 5 | $198B |
|
||
| Engineering / Construction | 4 | $72B |
|
||
| Energy Services | 3 | $60B |
|
||
| Utilities | 3 | $41B |
|
||
| Healthcare | 2 | $330B |
|
||
Price history
+38.2% since first listed6 events — show timeline
- 2026-05-13 Price Changed $109,900 GTAR
- 2026-02-09 Listed $119,900 GTAR
- 2018-11-19 Sold (MLS) — GTAR
- 2018-11-19 Sold (MLS) — HCBOR
- 2018-10-29 Listed $79,500 GTAR
- 2017-12-03 Listed $79,500 HCBOR
Property tax history
+3.2%/yrLatest (2018): $673 · +1.5% YoY. Source: county tax records.
Cash-flow waterfall
monthlySold comps — $/sqft
last 12 mo · ≤1 miLoading sold comps…