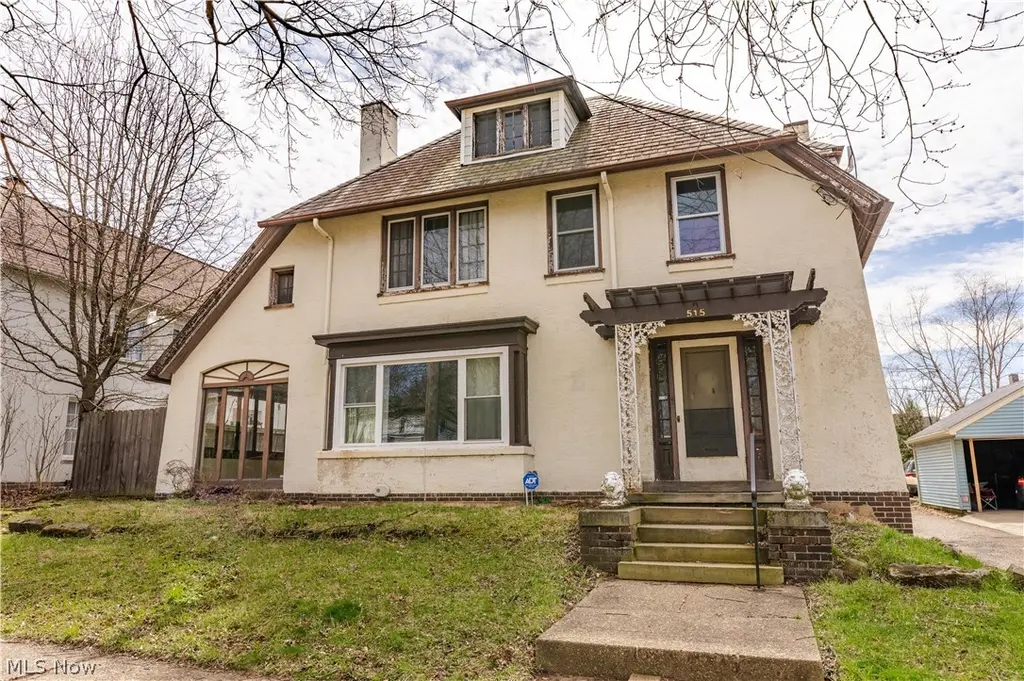
515 Federal Ave NE · Massillon, OH
Flood risk 1/10 · Minimal
- FEMA flood zone
- X (unshaded)
- Chance of flooding over 30 yrs
- 0.0%
- Est. flood insurance / yr
- $473 – $860
Fire risk 1/10 · Minimal
- Est. fire insurance / yr
- $713 – $1,323
Heat risk 3/10 · Minor
- Hot days now (above 97°F)
- 7 days/yr
- Hot days in 30 yrs
- 17 days/yr
Wind risk 1/10 · Minimal
- Chance of severe wind over 30 yrs
- —
Air-quality risk 2/10 · Minimal
- Unhealthy air days now
- 0 days/yr
- Unhealthy air days in 30 yrs
- 1 days/yr
Risk factors via First Street. Map © Google.
Why this score? — see what drove the C- grade
The composite is a weighted blend of 9 inputs, each scored 0–100. Each bar is that input's sub-score; the figure is the points it added to the 100-point composite (weight × sub-score).
- ARV discount +15.0/15.0
- Cash flow +13.8/30.0
- DSCR +4.2/10.0
- Rent growth +4.0/5.0
- Schools +4.0/10.0
- 1% rule +3.9/10.0
- Livability +3.7/5.0
- Condition / age +2.5/5.0
- Appreciation +0.0/10.0
$169,900
🖨 Deal sheet (PDF) 📄 Offer letter ✓ Due diligence
Listing remarks MLS
Elegant, large historic home. 2354 sq ft of finished living space. Stunning original features have been preserved. Many updates including forced air gas heat and central air conditioning, electrical system, plumbing and a large updated kitchen with breakfast bar. Features include beautiful hardwood floors throughout (ceramic in kitchen, baths and sun room). Front and back staircases. 9ft ceilings. Living room has French doors and a wood burning fireplace with a marble surround. Large formal dining room with chandelier and paneled wainscoting. Awesome library with built-ins and original paneling. Large 4-season sun room. Vintage baths with original fixtures and tile. 4 spacious bedrooms have walk-in closets. Large 3rd floor is ready for finishing. Basement includes a fabulous recreation room with custom tile and a one-of-a-kind fireplace as well as a wet bar with a beer tap. Fully fenced back yard includes an expansive raised deck and lots of space providing excellent options for stylis
Key facts
- Original hardwoods
- Formal dining room
- French doors
Tags
Neighborhood map
What this means for you Summary
Snapshot
- This is a 4-bed/1.5-bath single-family listed at $170k.
Deal economics
- At list price, monthly cash flow is $16 ($192/yr) — positive.
- The deal already cash-flows at list — no discount required.
- To meet the 1% rule (rent ≥ 1% of price), the offer needs to be $151k (10.9% below list).
- Recommended offer: $151k (10.9% below list) — sets the bar for 1% rule.
- Cap rate 6.4% vs local median 3.8% in Massillon — top-decile yield for the area; either an underpriced asset or a hidden risk that comps aren't pricing in. Stress-test before assuming the spread holds.
Location & tenants
- Location reads 74/100 on livability (#306 in OH, #4,928 nationally) — a middle-class / working-renter tenant base. Strengths: cost of living A+, housing A+, health & safety A-; Watch: employment C-, amenities F, commute F.
- Massillon City (urban): math 43% / reading 52% proficiency, ranked #487 of 656 in OH (top 74%) — families likely to look elsewhere, expect single-tenant / working-renter base with shorter leases; 60% free/reduced lunch — lower-income household profile, screen leases tightly.
- Zoned schools: Franklin Elementary School (math 47% / reading 47%, grade D-, #942 of 1,584 statewide, top 61%, 434 students, 0% FRL); Massillon Intermediate School (math 38% / reading 51%, grade D, #477 of 654 statewide, top 74%, 880 students, 0% FRL); Washington High School (math 30% / reading 59%, grade F, #470 of 781 statewide, top 62%, 1,179 students, 0% FRL) — zoned schools average 0% FRL vs 60% district-wide (60 pts lower); this property's tenant base skews higher-income than the district average.
- Market conditions: Rents rising fast (+6.0%/yr); 212 active listings in the ZIP; 528 units permitted in Stark County in 2024 (84 in 5+ unit buildings).
Forward outlook
- Local home prices are declining (-3.0%/yr); year-one equity from $1k of loan paydown is wiped out by about $5k of value loss. Plan a longer hold.
- Stark County population projected to shrink 8% by 2050 — rents likely to lag national; underwrite the cash flow, not the appreciation.
Negotiation context
- Only 14 days on market — expect competitive offers; lowballing is unlikely to land.
- 10 sale attempts since 26y ago; this cycle's ask has dropped $20k (11%) from the opening price — seller is motivated, your offer sets the floor, not the list.
- Current owner paid $70k; list at $170k implies a 143% gain — meaningful room to come down on a strong offer.
Risks & watch-outs
- Watch-outs: built in 1919 — expect roof / HVAC / electrical / plumbing capex.
Questions for the listing agent
- Built in 1919 — when were the roof, HVAC, electrical panel, plumbing, and water heater last replaced?
- Is there a deadline driving the sale (1031 exchange, divorce, estate, relocation)? That informs how much negotiation room exists.
- Schools are B-rated — typically a magnet for longer-tenancy family renters. What's the average tenant stay here, and is there a school-zone premium baked into asking?
- What's the average days-on-market for RENTAL listings here right now (not sales)? A rising rental-DOM trend means longer vacancies and softer asking-rent achievability than the comps imply.
- What's the recent tenant-quality profile in this submarket — average credit score on applications, eviction rate, late-payment / NSF rate, and stable-employment percentage? A property-management company in the area should have these aggregated.
- How much new for-sale + rental construction is in the pipeline within 1–3 miles? Heavy new supply typically softens prices + rents 12–24 months out; constrained supply supports both.
Investment metrics
- 1% rule
- 0.89% ✗
- Cap rate
- 6.41%
- Cash-on-cash
- 0.40%
- DSCR
- 1.02
- GRM
- 9.3
CMA / ARV
- ARV (on-the-fly)
- $227,898
- Comps found
- 5
Show comp detail 5 sales within ~0.75 mi
| Address | Dist | Beds/Ba | Sqft | Sold | Price | $/sf | Match |
|---|---|---|---|---|---|---|---|
| 411 4th St NE | 0.22mi | 3/3.0 (-1) | 2,320 (+1%) | 2mo | $230,000 | $99 | 76 |
| 433 7th St NE | 0.23mi | 4/1.5 | 2,064 (-10%) | 4mo | $167,500 | $81 | 69 |
| 850 Wallace Ave SE | 0.24mi | 4/2.0 | 1,980 (-14%) | 10mo | $65,000 | $33 | 55 |
| 730 Phillips Rd NE | 0.69mi | 3/2.0 (-1) | 2,386 (+4%) | 17mo | $250,000 | $105 | 41 |
| 740 Phillips Rd NE | 0.70mi | 3/1.5 (-1) | 2,036 (-12%) | 7mo | $250,000 | $123 | 37 |
Match score weights: distance 35% · size 25% · config 20% · recency 20%. Top-matched comps best support the ARV.
Projected returns pro-forma
-3.0% appreciation · 6.04% rent growth · sell at horizon
- IRR
- -12.3%
- Equity multiple
- 0.54×
- Total profit
- $-21,713
- Equity at exit
- $25,333
- IRR
- 0.9%
- Equity multiple
- 1.07×
- Total profit
- $3,359
- Equity at exit
- $14,690
Cash invested: $47,572 (down + closing). Projections, not guarantees.
Landlord ↔ Tenant lean methodology
- Overall (STATE)
- 73 Landlord-Friendly
- State Ohio
- 73 Landlord-Friendly · R+6
- County
- — inherits STATE
- City
- — inherits STATE
ZIP-level market 44646
- Rents YoY
- 6.0%
- Active inventory
- 212
- Price-to-rent
- 9.3×
Monthly cashflow live
- Estimated rent
- $1,514 medium interval (Pro) →
- Mortgage (P&I)
- −$891
- Tax from tax record
- −$219 /mo · $2,622/yr
- Insurance
- −$71
- HOA
- −$0
- Vacancy / Maint / Mgmt
- −$318
- Net cashflow
- $16
Break-even live
Sensitivity live
| Price | -10% $112 | -5% $64 | +0% $16 | +5% $-32 | +10% $-80 |
|---|---|---|---|---|---|
| Rent | -10% $-104 | -5% $-44 | +0% $16 | +5% $76 | +10% $136 |
| Rate | -1.0pp $102 | -0.5pp $59 | base $16 | +0.5pp $-28 | +1.0pp $-73 |
UW: 25.0% down · 7.5% · 30yr · 1.5% tax · 5.0% vac · 8.0% maint · 8.0% mgmt
Financing live
Cash to close
- Down payment
- $42,475
- Closing costs
- $5,097
- Reserves months
- —
- Total cash needed
- —
Loan-product check · same deal, 3 products live
Conventional
25% down · 7.5% · 30yr
- Down + closing
- —
- Monthly P&I
- —
- Monthly cashflow
- —
- DSCR
- —
- Eligible?
- —
Personal DTI + credit; lowest rate.
DSCR
20% down · 8.5% · 30yr
- Down + closing
- —
- Monthly P&I
- —
- Monthly cashflow
- —
- DSCR
- —
- Eligible?
- —
No personal income docs; deal must DSCR.
Hard money
10% down · 12.0% · 12mo
- Down + closing
- —
- Monthly P&I
- —
- Monthly cashflow
- —
- DSCR
- —
- Eligible?
- —
Short-term bridge; refi at stabilization.
Listing history 39 events
-
2026-04-13status Pending
-
2026-04-08price $169,900
-
2026-03-30$189,900 Active
-
2020-11-04price $79,900
-
2020-11-04price $79,900
-
2020-08-25price $79,900
-
2019-08-10price $79,900
-
2019-01-24soldstatus $70,000 Sold 1000-char remark
Show marketing remark (1000 chars)
Elegant, large historic home. 2354 sq ft of finished living space. Stunning original features have been preserved. Many updates including forced air gas heat and central air conditioning, electrical system, plumbing and a large updated kitchen with breakfast bar. Features include beautiful hardwood floors throughout (ceramic in kitchen, baths and sun room). Front and back staircases. 9ft ceilings. Living room has French doors and a wood burning fireplace with a marble surround. Large formal dining room with chandelier and paneled wainscoting. Awesome library with built-ins and original paneling. Large 4-season sun room. Vintage baths with original fixtures and tile. 4 spacious bedrooms have walk-in closets. Large 3rd floor is ready for finishing. Basement includes a fabulous recreation room with custom tile and a one-of-a-kind fireplace as well as a wet bar with a beer tap. Fully fenced back yard includes an expansive raised deck and lots of space providing excellent options for stylis
-
2018-12-13status Pending 1000-char remark
Show marketing remark (1000 chars)
Elegant, large historic home. 2354 sq ft of finished living space. Stunning original features have been preserved. Many updates including forced air gas heat and central air conditioning, electrical system, plumbing and a large updated kitchen with breakfast bar. Features include beautiful hardwood floors throughout (ceramic in kitchen, baths and sun room). Front and back staircases. 9ft ceilings. Living room has French doors and a wood burning fireplace with a marble surround. Large formal dining room with chandelier and paneled wainscoting. Awesome library with built-ins and original paneling. Large 4-season sun room. Vintage baths with original fixtures and tile. 4 spacious bedrooms have walk-in closets. Large 3rd floor is ready for finishing. Basement includes a fabulous recreation room with custom tile and a one-of-a-kind fireplace as well as a wet bar with a beer tap. Fully fenced back yard includes an expansive raised deck and lots of space providing excellent options for stylis
-
2018-11-27$75,000 Active 1000-char remark
Show marketing remark (1000 chars)
Elegant, large historic home. 2354 sq ft of finished living space. Stunning original features have been preserved. Many updates including forced air gas heat and central air conditioning, electrical system, plumbing and a large updated kitchen with breakfast bar. Features include beautiful hardwood floors throughout (ceramic in kitchen, baths and sun room). Front and back staircases. 9ft ceilings. Living room has French doors and a wood burning fireplace with a marble surround. Large formal dining room with chandelier and paneled wainscoting. Awesome library with built-ins and original paneling. Large 4-season sun room. Vintage baths with original fixtures and tile. 4 spacious bedrooms have walk-in closets. Large 3rd floor is ready for finishing. Basement includes a fabulous recreation room with custom tile and a one-of-a-kind fireplace as well as a wet bar with a beer tap. Fully fenced back yard includes an expansive raised deck and lots of space providing excellent options for stylis
-
2018-10-09status Pending
-
2018-10-08historical
-
2018-10-03$69,900 Active
-
2015-05-16price $103,000
-
2013-11-15price $79,900
-
2013-11-04soldstatus $61,200
-
2013-08-02$57,800
-
2006-11-22soldstatus $119,900
-
2006-11-22historical
-
2006-11-22soldstatus $119,000
-
2006-08-22$129,900
-
2006-08-22$129,900
-
2003-10-14soldstatus $115,000
-
2003-06-09historical
-
2002-12-12$119,900
-
2002-02-25soldstatus $112,000
-
2002-01-17historical
-
2001-12-03$114,500
-
2001-11-30historical
-
2001-07-31$124,500
-
2001-06-19historical
-
2000-12-21$103,000
-
1999-03-23price $103,000
-
1999-03-23price $103,000
-
1999-03-23price $103,000
-
1999-03-23price $103,000
-
1999-03-23price $103,000
-
1999-03-19soldstatus $103,000
-
1985-07-15soldstatus $38,000
ⓘ Source: listings_history table (triggers on properties + properties_extension) + one-shot
backfill from property_details.listing_events for pre-trigger history.
Tax reassessment forecast OH · Partial reset (capped growth)
- Current annual tax
- $2,622 · $219/mo
- Projected year-2 tax
- $2,636 · $220/mo
- Expected delta
- +$14/yr (+$1/mo · 0.5%)
ⓘ Screening estimate from a state-policy table — verify with the county assessor before closing.
Climate risk First Street
- Flood 1/10 Low FEMA zone X (unshaded) · 0% chance over 30 yrs
- Wildfire 1/10 Low
- Heat 3/10 Moderate 7 d/yr ≥97°F today · 17 d/yr by 30 yrs out
- Wind 1/10 Low
- Air quality 2/10 Low 0 unhealthy d/yr today · 1 by 30 yrs out
Nearby sold comps map
Loading sold comps map…
Walkable amenities ~0.75 mi
Loading nearby amenities…
Taxation est. · year 1
- Rental income
- $18,171
- − Mortgage interest
- −$9,517
- − Property taxes
- −$2,622
- − Insurance
- −$850
- − Repairs & maintenance
- −$1,454
- − Management
- −$1,454
- − Depreciation
- −$4,943
- Taxable loss
- −$2,667
- Est. tax savings @ 24.0%
- +$640
- After-tax cash flow
- $832/yr
For passive investors: Depreciation is non-cash, so a rental often shows a tax loss while cash-flowing — sheltering income. Rental losses are passive: they offset passive income freely, and up to $25,000/yr can offset ordinary (W-2) income if you actively participate and your MAGI is under $100k (phasing out to $0 by $150k); unused losses carry forward. On sale, claimed depreciation is recaptured at up to 25%, and gains may owe capital-gains tax (a 1031 exchange can defer both). Figures are a year-1 estimate at your 24.0% rate — not tax advice; consult a CPA.
Schools (NCES district)
- District
- Massillon City
- NCES district ID
- 3904435
- Math proficiency
- 43% ▼ -14.00%
- Reading proficiency
- 52% ▼ -11.00%
- Median HH income
- $38,094
- Composite
- 39.54/100
- National rank
- #3941
- State rank
- #487 of 656 in OH
Livability — Massillon
- Score
- 74/100
- State rank
- #306
- US rank
- #4928
Category grades
Schools grade is shown separately in the Schools card above.
Census & demographics
- Census place
- Massillon, OH
- County
- Stark County · 272,865 people
- City population
- 65,858
- Metro
- Canton-Massillon, OH
- Population (ZIP)
- 47,741
- Household income
- $69,179
- Rent vs Own
- Severe rent burden
- 1011.0
Population outlook (Stark County) Hauer SSP2
- Today (2025)
- 373,708 people
- By 2030
- 371,245 · -0.7%
- By 2040
- 361,331 · -3.3%
- By 2050
- 345,290 · -7.6%
- By 2075
- 302,669 · -19.0%
- By 2100
- 238,870 · -36.1%
Race, ethnicity, and origin ACS 2023
- Neighborhood character
- Predominantly White (86%)
- Race & ethnicity
- White 86% Black 7% Two or more races 5% Hispanic / Latino 3% Asian 1%
- Common ancestry
- Lithuanian 3% Romanian 2% Scandinavian 2%
- Foreign-born
- 2% · Canada, China
- Languages at home
- 97% English-only · Spanish 1% Other Indo-European 1%
Political lean MEDSL · Stark
- 2024 margin
- Strong R (+21.9) · D 38.6% · R 60.5%
- 2008→2024 swing
- -27.4pp toward R · 2008: 5.5pp · 2024: -21.9pp
- All cycles
- 2024: R+21.9 2020: R+18.5 2016: R+17.4 2012: R+0.4 2008: D+5.5
Not yet ingested
- Civics
- —
Market trends
- HPI YoY
- ▼ -190.31%
- Current HPI
- 217.8955
- Rent YoY
- ▲ 6.04%
- Metro
- Canton-Massillon, OH
- State GDP YoY
- ▲ 1.98%
- F500 in state
- 48
Industry mix (Fortune 500 HQ in OH)
| Industry | F500 HQs | Revenue |
|---|---|---|
| Insurance | 3 | $145B |
|
||
| Industrial Machinery | 3 | $49B |
|
||
| Financial Services | 3 | $24B |
|
||
| Consumer Goods | 2 | $93B |
|
||
| Aerospace / Defense | 2 | $47B |
|
||
| Utilities | 2 | $33B |
|
||
Price history
+347.1% since first listed39 events — show timeline
- 2026-04-13 Pending — MLSNOW
- 2026-04-08 Price Changed $169,900 MLSNOW
- 2026-03-30 Listed $189,900 MLSNOW
- 2020-11-04 Price Changed $79,900 MLSNOW
- 2020-11-04 Price Changed $79,900 MLSNOW
- 2020-08-25 Price Changed $79,900 MLSNOW
- 2019-08-10 Price Changed $79,900 MLSNOW
- 2019-01-24 Sold (MLS) $70,000 MLSNOW
- 2018-12-13 Pending — MLSNOW
- 2018-11-27 Listed $75,000 MLSNOW
- 2018-10-09 Pending — MLSNOW
- 2018-10-08 Listing Removed — MLSNOW
- 2018-10-03 Listed $69,900 MLSNOW
- 2015-05-16 Price Changed $103,000 MLSNOW
- 2013-11-15 Price Changed $79,900 MLSNOW
- 2013-11-04 Sold (MLS) $61,200 MLSNOW
- 2013-08-02 Listed $57,800 MLSNOW
- 2006-11-22 Sold (Public Records) $119,000 Public Records
- 2006-11-22 Listing Removed — MLSNOW
- 2006-11-22 Sold (MLS) $119,900 MLSNOW
- 2006-08-22 Listed $129,900 MLSNOW
- 2006-08-22 Listed $129,900 MLSNOW
- 2003-10-14 Sold (Public Records) $115,000 Public Records
- 2003-06-09 Listing Removed — MLSNOW
- 2002-12-12 Listed $119,900 MLSNOW
- 2002-02-25 Sold (Public Records) $112,000 Public Records
- 2002-01-17 Listing Removed — MLSNOW
- 2001-12-03 Listed $114,500 MLSNOW
- 2001-11-30 Listing Removed — MLSNOW
- 2001-07-31 Listed $124,500 MLSNOW
- 2001-06-19 Listing Removed — MLSNOW
- 2000-12-21 Listed $103,000 MLSNOW
- 1999-03-23 Price Changed $103,000 MLSNOW
- 1999-03-23 Price Changed $103,000 MLSNOW
- 1999-03-23 Price Changed $103,000 MLSNOW
- 1999-03-23 Price Changed $103,000 MLSNOW
- 1999-03-23 Price Changed $103,000 MLSNOW
- 1999-03-19 Sold (Public Records) $103,000 Public Records
- 1985-07-15 Sold (Public Records) $38,000 Public Records
Property tax history
+3.2%/yrLatest (2024): $2,622 · +26.2% YoY. Source: county tax records.
Cash-flow waterfall
monthlySold comps — $/sqft
last 12 mo · ≤1 miLoading sold comps…